| Param | Original file | Final file |
|---|---|---|
| Filename | modeM0/AS1A10_123T11_9000005014_34987cztM0_level2.evt | modeM0/AS1A10_123T11_9000005014_34987cztM0_level2_quad_clean.evt |
| Size (bytes) | 447,989,760 | 99,599,040 |
| Size | 427.2 MB | 95.0 MB |
| Events in quadrant A | 2,541,122 | 671,479 |
| Events in quadrant B | 3,121,648 | 683,911 |
| Events in quadrant C | 2,903,799 | 691,838 |
| Events in quadrant D | 4,659,950 | 616,896 |
| Mode M0 | |||
|---|---|---|---|
| Quadrant | BADHDUFLAG | Total packets | Discarded packets |
| A | 0 | 10650 | 3 |
| B | 0 | 12383 | 2 |
| C | 0 | 11575 | 2 |
| D | 0 | 17192 | 2 |
| Mode SS | |||
|---|---|---|---|
| Quadrant | BADHDUFLAG | Total packets | Discarded packets |
| A | 0 | 104 | 0 |
| B | 0 | 104 | 0 |
| C | 0 | 104 | 0 |
| D | 0 | 104 | 0 |
| Mode M9 | |||
|---|---|---|---|
| Quadrant | BADHDUFLAG | Total packets | Discarded packets |
| A | 0 | 41 | 0 |
| B | 0 | 41 | 0 |
| C | 0 | 41 | 0 |
| D | 0 | 41 | 0 |
| Quadrant | Total seconds | Saturated seconds | Saturation percentage |
|---|---|---|---|
| A | 5024 | 11 | 0.218949% |
| B | 5024 | 154 | 3.065287% |
| C | 5024 | 81 | 1.612261% |
| D | 5024 | 473 | 9.414809% |
Noise dominated data is calculated using 1-second bins in cleaned event files. If a bin has >2000 counts, and if more than 50% of those come from <1% of pixels, then it is considered to be noise-dominated and hence unusable.
| Quadrant | # 1 sec bins | Bins with >0 counts | Bins with >2000 counts | High rate bins dominated by noise | Noise dominated (total time) | Noise dominated (detector-on time) | Marked lightcurve |
|---|---|---|---|---|---|---|---|
| A | 9151 | 5026 | 1 | 1 | 0.01% | 0.02% | 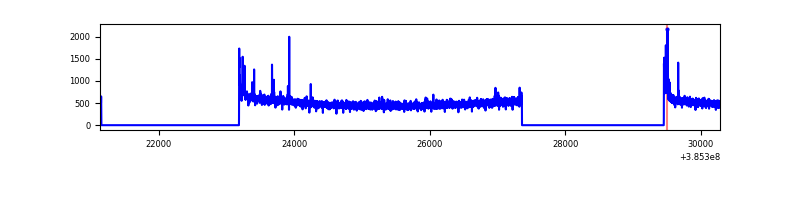 |
| B | 9151 | 5026 | 110 | 110 | 1.20% | 2.19% | 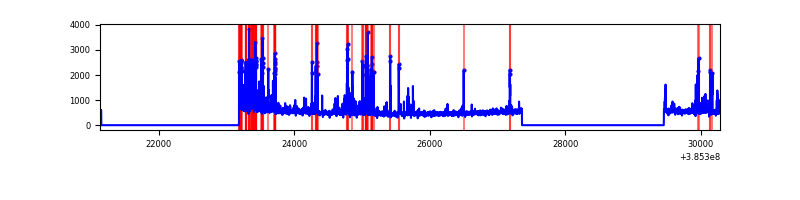 |
| C | 9151 | 5026 | 70 | 70 | 0.76% | 1.39% | 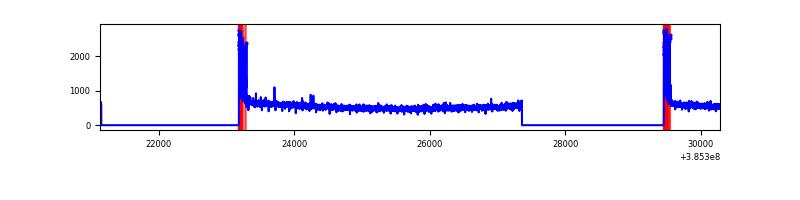 |
| D | 9151 | 5026 | 448 | 448 | 4.90% | 8.91% | 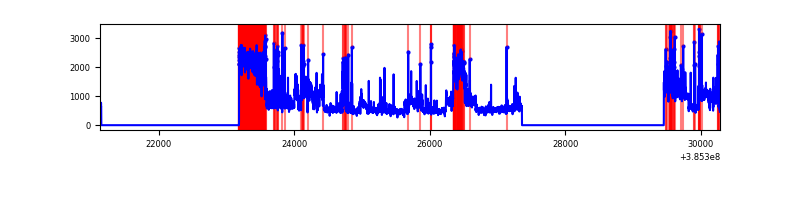 |
Top three noisy pixels from each quadrant. If the there are fewer than three noisy pixels in the level2.evt file, extra rows are filled as -1
| Pixel properties | Quadrant properties | ||||||
|---|---|---|---|---|---|---|---|
| Quadrant | DetID | PixID | Counts | Sigma | Mean | Median | Sigma |
| A | 10 | 83 | 72083 | 569.16 | 630 | 619 | 125.6 |
| A | 9 | 143 | 30514 | 238.09 | 630 | 619 | 125.6 |
| A | 13 | 254 | 8200 | 60.37 | 630 | 619 | 125.6 |
| B | 5 | 172 | 505680 | 4224.15 | 629 | 612 | 119.6 |
| B | 5 | 173 | 46348 | 382.51 | 629 | 612 | 119.6 |
| B | 3 | 112 | 44021 | 363.05 | 629 | 612 | 119.6 |
| C | 0 | 10 | 219445 | 1512.1 | 629 | 635 | 144.7 |
| C | 15 | 214 | 209429 | 1442.88 | 629 | 635 | 144.7 |
| C | 14 | 67 | 16087 | 106.78 | 629 | 635 | 144.7 |
| D | 8 | 195 | 1121303 | 7839.89 | 590 | 575 | 143.0 |
| D | 10 | 118 | 650248 | 4544.69 | 590 | 575 | 143.0 |
| D | 8 | 230 | 228189 | 1592.24 | 590 | 575 | 143.0 |
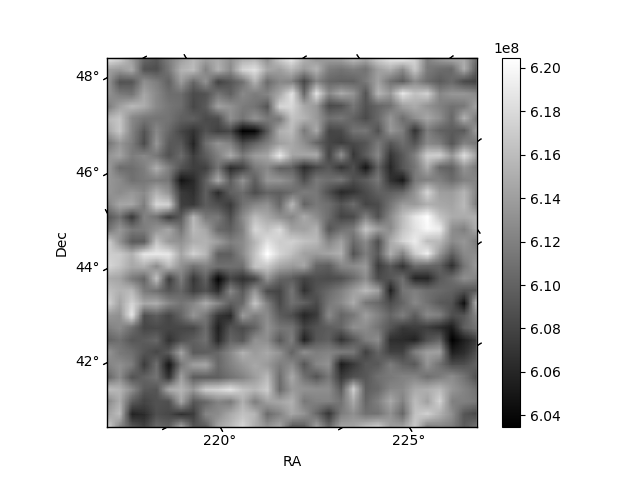
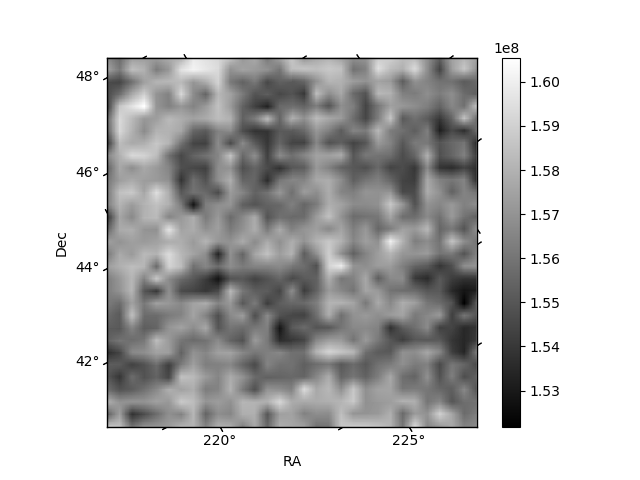
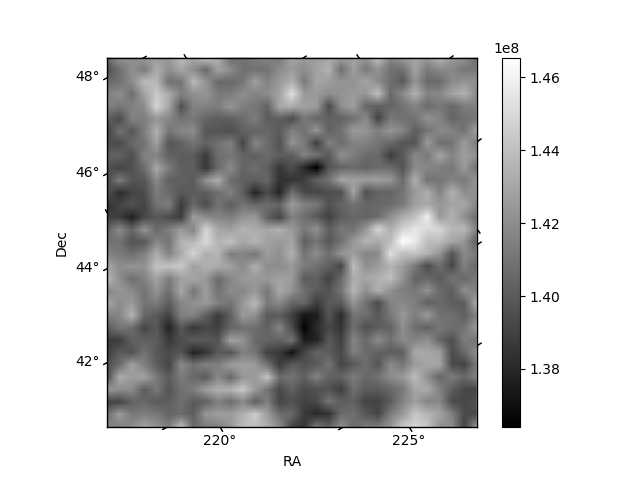
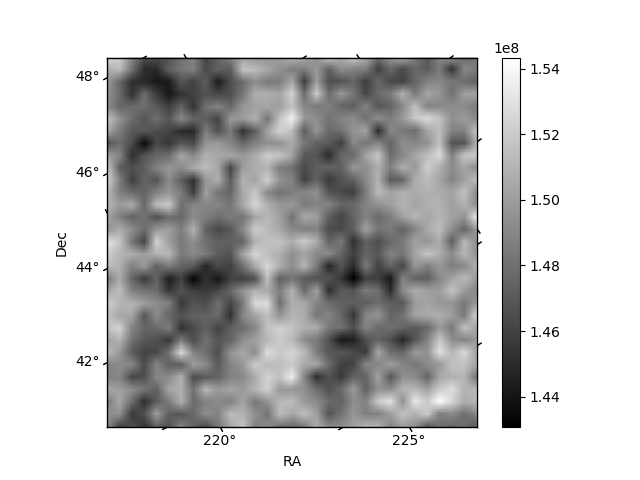
Histogram calculated using DETX and DETY for each event in the final _common_clean file
| Quadrant A | 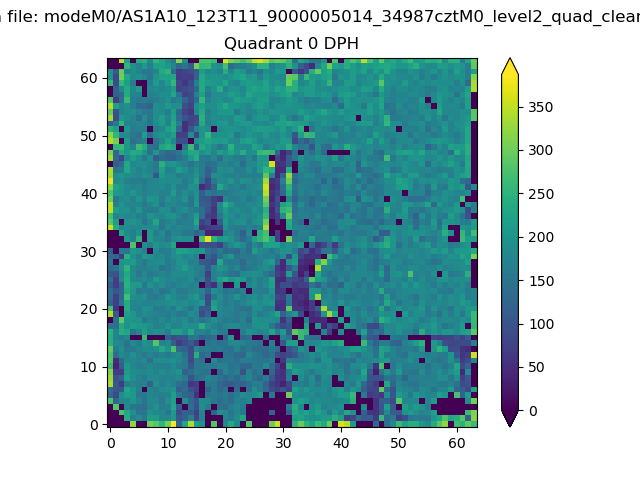 |
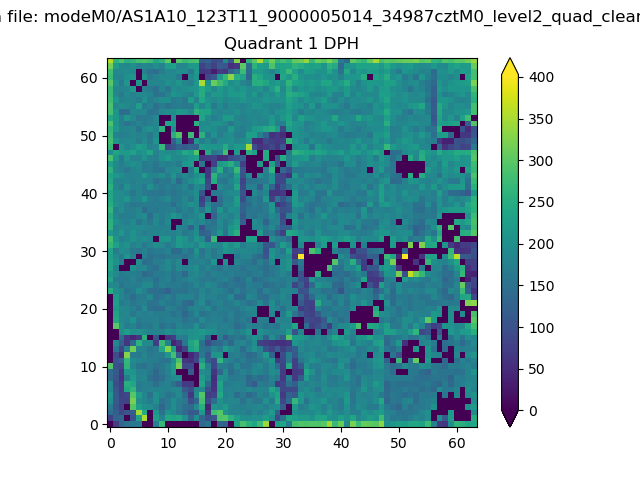 |
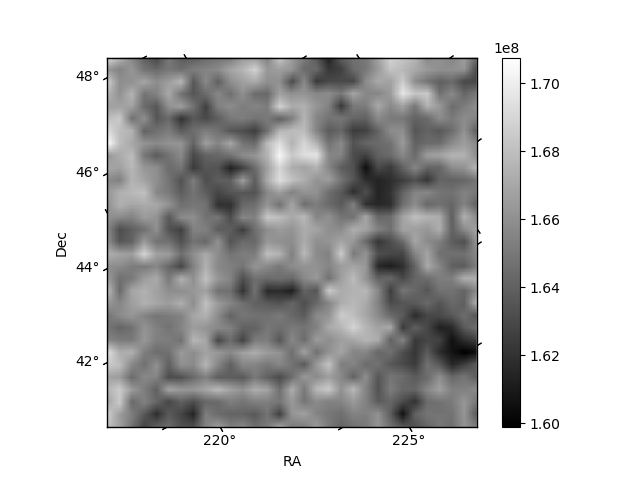
Quadrant B |
|---|---|---|---|
| Quadrant D | 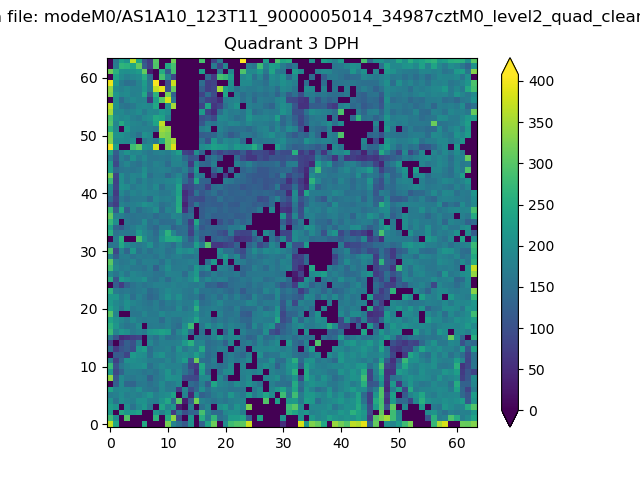 |
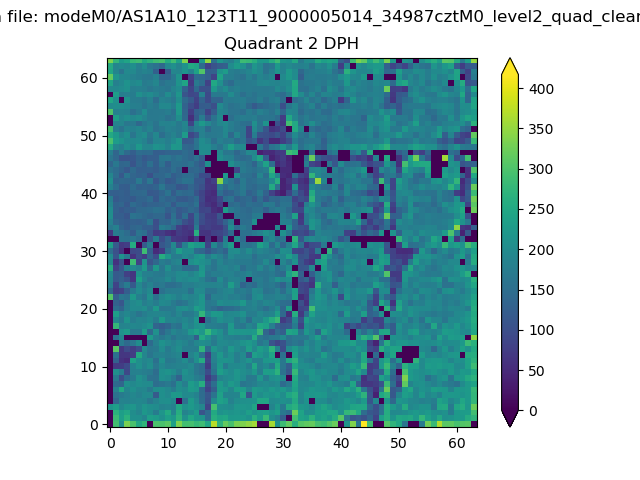 |
Quadrant C |
| Plot type | Count rate plots | Images |
|---|---|---|
| Comparison with Poisson distribution Blue bars denote a histogram of data divided into 1 sec bins. Red curve is a Poisson curve with rate = median count rate of data. |
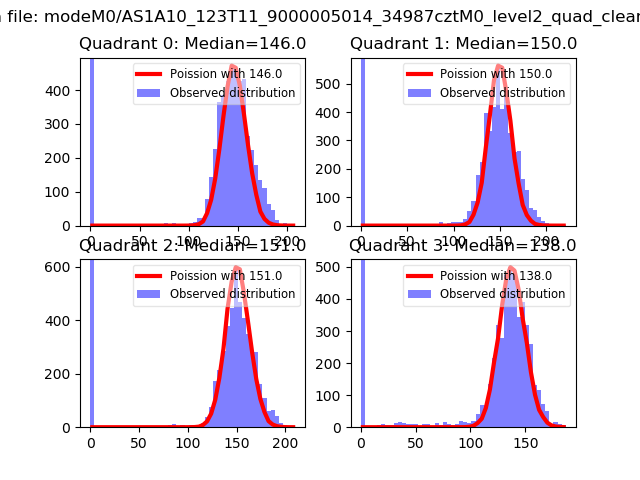 |
 |
| Quadrant-wise count rates Data is divided into 100 sec bins |
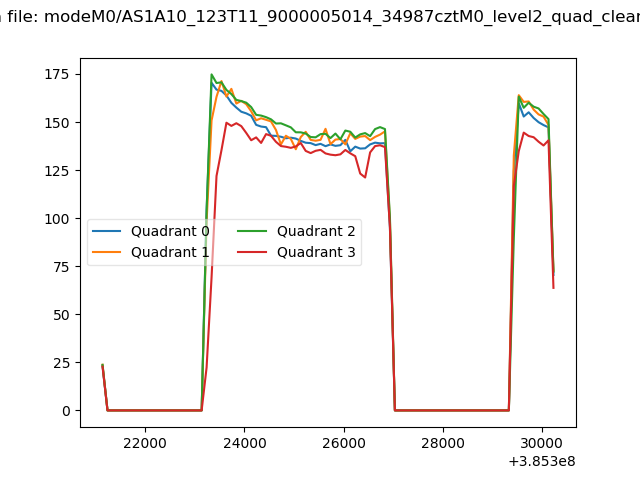 |
|
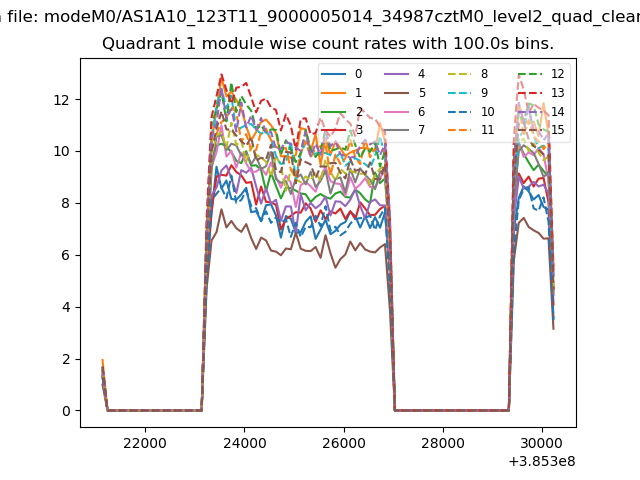
| Module-wise count rates for Quadrant A Data is divided into 100 sec bins |
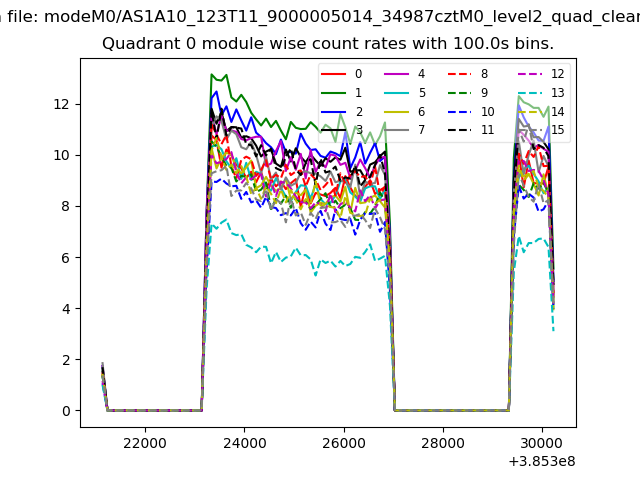 |
 |
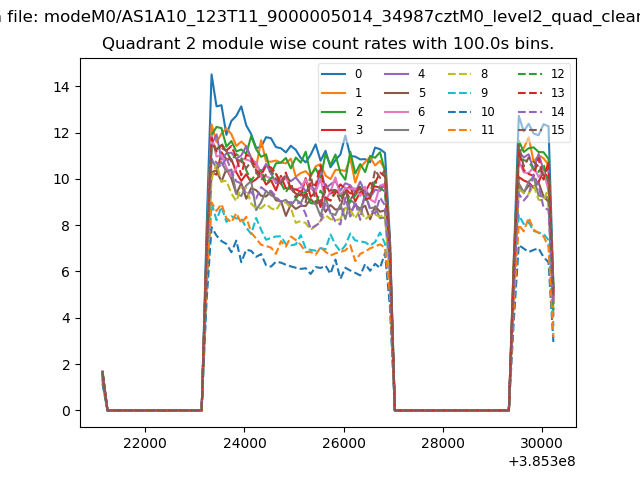
| Module-wise count rates for Quadrant B Data is divided into 100 sec bins |
 |
 |
| Module-wise count rates for Quadrant C Data is divided into 100 sec bins |
 |
 |
| Module-wise count rates for Quadrant D Data is divided into 100 sec bins |
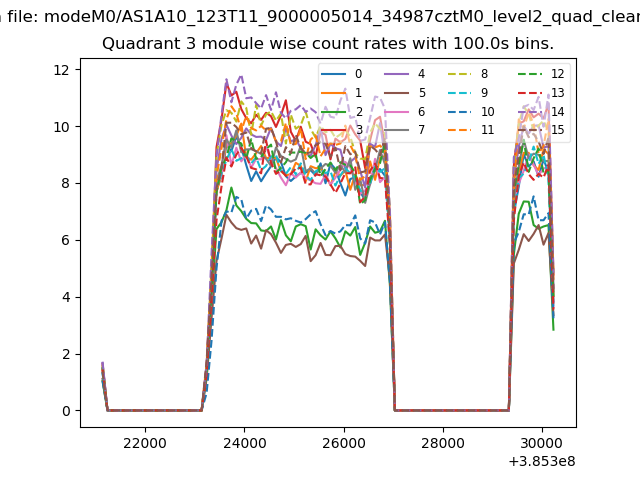 |
 |
| Parameter | Plot |
|---|---|
| CZT HV Monitor | 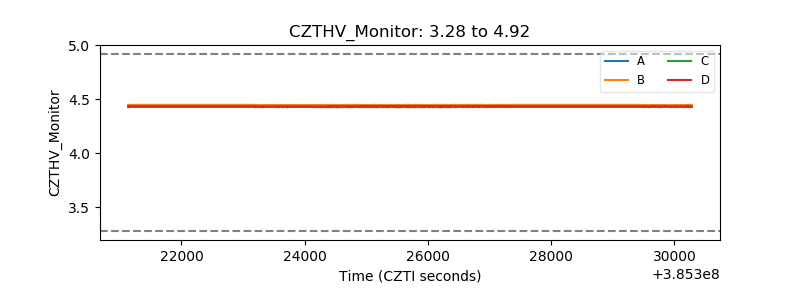 |
| D_VDD | 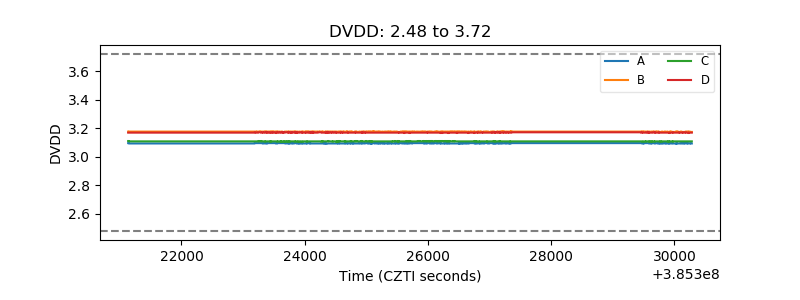 |
| Temperature 1 | 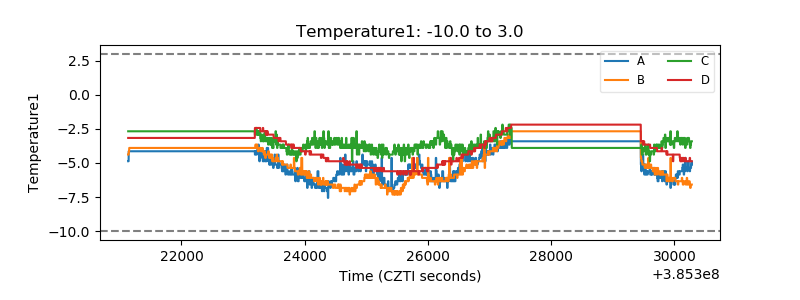 |
| Veto HV Monitor | 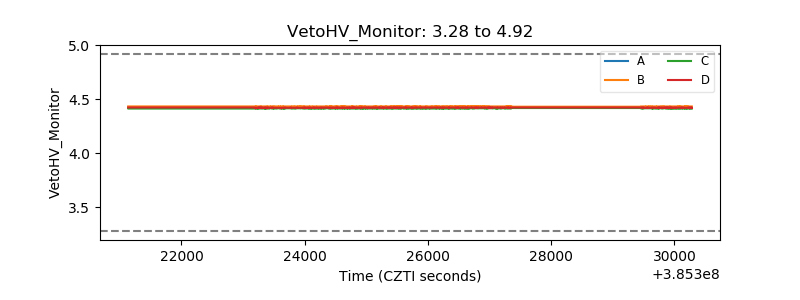 |
| Veto LLD | 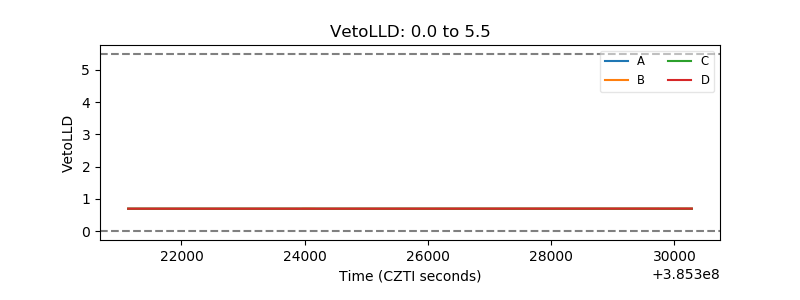 |
| Alpha Counter | 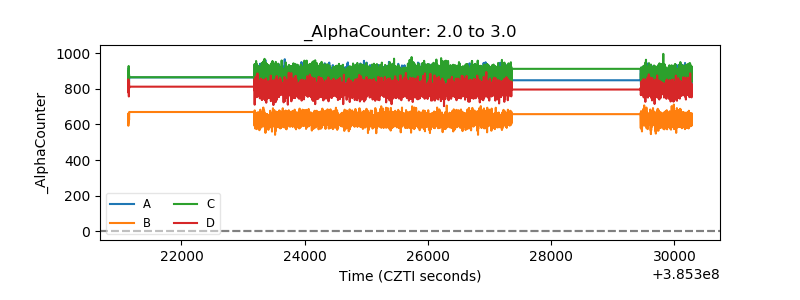 |
| _CPM_Rate | 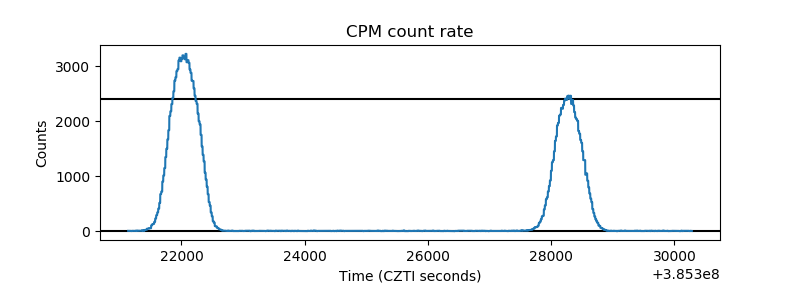 |
| CZT Counter | 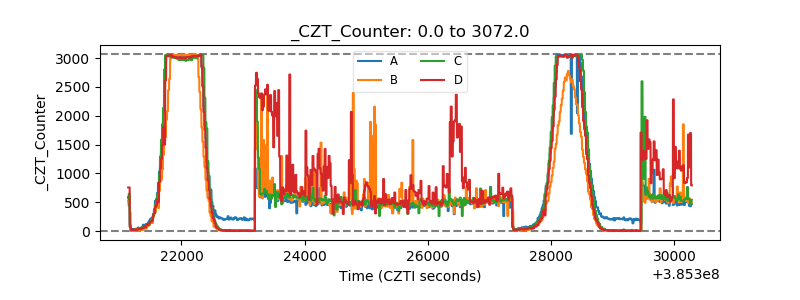 |
| +2.5 Volts monitor | 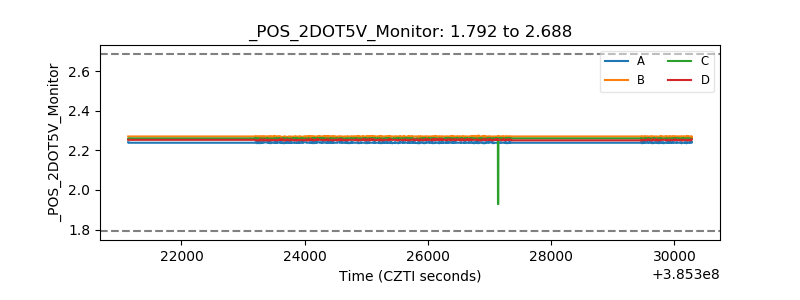 |
| +5 Volts monitor | 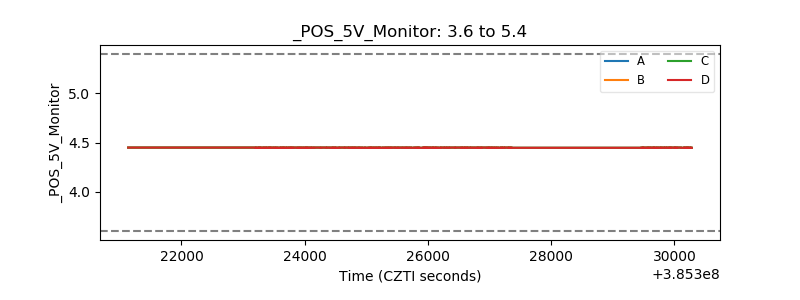 |
| _ROLL_ROT | 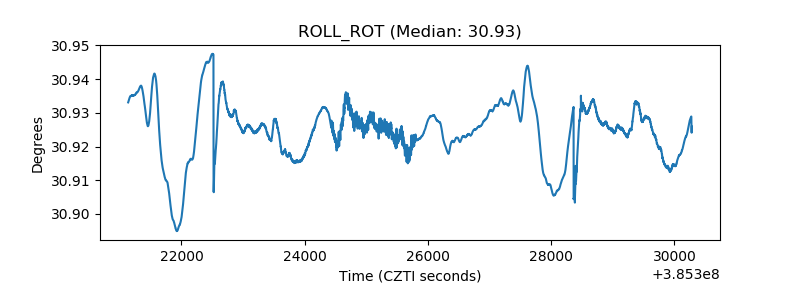 |
| _Roll_DEC | 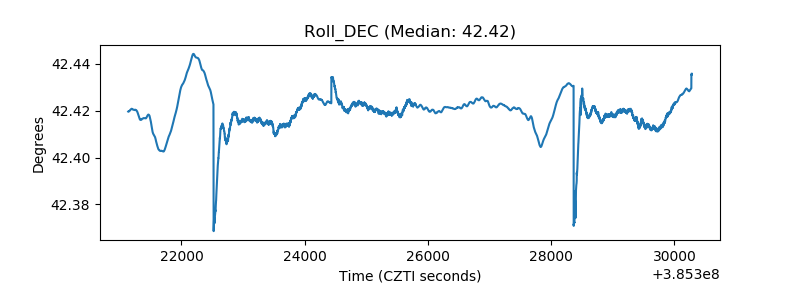 |
| _Roll_RA | 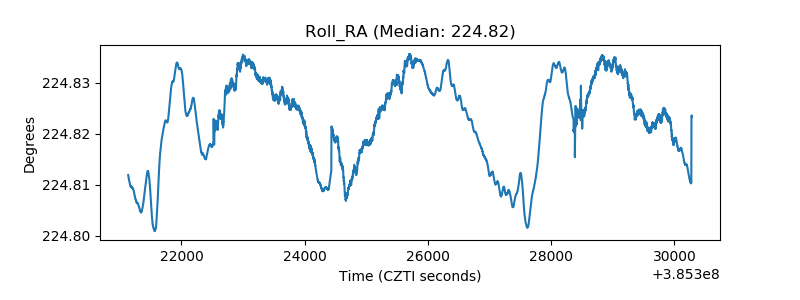 |
| Veto Counter | 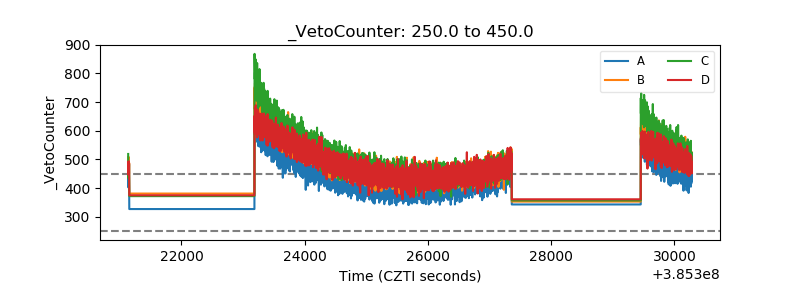 |