| Param | Original file | Final file |
|---|---|---|
| Filename | modeM0/AS1A10_123T11_9000005014_34985cztM0_level2.evt | modeM0/AS1A10_123T11_9000005014_34985cztM0_level2_quad_clean.evt |
| Size (bytes) | 233,493,120 | 45,754,560 |
| Size | 222.7 MB | 43.6 MB |
| Events in quadrant A | 1,361,540 | 298,799 |
| Events in quadrant B | 1,628,364 | 303,043 |
| Events in quadrant C | 1,506,576 | 304,672 |
| Events in quadrant D | 2,390,949 | 286,350 |
| Mode M0 | |||
|---|---|---|---|
| Quadrant | BADHDUFLAG | Total packets | Discarded packets |
| A | 0 | 5830 | 2 |
| B | 0 | 6600 | 1 |
| C | 0 | 6180 | 1 |
| D | 0 | 8956 | 1 |
| Mode SS | |||
|---|---|---|---|
| Quadrant | BADHDUFLAG | Total packets | Discarded packets |
| A | 0 | 56 | 0 |
| B | 0 | 56 | 0 |
| C | 0 | 56 | 0 |
| D | 0 | 56 | 0 |
| Mode M9 | |||
|---|---|---|---|
| Quadrant | BADHDUFLAG | Total packets | Discarded packets |
| A | 0 | 19 | 0 |
| B | 0 | 19 | 0 |
| C | 0 | 19 | 0 |
| D | 0 | 19 | 0 |
| Quadrant | Total seconds | Saturated seconds | Saturation percentage |
|---|---|---|---|
| A | 2685 | 2 | 0.074488% |
| B | 2685 | 54 | 2.011173% |
| C | 2685 | 28 | 1.042831% |
| D | 2685 | 81 | 3.016760% |
Noise dominated data is calculated using 1-second bins in cleaned event files. If a bin has >2000 counts, and if more than 50% of those come from <1% of pixels, then it is considered to be noise-dominated and hence unusable.
| Quadrant | # 1 sec bins | Bins with >0 counts | Bins with >2000 counts | High rate bins dominated by noise | Noise dominated (total time) | Noise dominated (detector-on time) | Marked lightcurve |
|---|---|---|---|---|---|---|---|
| A | 4598 | 2686 | 0 | 0 | 0.00% | 0.00% | 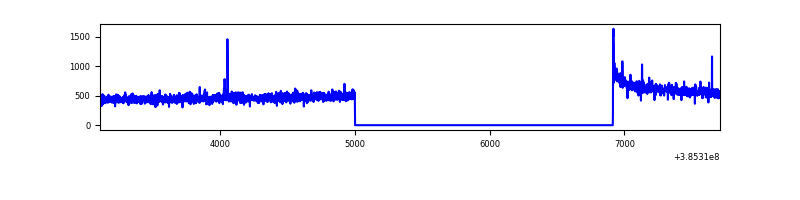 |
| B | 4598 | 2686 | 34 | 34 | 0.74% | 1.27% | 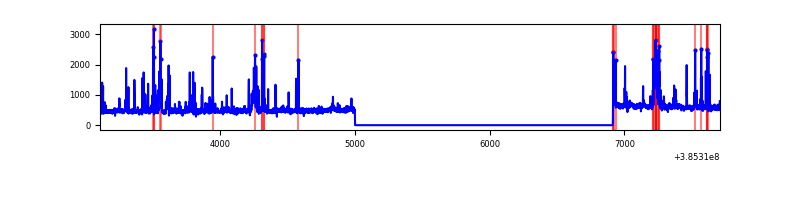 |
| C | 4598 | 2686 | 20 | 20 | 0.43% | 0.74% | 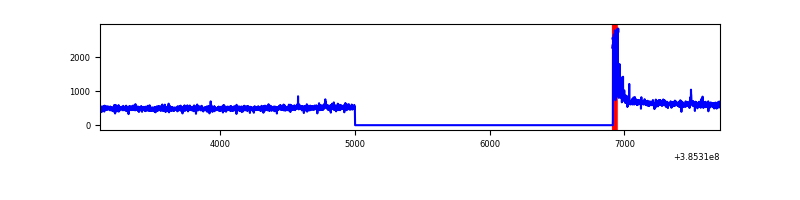 |
| D | 4598 | 2686 | 55 | 55 | 1.20% | 2.05% | 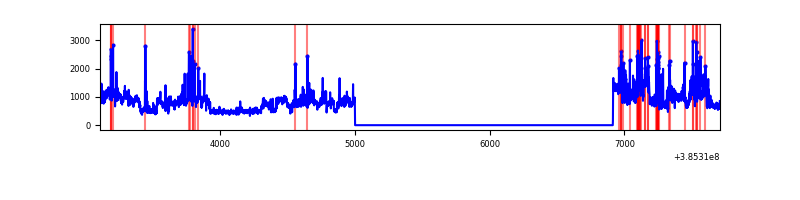 |
Top three noisy pixels from each quadrant. If the there are fewer than three noisy pixels in the level2.evt file, extra rows are filled as -1
| Pixel properties | Quadrant properties | ||||||
|---|---|---|---|---|---|---|---|
| Quadrant | DetID | PixID | Counts | Sigma | Mean | Median | Sigma |
| A | 10 | 83 | 38175 | 541.73 | 338 | 332 | 69.9 |
| A | 9 | 143 | 8660 | 119.22 | 338 | 332 | 69.9 |
| A | 13 | 6 | 6147 | 83.24 | 338 | 332 | 69.9 |
| B | 5 | 172 | 252899 | 3889.57 | 336 | 328 | 64.9 |
| B | 0 | 155 | 32761 | 499.47 | 336 | 328 | 64.9 |
| B | 12 | 111 | 7715 | 113.76 | 336 | 328 | 64.9 |
| C | 15 | 214 | 112955 | 1454.37 | 333 | 335 | 77.4 |
| C | 0 | 10 | 72996 | 938.34 | 333 | 335 | 77.4 |
| C | 14 | 67 | 14289 | 180.2 | 333 | 335 | 77.4 |
| D | 8 | 195 | 789135 | 9685.28 | 329 | 320 | 81.4 |
| D | 2 | 249 | 137012 | 1678.34 | 329 | 320 | 81.4 |
| D | 10 | 118 | 83480 | 1021.06 | 329 | 320 | 81.4 |
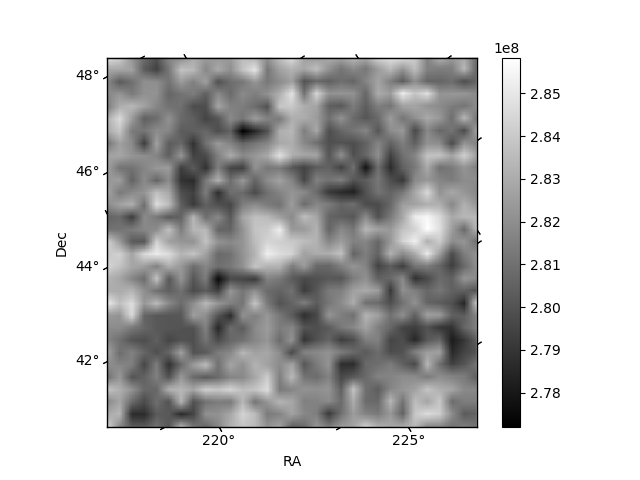
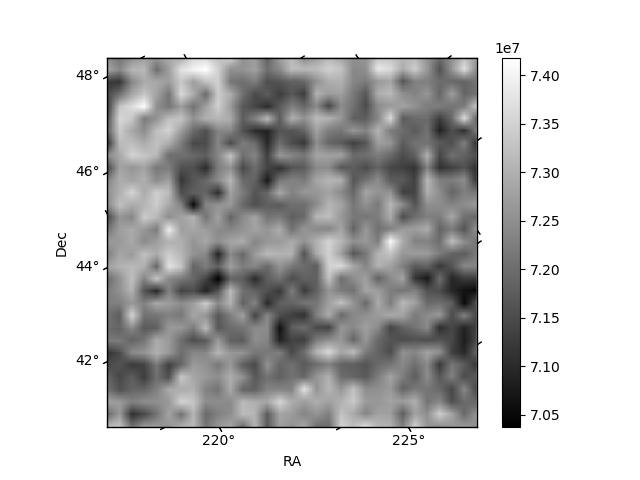
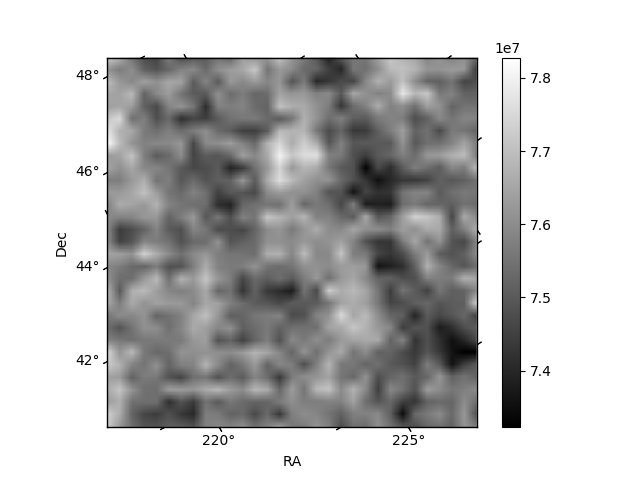
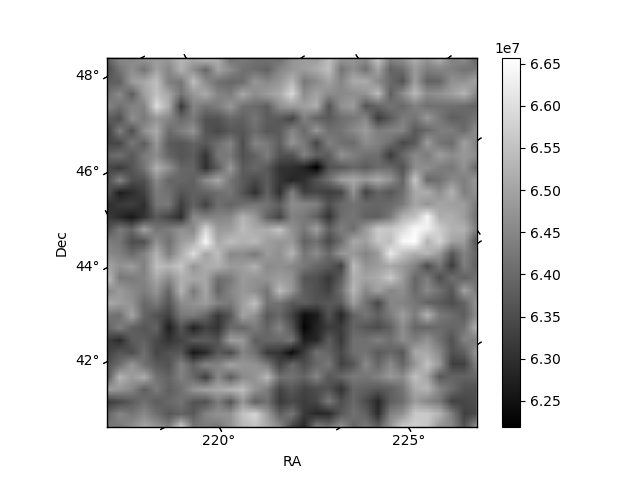
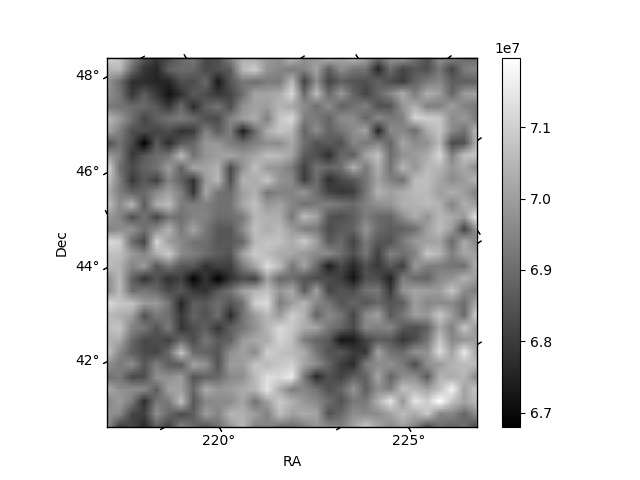
Histogram calculated using DETX and DETY for each event in the final _common_clean file
| Quadrant A | 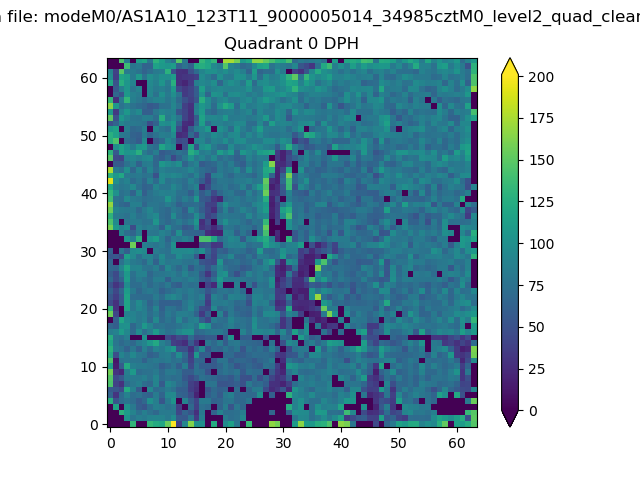 |
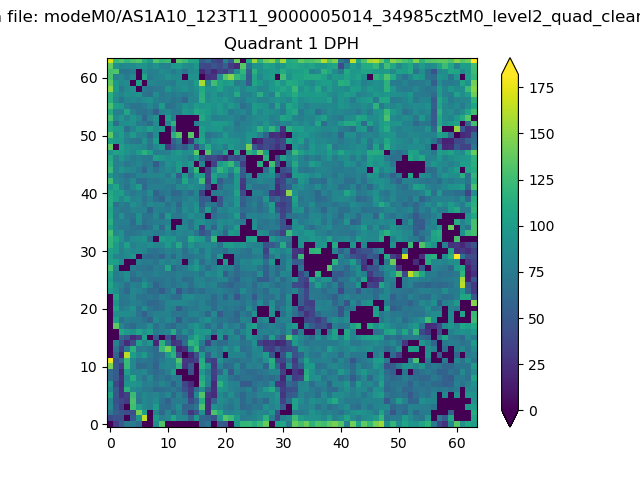 |
Quadrant B |
|---|---|---|---|
| Quadrant D | 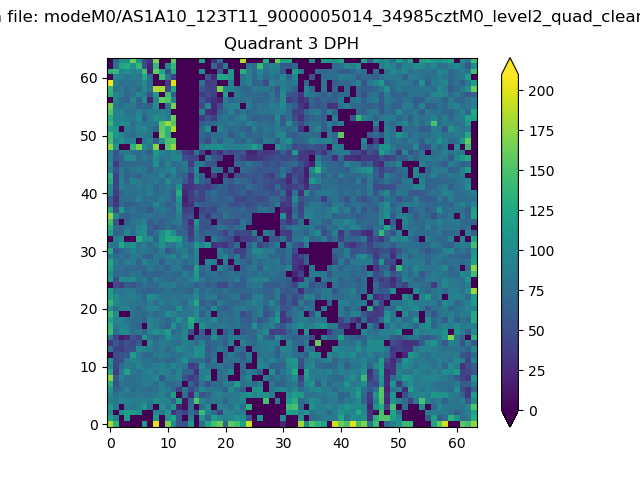 |
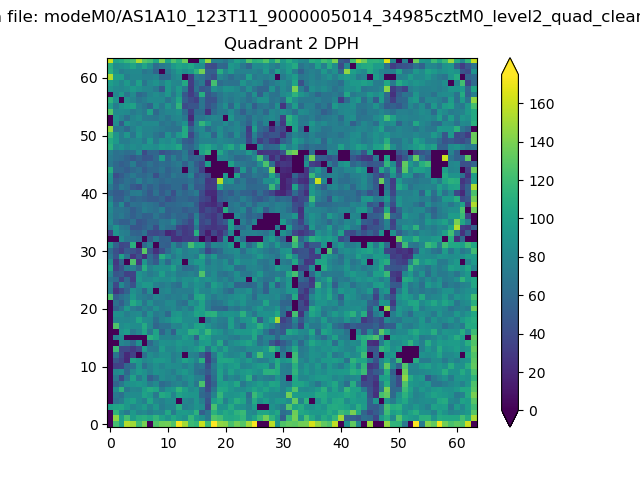 |
Quadrant C |
| Plot type | Count rate plots | Images |
|---|---|---|
| Comparison with Poisson distribution Blue bars denote a histogram of data divided into 1 sec bins. Red curve is a Poisson curve with rate = median count rate of data. |
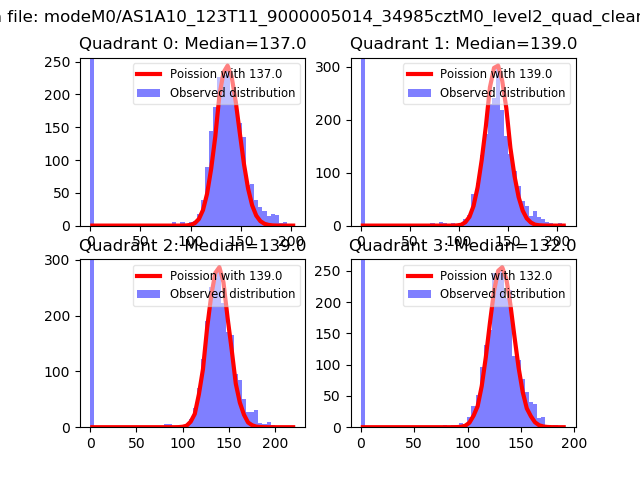 |
 |
| Quadrant-wise count rates Data is divided into 100 sec bins |
 |
|
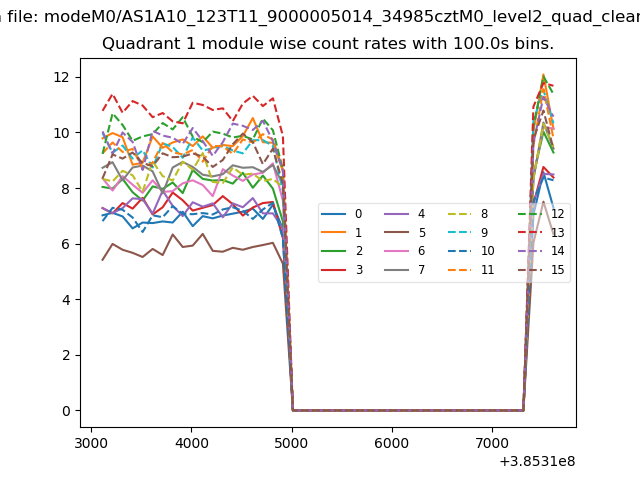
| Module-wise count rates for Quadrant A Data is divided into 100 sec bins |
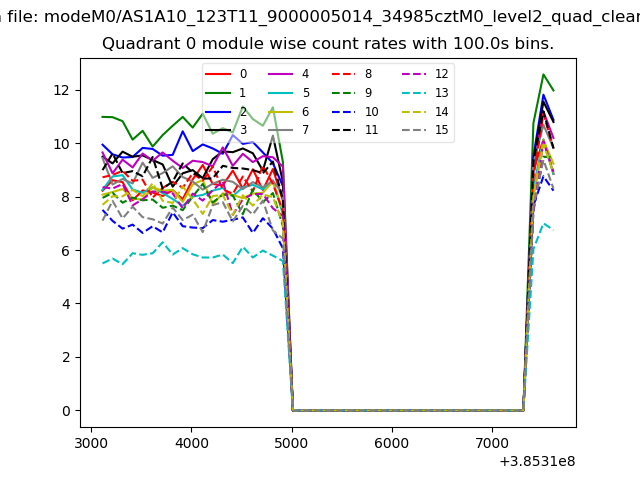 |
 |
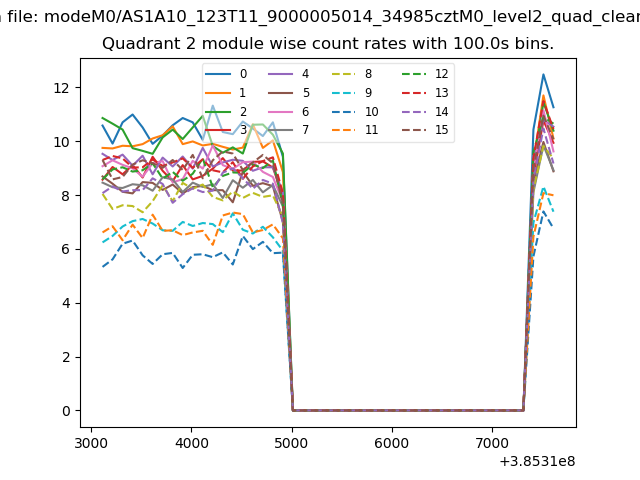
| Module-wise count rates for Quadrant B Data is divided into 100 sec bins |
 |
 |
| Module-wise count rates for Quadrant C Data is divided into 100 sec bins |
 |
 |
| Module-wise count rates for Quadrant D Data is divided into 100 sec bins |
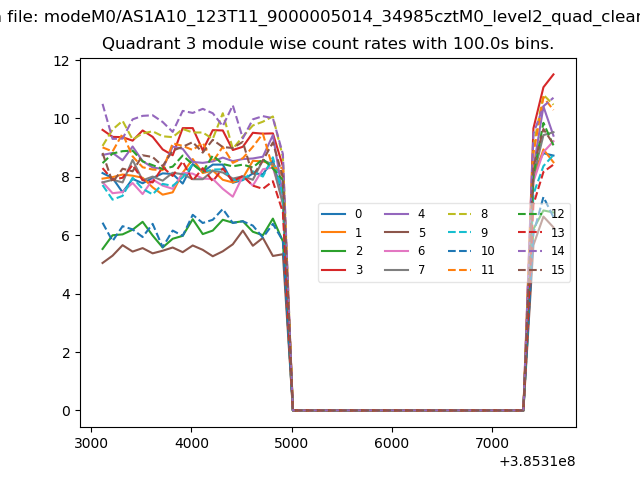 |
 |
| Parameter | Plot |
|---|---|
| CZT HV Monitor | 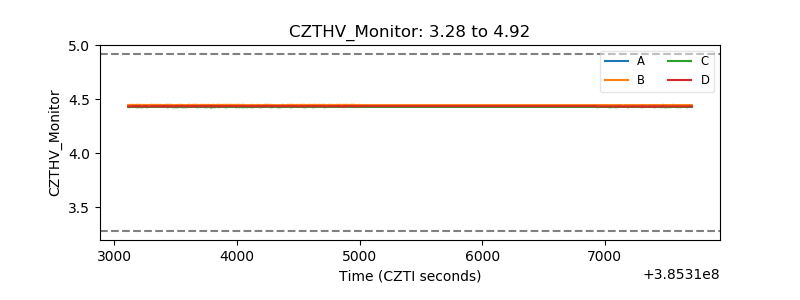 |
| D_VDD | 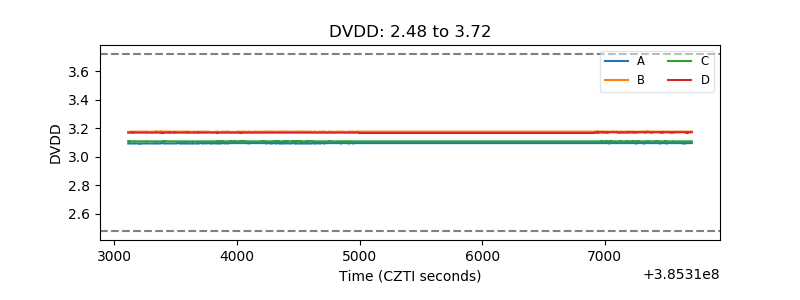 |
| Temperature 1 | 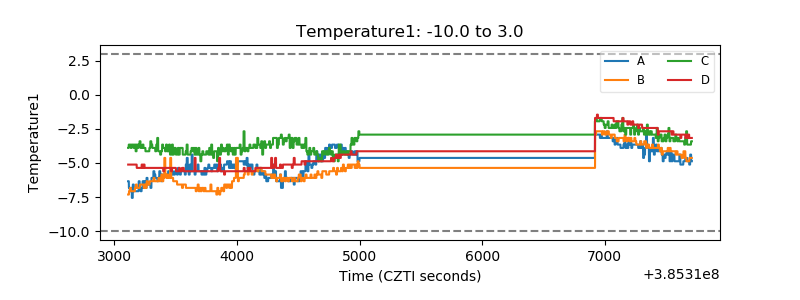 |
| Veto HV Monitor | 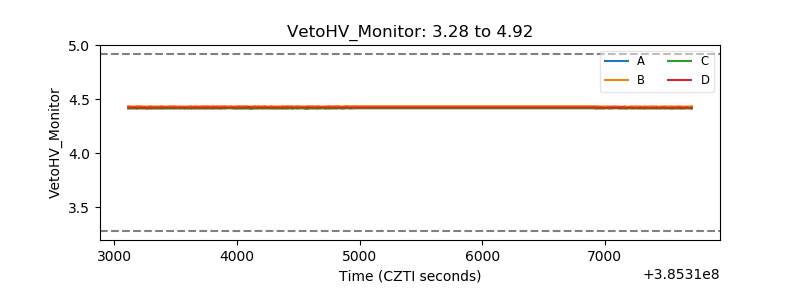 |
| Veto LLD | 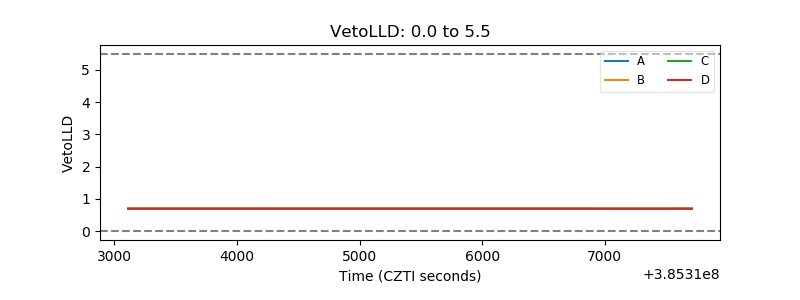 |
| Alpha Counter | 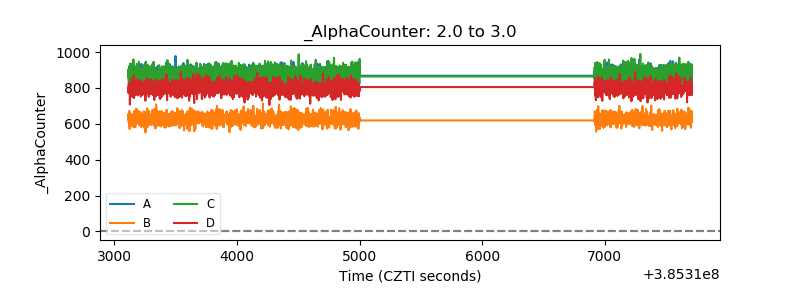 |
| _CPM_Rate | 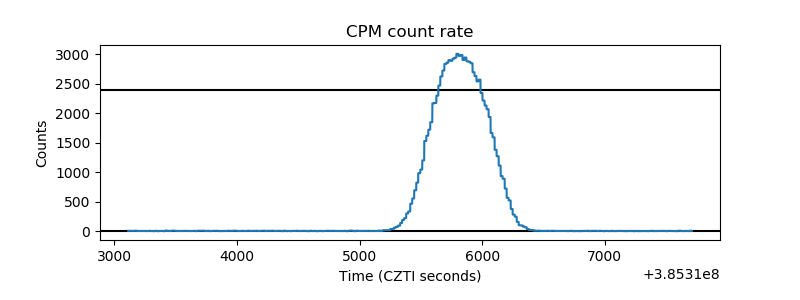 |
| CZT Counter | 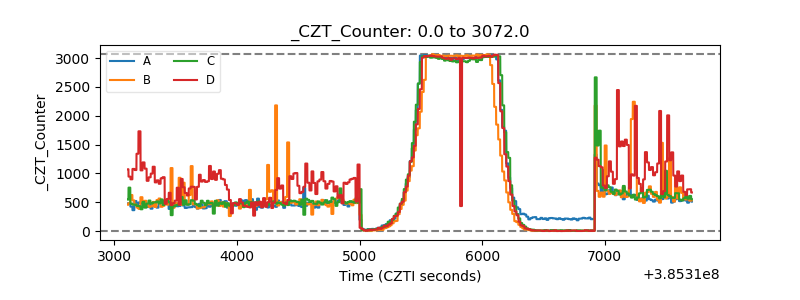 |
| +2.5 Volts monitor | 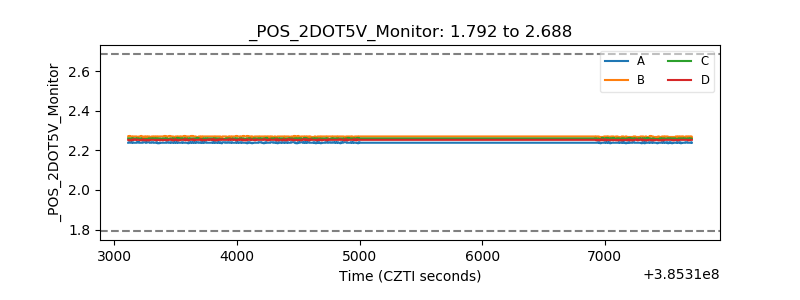 |
| +5 Volts monitor | 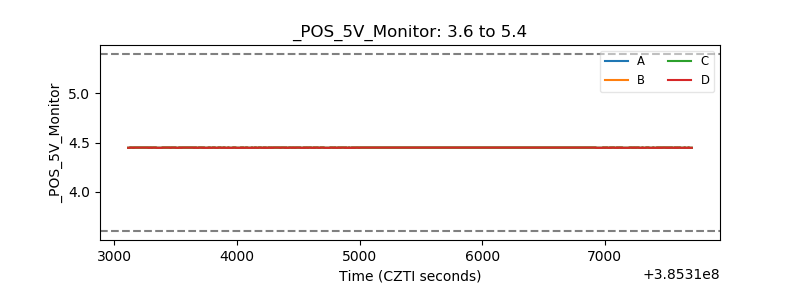 |
| _ROLL_ROT | 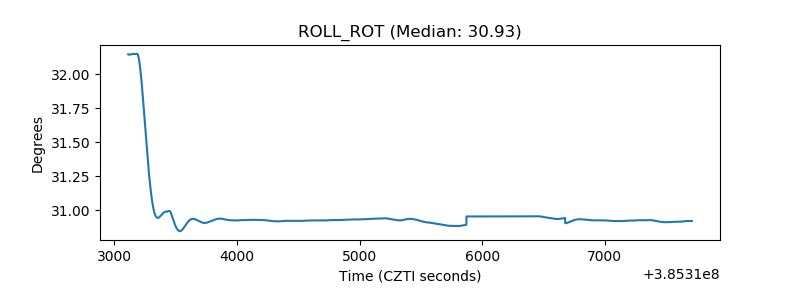 |
| _Roll_DEC | 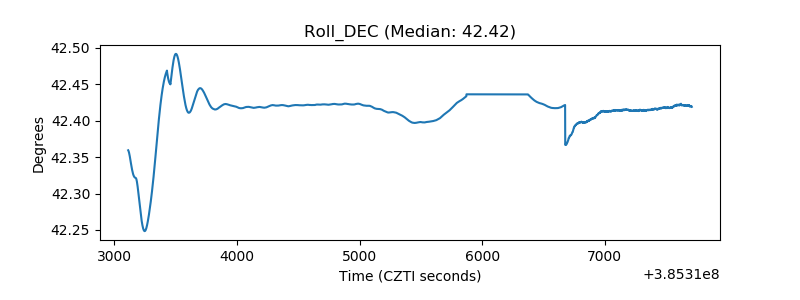 |
| _Roll_RA | 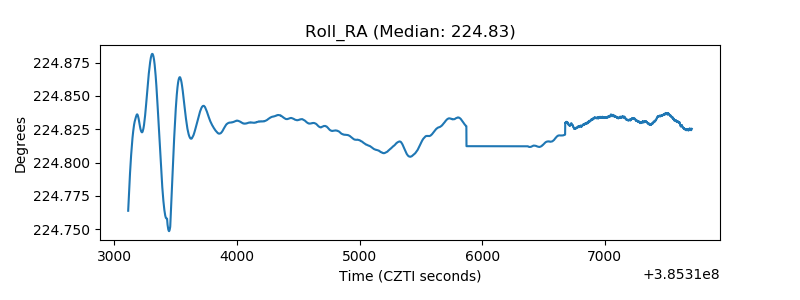 |
| Veto Counter | 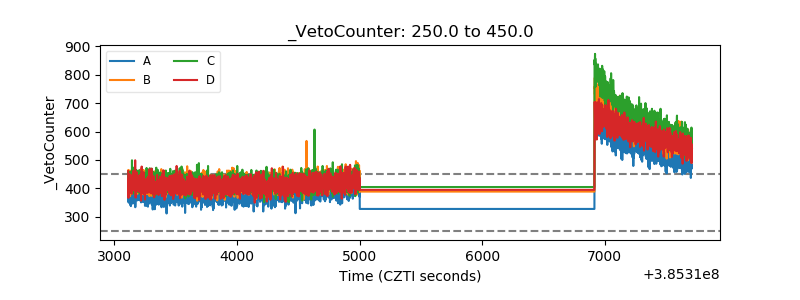 |