| Param | Original file | Final file |
|---|---|---|
| Filename | modeM0/AS1A10_123T09_9000005012_34985cztM0_level2.evt | modeM0/AS1A10_123T09_9000005012_34985cztM0_level2_quad_clean.evt |
| Size (bytes) | 172,595,520 | 29,067,840 |
| Size | 164.6 MB | 27.7 MB |
| Events in quadrant A | 1,072,645 | 185,884 |
| Events in quadrant B | 1,113,231 | 189,290 |
| Events in quadrant C | 1,172,101 | 184,977 |
| Events in quadrant D | 1,729,741 | 172,824 |
| Mode SS | |||
|---|---|---|---|
| Quadrant | BADHDUFLAG | Total packets | Discarded packets |
| A | 0 | 40 | 0 |
| B | 0 | 40 | 0 |
| C | 0 | 40 | 0 |
| D | 0 | 40 | 0 |
| Mode M0 | |||
|---|---|---|---|
| Quadrant | BADHDUFLAG | Total packets | Discarded packets |
| A | 0 | 4452 | 1 |
| B | 0 | 4507 | 1 |
| C | 0 | 4673 | 1 |
| D | 0 | 6591 | 1 |
| Mode M9 | |||
|---|---|---|---|
| Quadrant | BADHDUFLAG | Total packets | Discarded packets |
| A | 0 | 15 | 0 |
| B | 0 | 15 | 0 |
| C | 0 | 15 | 0 |
| D | 0 | 16 | 0 |
| Quadrant | Total seconds | Saturated seconds | Saturation percentage |
|---|---|---|---|
| A | 2022 | 11 | 0.544016% |
| B | 2022 | 16 | 0.791296% |
| C | 2022 | 28 | 1.384768% |
| D | 2022 | 34 | 1.681503% |
Noise dominated data is calculated using 1-second bins in cleaned event files. If a bin has >2000 counts, and if more than 50% of those come from <1% of pixels, then it is considered to be noise-dominated and hence unusable.
| Quadrant | # 1 sec bins | Bins with >0 counts | Bins with >2000 counts | High rate bins dominated by noise | Noise dominated (total time) | Noise dominated (detector-on time) | Marked lightcurve |
|---|---|---|---|---|---|---|---|
| A | 2022 | 2022 | 4 | 4 | 0.20% | 0.20% | 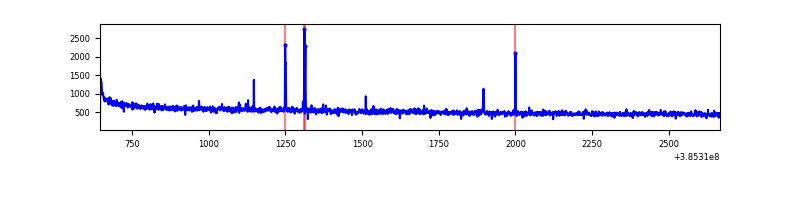 |
| B | 2022 | 2022 | 10 | 10 | 0.49% | 0.49% | 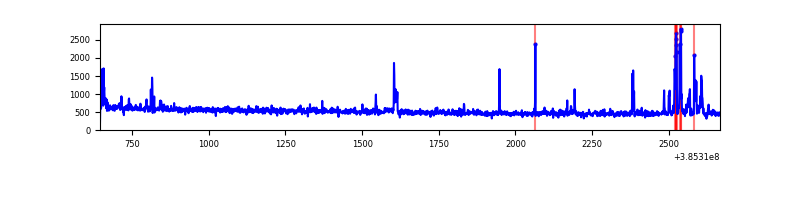 |
| C | 2022 | 2022 | 21 | 21 | 1.04% | 1.04% | 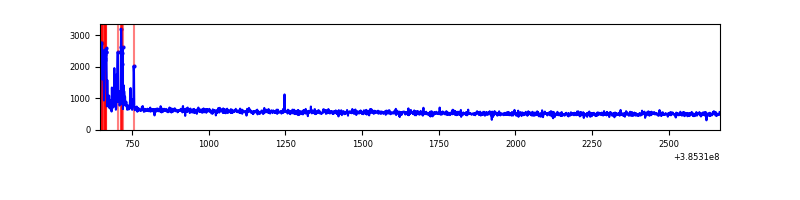 |
| D | 2022 | 2022 | 13 | 13 | 0.64% | 0.64% | 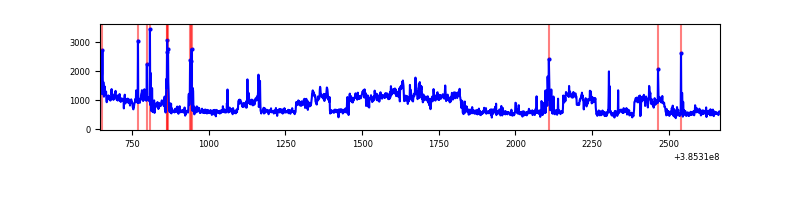 |
Top three noisy pixels from each quadrant. If the there are fewer than three noisy pixels in the level2.evt file, extra rows are filled as -1
| Pixel properties | Quadrant properties | ||||||
|---|---|---|---|---|---|---|---|
| Quadrant | DetID | PixID | Counts | Sigma | Mean | Median | Sigma |
| A | 10 | 83 | 34972 | 652.0 | 262 | 256 | 53.2 |
| A | 9 | 143 | 19288 | 357.44 | 262 | 256 | 53.2 |
| A | 13 | 254 | 3416 | 59.35 | 262 | 256 | 53.2 |
| B | 5 | 172 | 63950 | 1271.76 | 259 | 253 | 50.1 |
| B | 4 | 232 | 20867 | 411.58 | 259 | 253 | 50.1 |
| B | 12 | 111 | 5635 | 107.46 | 259 | 253 | 50.1 |
| C | 15 | 214 | 85508 | 1411.06 | 257 | 259 | 60.4 |
| C | 0 | 10 | 78835 | 1300.61 | 257 | 259 | 60.4 |
| C | 14 | 67 | 2407 | 35.55 | 257 | 259 | 60.4 |
| D | 8 | 195 | 618174 | 9614.73 | 259 | 252 | 64.3 |
| D | 13 | 249 | 38622 | 597.03 | 259 | 252 | 64.3 |
| D | 12 | 6 | 17623 | 270.29 | 259 | 252 | 64.3 |
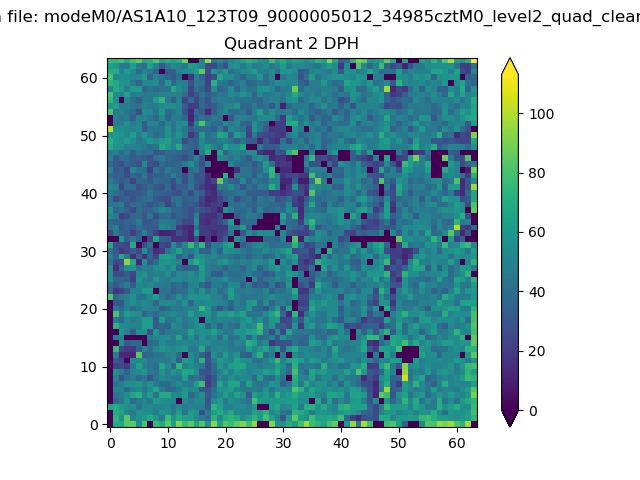
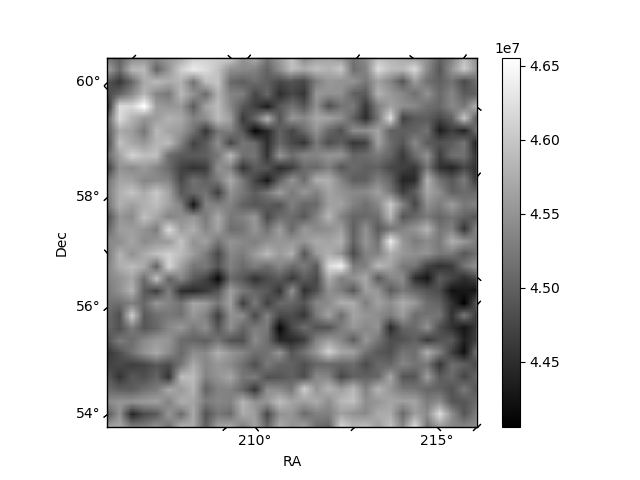
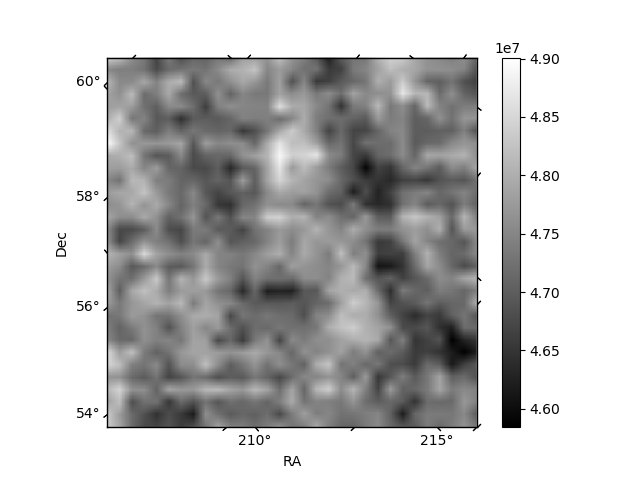
Histogram calculated using DETX and DETY for each event in the final _common_clean file
| Quadrant A | 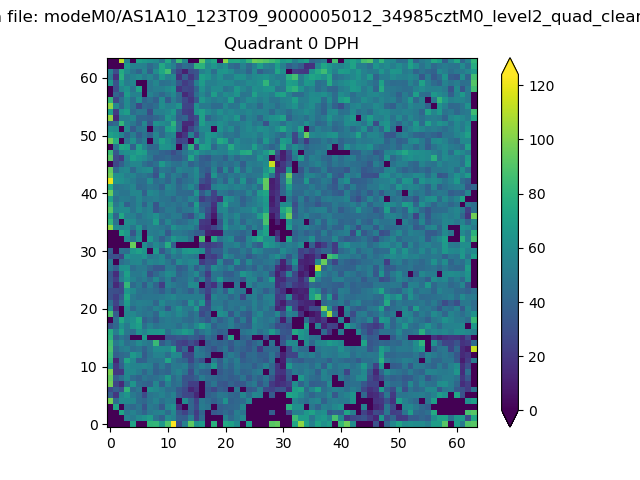 |
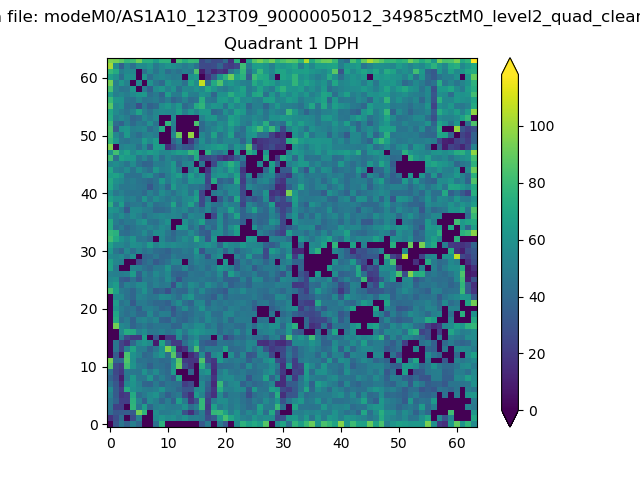 |
Quadrant B |
|---|---|---|---|
| Quadrant D | 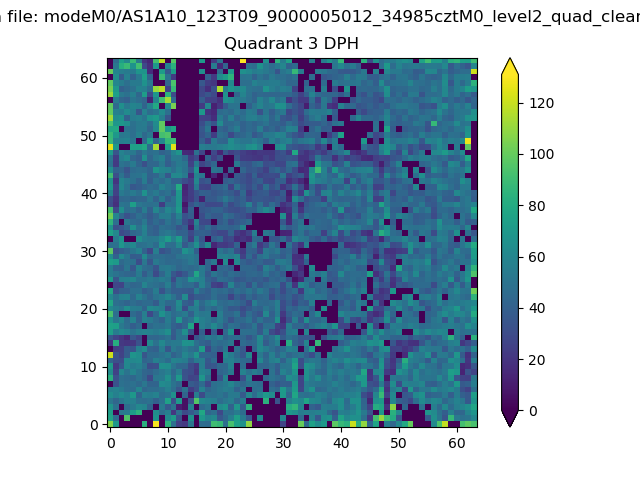 |
 |
Quadrant C |
| Plot type | Count rate plots | Images |
|---|---|---|
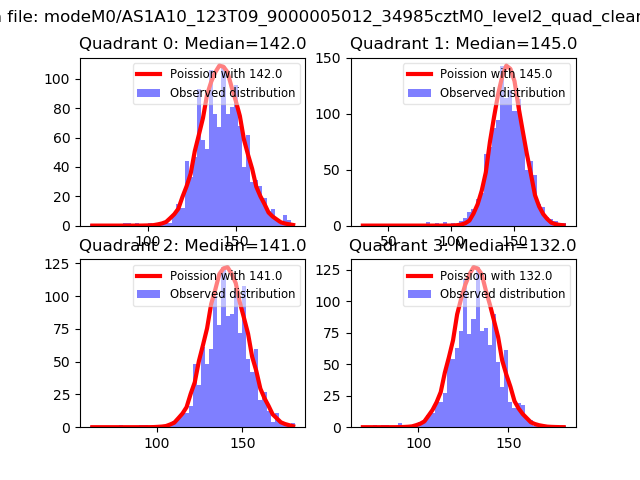
| Comparison with Poisson distribution Blue bars denote a histogram of data divided into 1 sec bins. Red curve is a Poisson curve with rate = median count rate of data. |
 |
 |
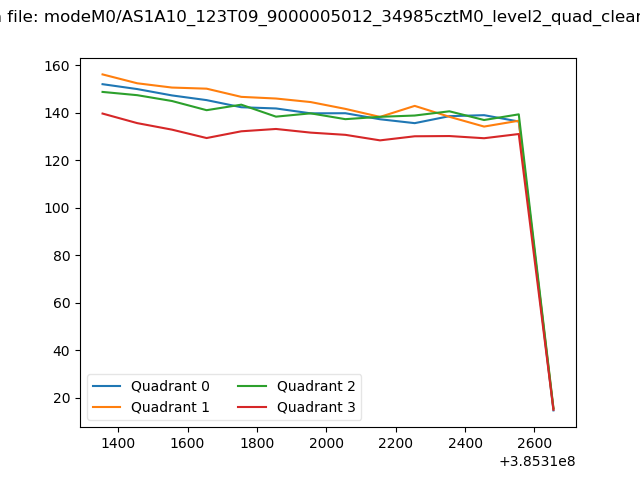
| Quadrant-wise count rates Data is divided into 100 sec bins |
 |
|
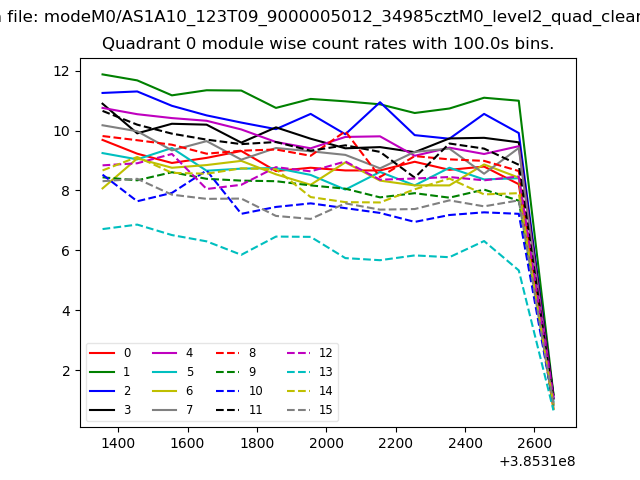
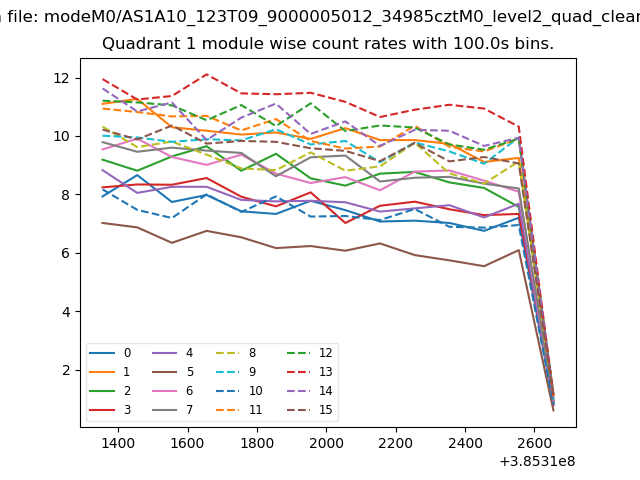
| Module-wise count rates for Quadrant A Data is divided into 100 sec bins |
 |
 |
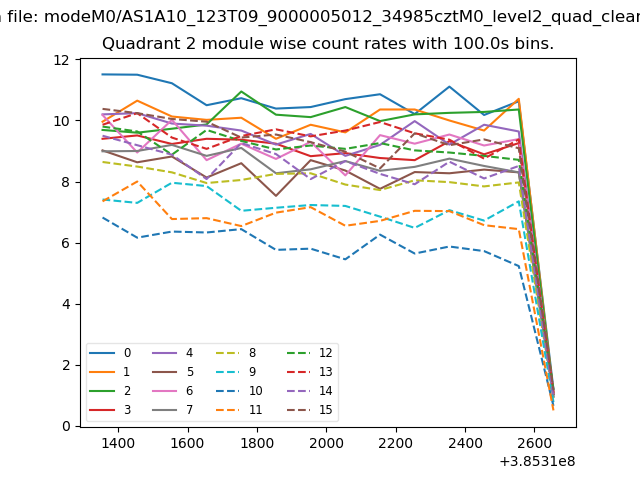
| Module-wise count rates for Quadrant B Data is divided into 100 sec bins |
 |
 |
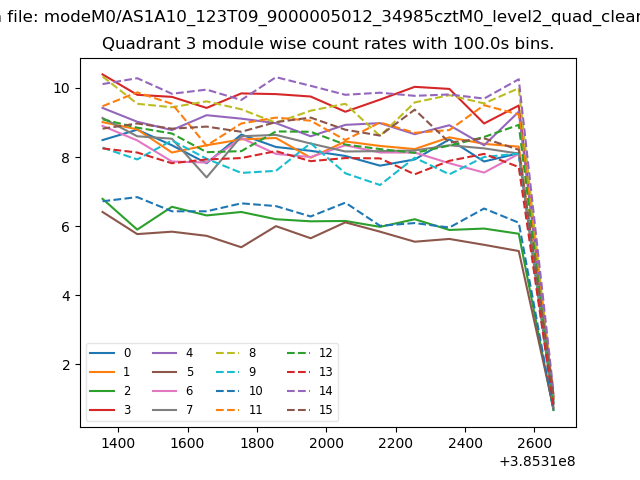
| Module-wise count rates for Quadrant C Data is divided into 100 sec bins |
 |
 |
| Module-wise count rates for Quadrant D Data is divided into 100 sec bins |
 |
 |
| Parameter | Plot |
|---|---|
| CZT HV Monitor | 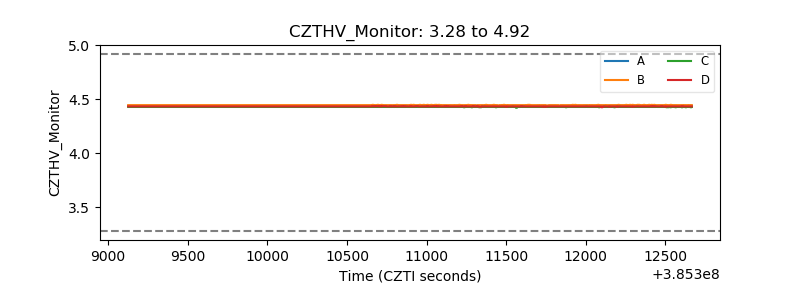 |
| D_VDD | 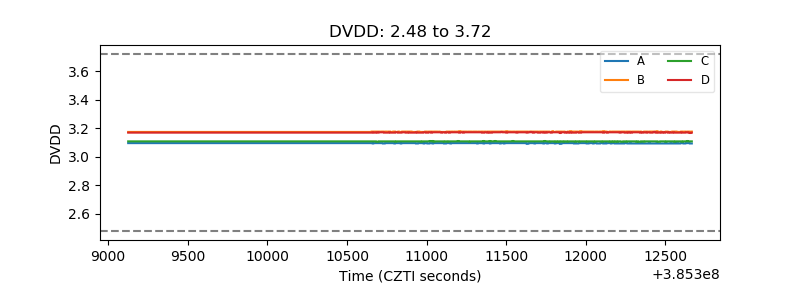 |
| Temperature 1 | 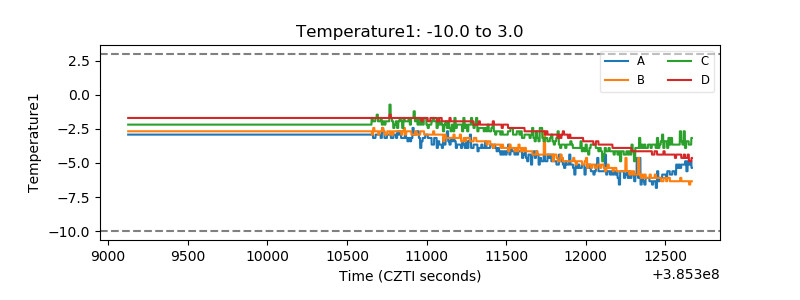 |
| Veto HV Monitor | 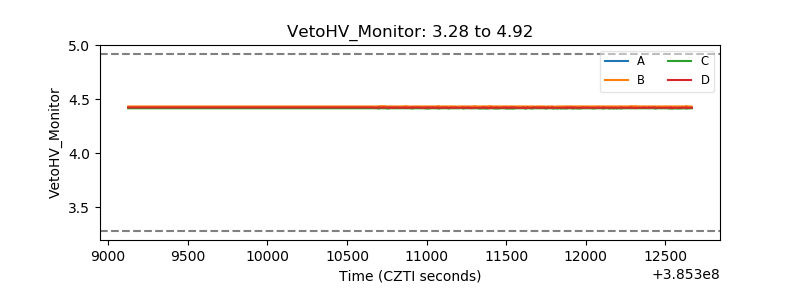 |
| Veto LLD | 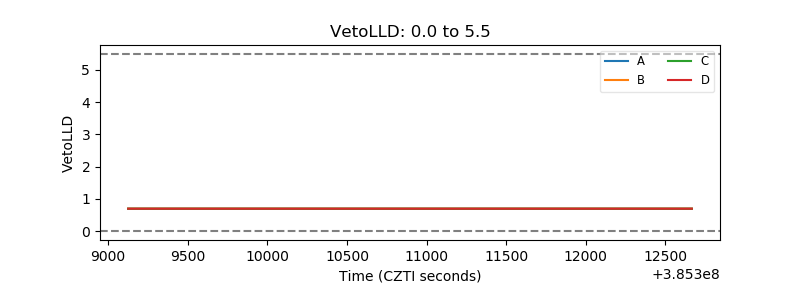 |
| Alpha Counter |  |
| _CPM_Rate | 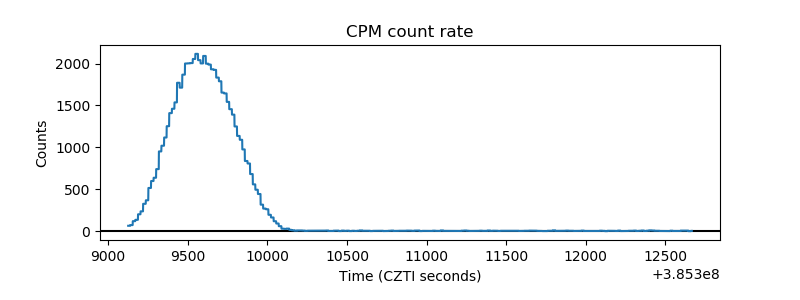 |
| CZT Counter | 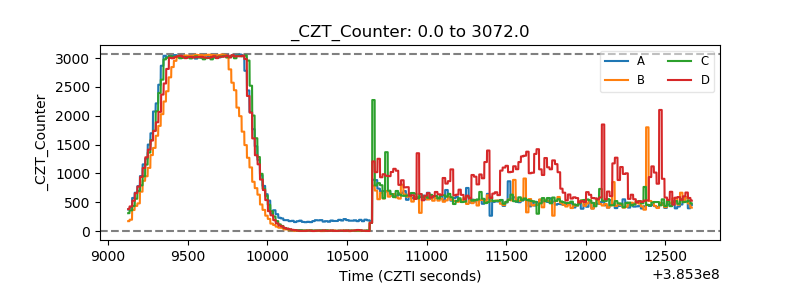 |
| +2.5 Volts monitor | 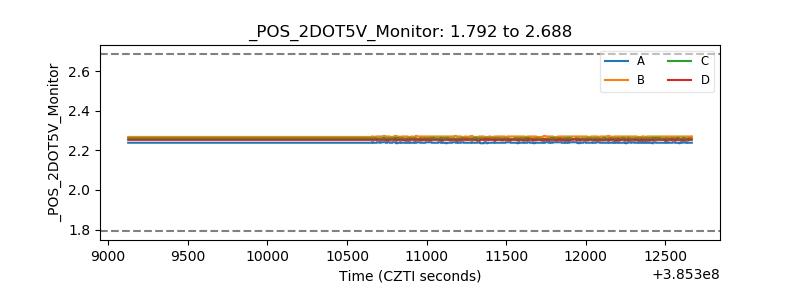 |
| +5 Volts monitor | 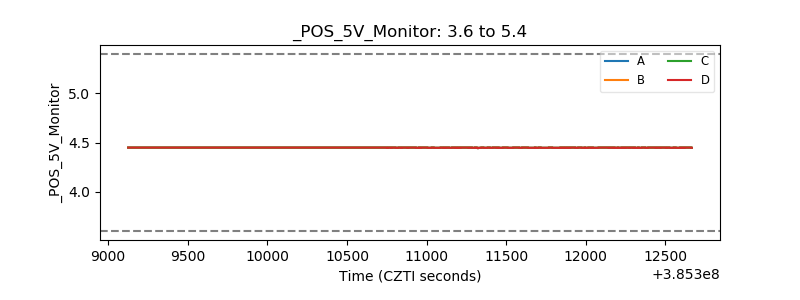 |
| _ROLL_ROT | 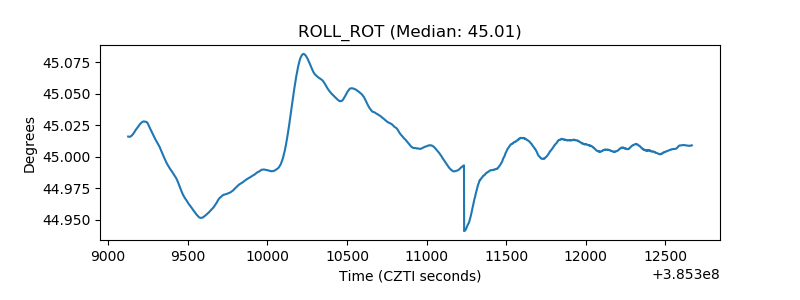 |
| _Roll_DEC | 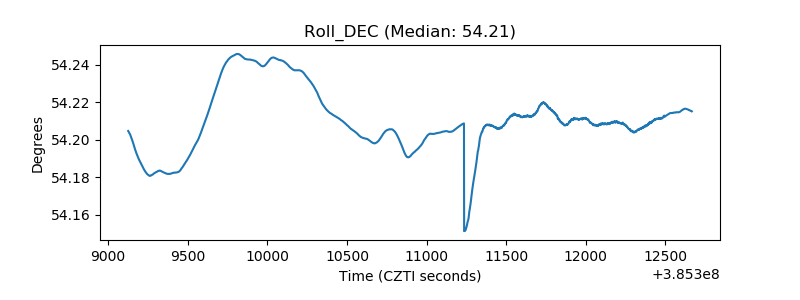 |
| _Roll_RA | 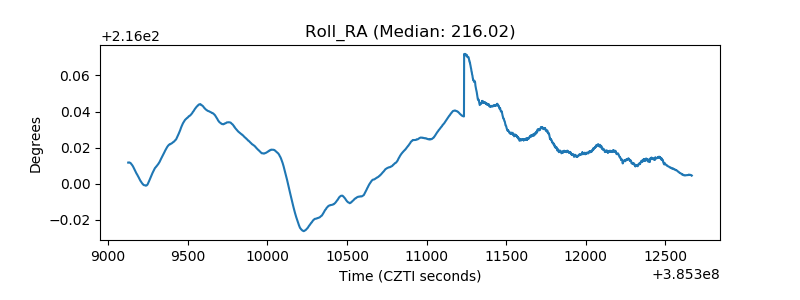 |
| Veto Counter | 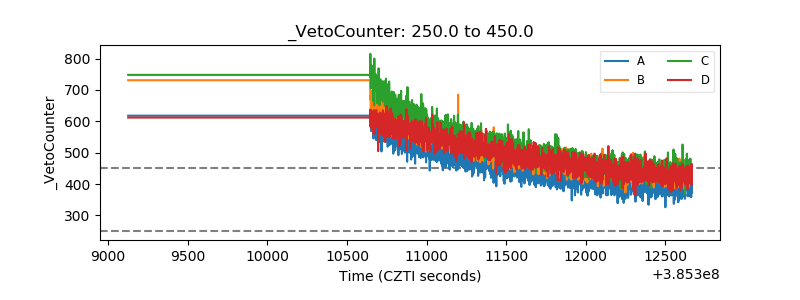 |