| Param | Original file | Final file |
|---|---|---|
| Filename | modeM0/AS1A10_123T09_9000005012_34982cztM0_level2.evt | modeM0/AS1A10_123T09_9000005012_34982cztM0_level2_quad_clean.evt |
| Size (bytes) | 450,066,240 | 62,588,160 |
| Size | 429.2 MB | 59.7 MB |
| Events in quadrant A | 2,696,564 | 381,899 |
| Events in quadrant B | 3,030,933 | 383,043 |
| Events in quadrant C | 2,913,358 | 381,529 |
| Events in quadrant D | 4,608,557 | 356,152 |
| Mode SS | |||
|---|---|---|---|
| Quadrant | BADHDUFLAG | Total packets | Discarded packets |
| A | 0 | 114 | 0 |
| B | 0 | 114 | 0 |
| C | 0 | 114 | 0 |
| D | 0 | 114 | 0 |
| Mode M0 | |||
|---|---|---|---|
| Quadrant | BADHDUFLAG | Total packets | Discarded packets |
| A | 0 | 11703 | 3 |
| B | 0 | 12522 | 2 |
| C | 0 | 11882 | 2 |
| D | 0 | 17577 | 2 |
| Mode M9 | |||
|---|---|---|---|
| Quadrant | BADHDUFLAG | Total packets | Discarded packets |
| A | 0 | 26 | 0 |
| B | 0 | 26 | 0 |
| C | 0 | 26 | 0 |
| D | 0 | 27 | 0 |
| Quadrant | Total seconds | Saturated seconds | Saturation percentage |
|---|---|---|---|
| A | 5609 | 13 | 0.231770% |
| B | 5609 | 89 | 1.586736% |
| C | 5609 | 33 | 0.588340% |
| D | 5609 | 188 | 3.351756% |
Noise dominated data is calculated using 1-second bins in cleaned event files. If a bin has >2000 counts, and if more than 50% of those come from <1% of pixels, then it is considered to be noise-dominated and hence unusable.
| Quadrant | # 1 sec bins | Bins with >0 counts | Bins with >2000 counts | High rate bins dominated by noise | Noise dominated (total time) | Noise dominated (detector-on time) | Marked lightcurve |
|---|---|---|---|---|---|---|---|
| A | 7252 | 5610 | 4 | 4 | 0.06% | 0.07% |  |
| B | 7252 | 5610 | 54 | 54 | 0.74% | 0.96% | 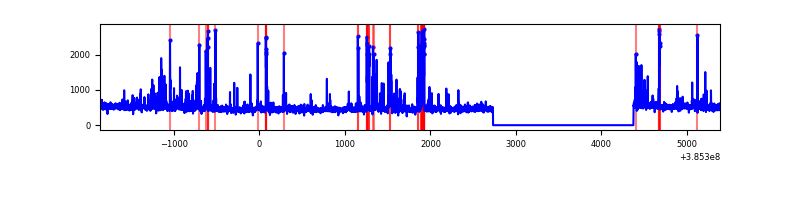 |
| C | 7252 | 5610 | 24 | 24 | 0.33% | 0.43% | 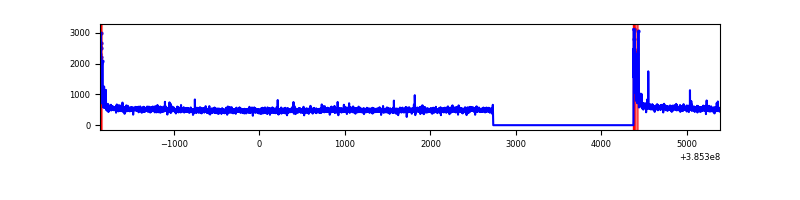 |
| D | 7252 | 5610 | 170 | 170 | 2.34% | 3.03% |  |
Top three noisy pixels from each quadrant. If the there are fewer than three noisy pixels in the level2.evt file, extra rows are filled as -1
| Pixel properties | Quadrant properties | ||||||
|---|---|---|---|---|---|---|---|
| Quadrant | DetID | PixID | Counts | Sigma | Mean | Median | Sigma |
| A | 10 | 83 | 73825 | 545.13 | 665 | 651 | 134.2 |
| A | 15 | 174 | 20936 | 151.12 | 665 | 651 | 134.2 |
| A | 9 | 143 | 16143 | 115.41 | 665 | 651 | 134.2 |
| B | 5 | 172 | 357153 | 2823.21 | 657 | 639 | 126.3 |
| B | 0 | 190 | 35480 | 275.9 | 657 | 639 | 126.3 |
| B | 3 | 112 | 17923 | 136.87 | 657 | 639 | 126.3 |
| C | 15 | 214 | 235345 | 1569.26 | 647 | 652 | 149.6 |
| C | 0 | 10 | 101234 | 672.54 | 647 | 652 | 149.6 |
| C | 14 | 67 | 29264 | 191.31 | 647 | 652 | 149.6 |
| D | 8 | 195 | 1298745 | 8216.41 | 642 | 621 | 158.0 |
| D | 13 | 249 | 375792 | 2374.62 | 642 | 621 | 158.0 |
| D | 2 | 207 | 173091 | 1091.64 | 642 | 621 | 158.0 |
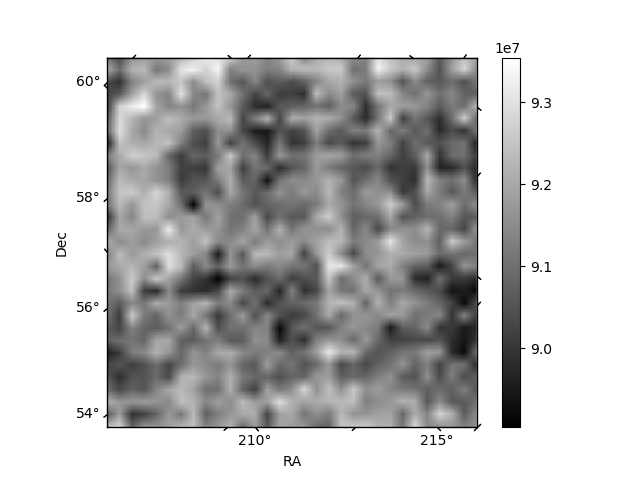
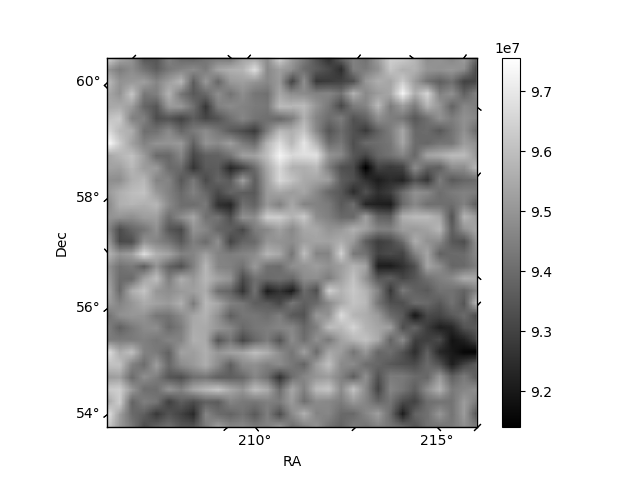
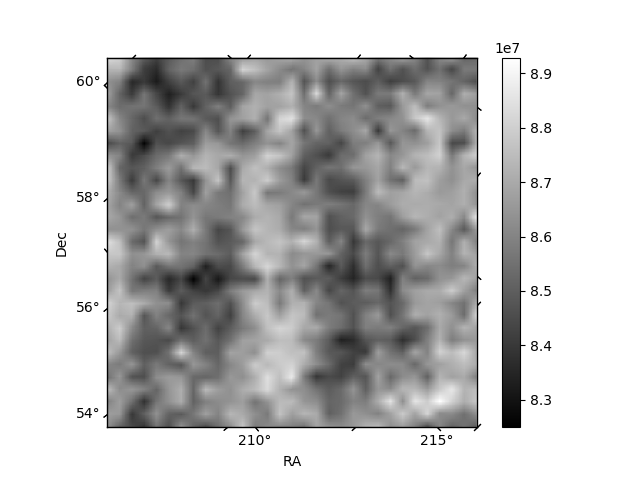
Histogram calculated using DETX and DETY for each event in the final _common_clean file
| Quadrant A | 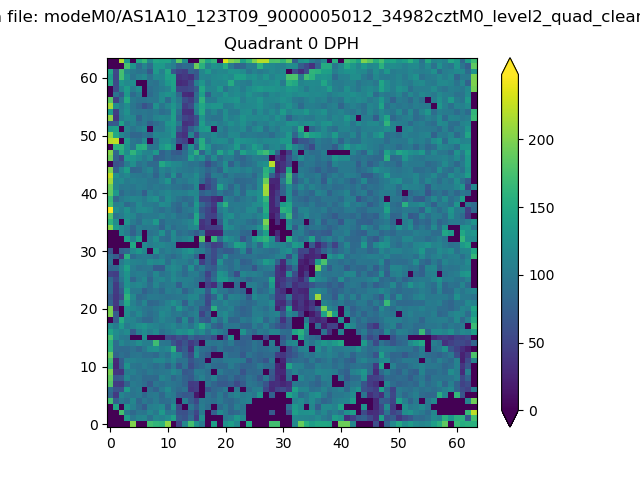 |
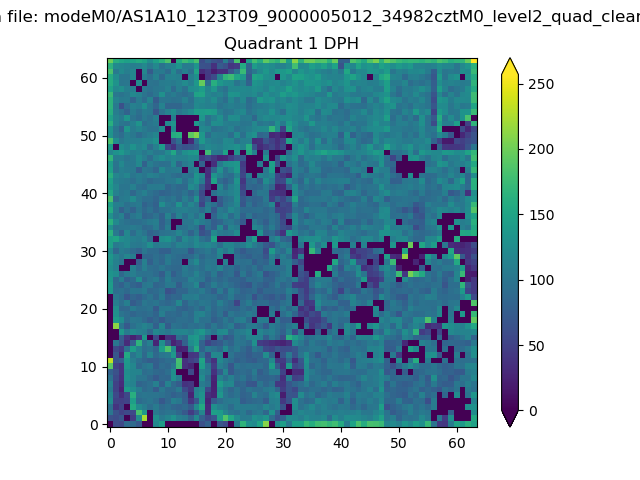 |
Quadrant B |
|---|---|---|---|
| Quadrant D | 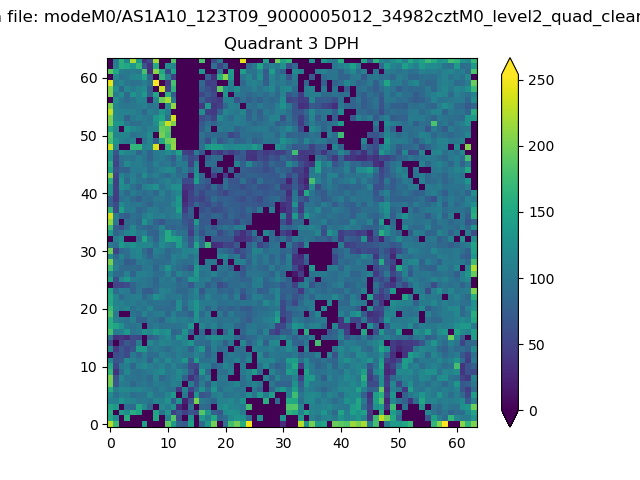 |
 |
Quadrant C |
| Plot type | Count rate plots | Images |
|---|---|---|
| Comparison with Poisson distribution Blue bars denote a histogram of data divided into 1 sec bins. Red curve is a Poisson curve with rate = median count rate of data. |
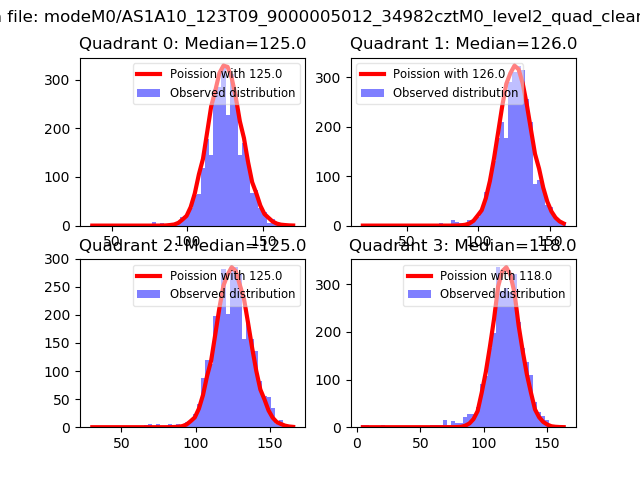 |
 |
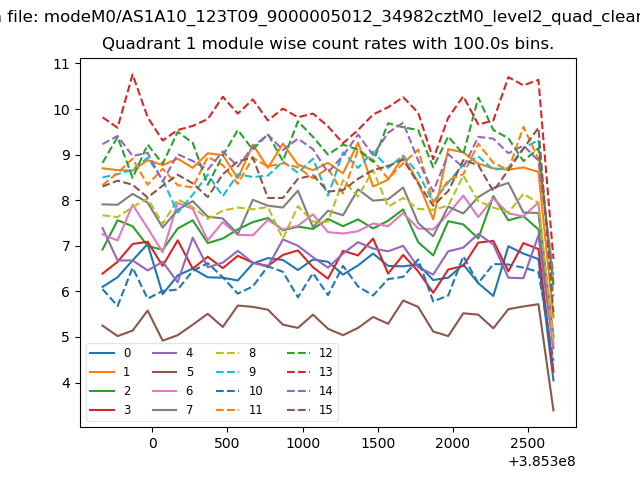
| Quadrant-wise count rates Data is divided into 100 sec bins |
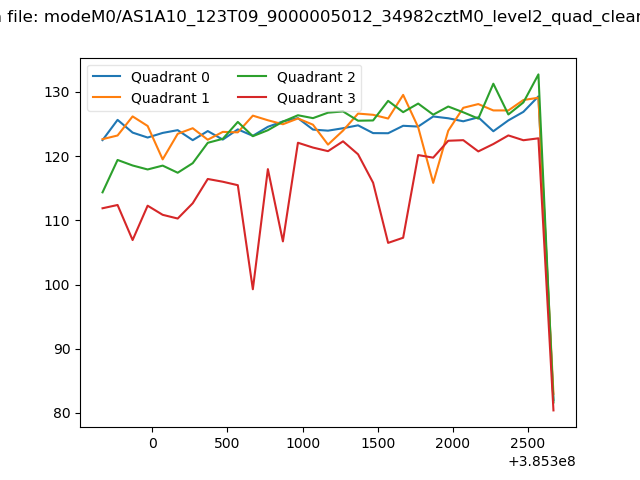 |
|
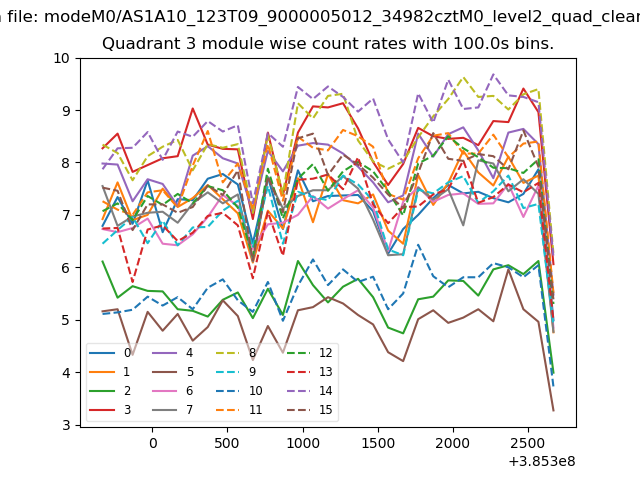
| Module-wise count rates for Quadrant A Data is divided into 100 sec bins |
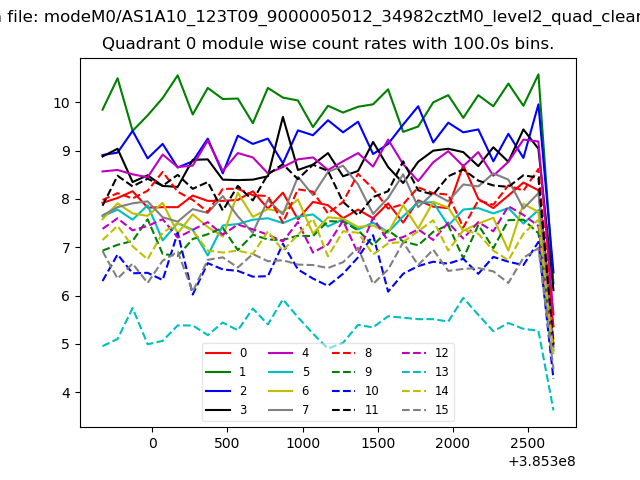 |
 |
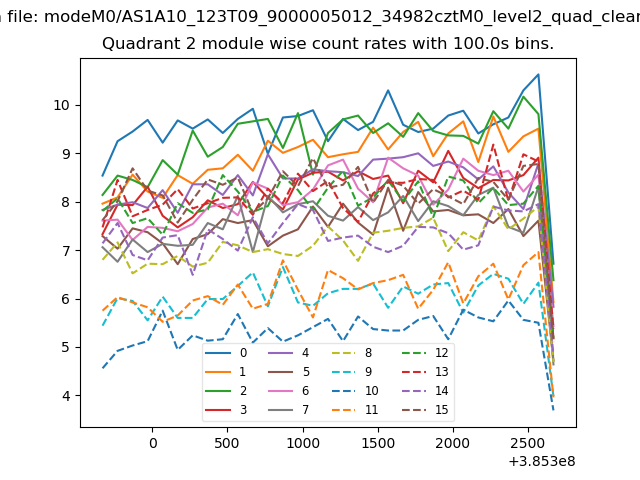
| Module-wise count rates for Quadrant B Data is divided into 100 sec bins |
 |
 |
| Module-wise count rates for Quadrant C Data is divided into 100 sec bins |
 |
 |
| Module-wise count rates for Quadrant D Data is divided into 100 sec bins |
 |
 |
| Parameter | Plot |
|---|---|
| CZT HV Monitor | 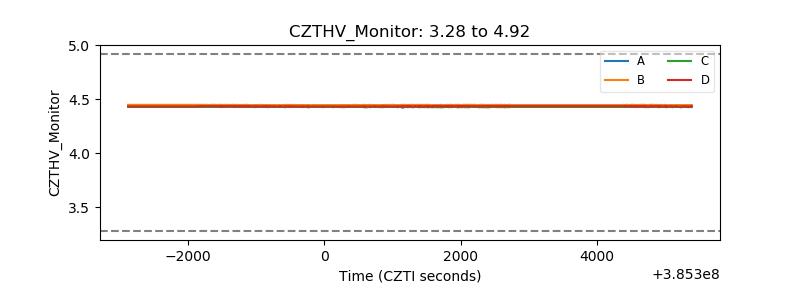 |
| D_VDD | 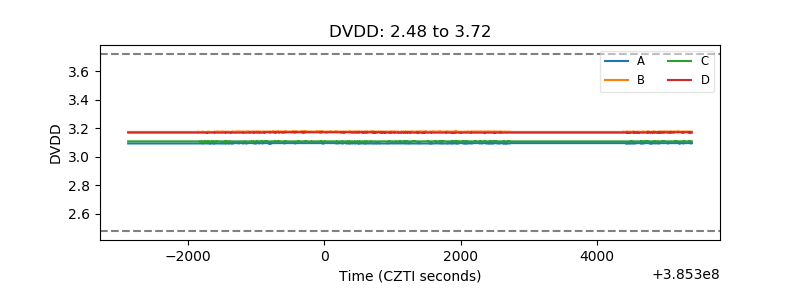 |
| Temperature 1 | 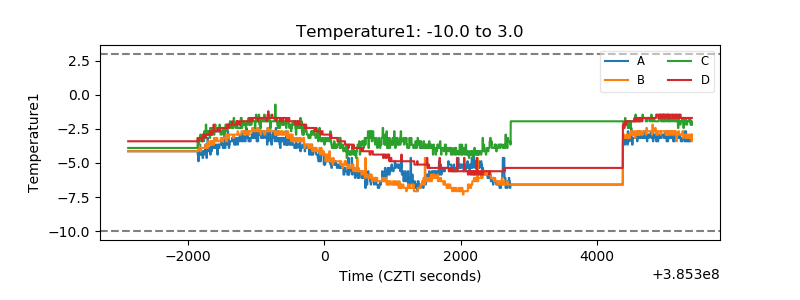 |
| Veto HV Monitor | 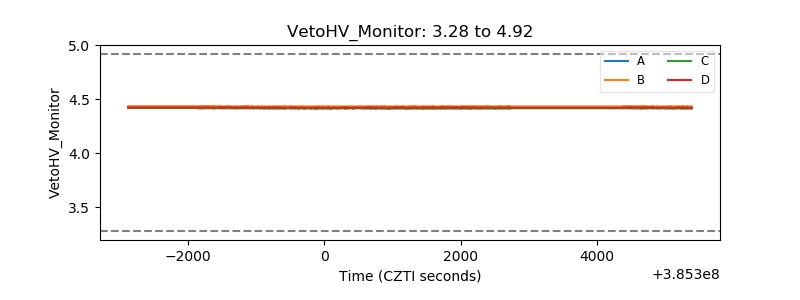 |
| Veto LLD | 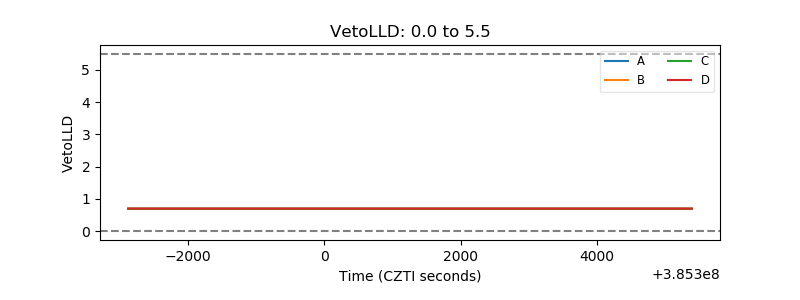 |
| Alpha Counter | 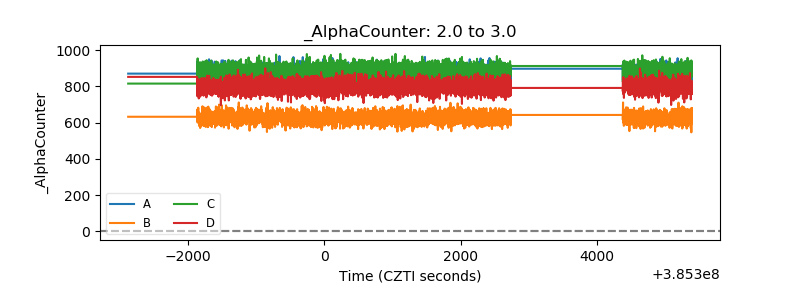 |
| _CPM_Rate | 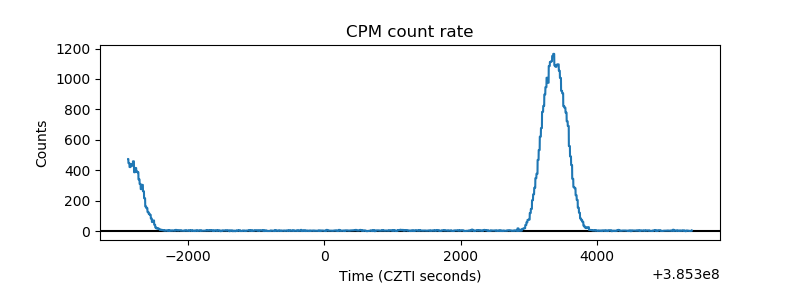 |
| CZT Counter | 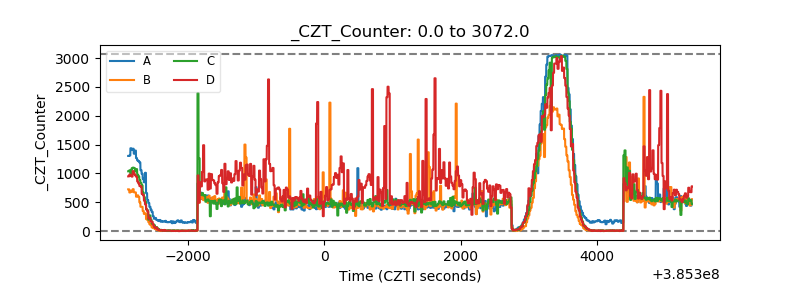 |
| +2.5 Volts monitor |  |
| +5 Volts monitor | 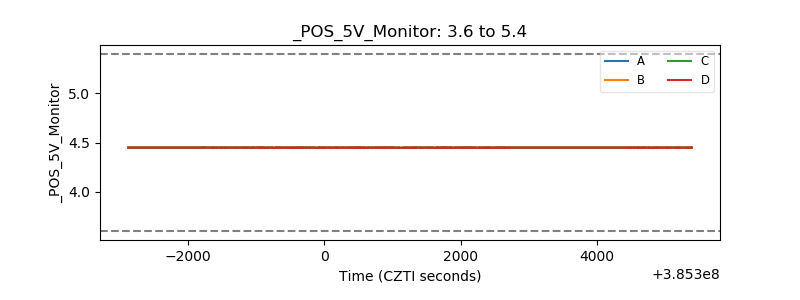 |
| _ROLL_ROT | 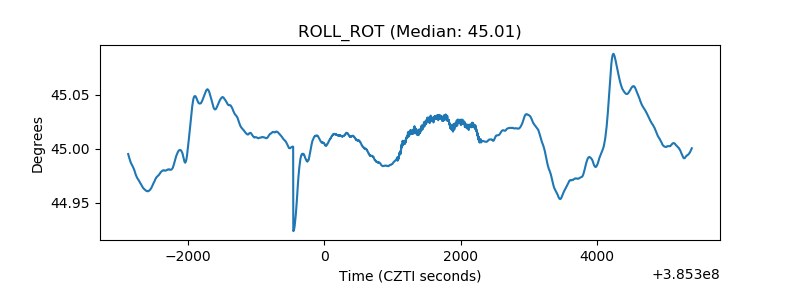 |
| _Roll_DEC | 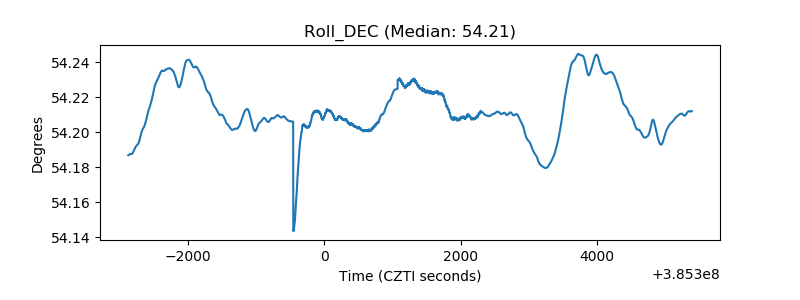 |
| _Roll_RA | 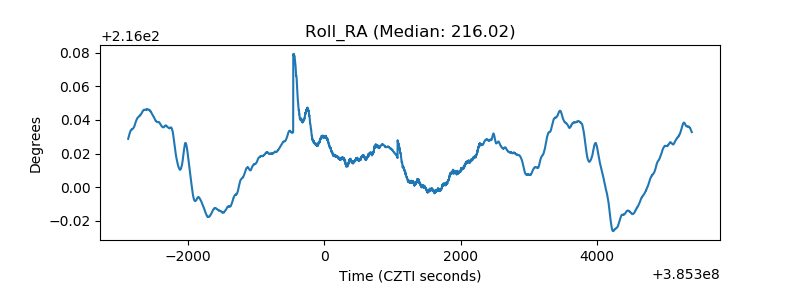 |
| Veto Counter | 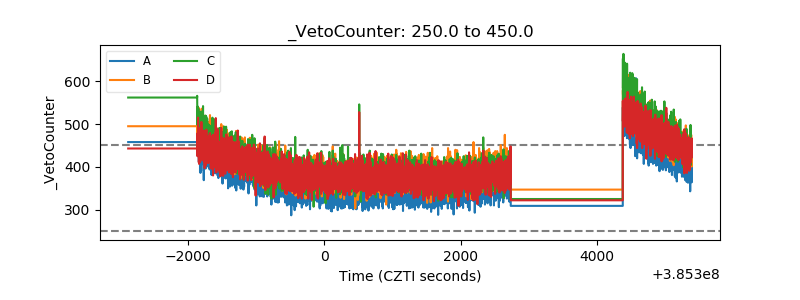 |