| Param | Original file | Final file |
|---|---|---|
| Filename | modeM0/AS1A11_069T01_9000005008_34945cztM0_level2.evt | modeM0/AS1A11_069T01_9000005008_34945cztM0_level2_quad_clean.evt |
| Size (bytes) | 111,372,480 | 14,287,680 |
| Size | 106.2 MB | 13.6 MB |
| Events in quadrant A | 1,364,926 | 60,914 |
| Events in quadrant B | 564,937 | 109,847 |
| Events in quadrant C | 588,290 | 102,532 |
| Events in quadrant D | 799,698 | 97,400 |
| Mode M0 | |||
|---|---|---|---|
| Quadrant | BADHDUFLAG | Total packets | Discarded packets |
| A | 0 | 4544 | 1 |
| B | 0 | 2157 | 1 |
| C | 0 | 2215 | 1 |
| D | 0 | 2903 | 1 |
| Mode SS | |||
|---|---|---|---|
| Quadrant | BADHDUFLAG | Total packets | Discarded packets |
| A | 0 | 16 | 0 |
| B | 0 | 16 | 0 |
| C | 0 | 16 | 0 |
| D | 0 | 16 | 0 |
| Mode M9 | |||
|---|---|---|---|
| Quadrant | BADHDUFLAG | Total packets | Discarded packets |
| A | 0 | 4 | 0 |
| B | 0 | 4 | 0 |
| C | 0 | 4 | 0 |
| D | 0 | 5 | 0 |
| Quadrant | Total seconds | Saturated seconds | Saturation percentage |
|---|---|---|---|
| A | 768 | 476 | 61.979167% |
| B | 768 | 48 | 6.250000% |
| C | 768 | 60 | 7.812500% |
| D | 768 | 73 | 9.505208% |
Noise dominated data is calculated using 1-second bins in cleaned event files. If a bin has >2000 counts, and if more than 50% of those come from <1% of pixels, then it is considered to be noise-dominated and hence unusable.
| Quadrant | # 1 sec bins | Bins with >0 counts | Bins with >2000 counts | High rate bins dominated by noise | Noise dominated (total time) | Noise dominated (detector-on time) | Marked lightcurve |
|---|---|---|---|---|---|---|---|
| A | 767 | 767 | 470 | 470 | 61.28% | 61.28% | 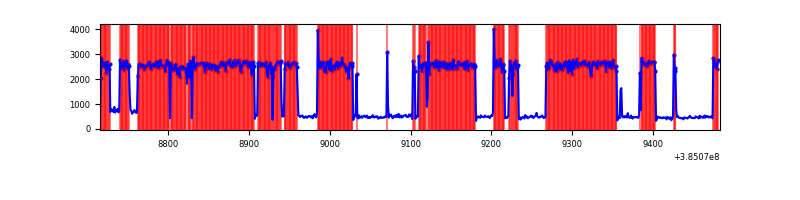 |
| B | 768 | 768 | 35 | 35 | 4.56% | 4.56% | 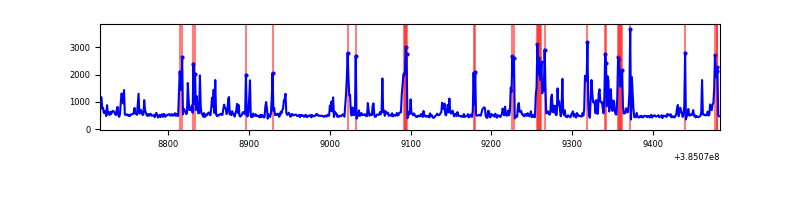 |
| C | 768 | 768 | 46 | 46 | 5.99% | 5.99% | 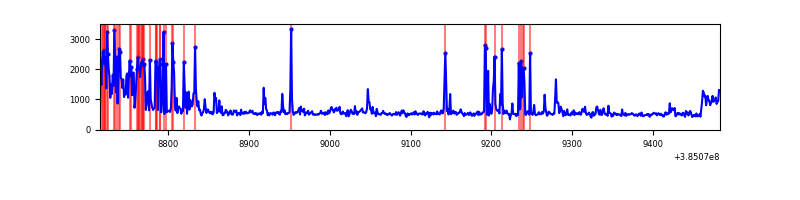 |
| D | 768 | 768 | 71 | 71 | 9.24% | 9.24% | 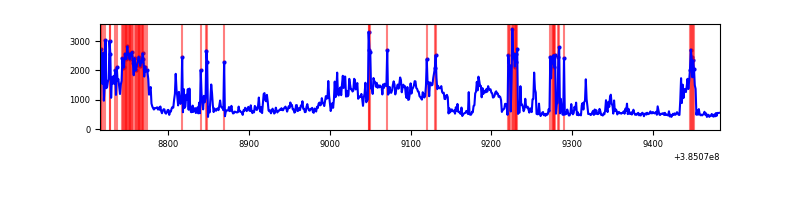 |
Top three noisy pixels from each quadrant. If the there are fewer than three noisy pixels in the level2.evt file, extra rows are filled as -1
| Pixel properties | Quadrant properties | ||||||
|---|---|---|---|---|---|---|---|
| Quadrant | DetID | PixID | Counts | Sigma | Mean | Median | Sigma |
| A | 15 | 169 | 1130757 | 87542.58 | 55 | 54 | 12.9 |
| A | 10 | 83 | 14870 | 1147.1 | 55 | 54 | 12.9 |
| A | 13 | 6 | 2490 | 188.6 | 55 | 54 | 12.9 |
| B | 5 | 172 | 183656 | 9520.88 | 91 | 89 | 19.3 |
| B | 4 | 232 | 7970 | 408.76 | 91 | 89 | 19.3 |
| B | 0 | 190 | 5645 | 288.17 | 91 | 89 | 19.3 |
| C | 0 | 10 | 194552 | 8728.02 | 87 | 88 | 22.3 |
| C | 15 | 214 | 34634 | 1550.51 | 87 | 88 | 22.3 |
| C | 12 | 250 | 15587 | 695.63 | 87 | 88 | 22.3 |
| D | 13 | 249 | 99212 | 4168.61 | 87 | 85 | 23.8 |
| D | 8 | 195 | 99097 | 4163.77 | 87 | 85 | 23.8 |
| D | 2 | 31 | 90609 | 3806.82 | 87 | 85 | 23.8 |
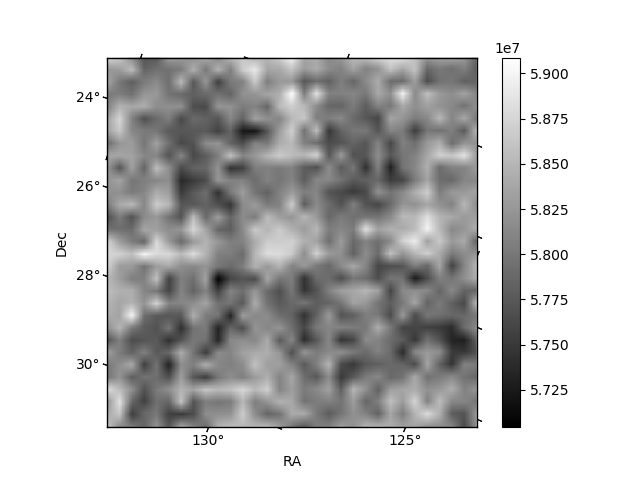
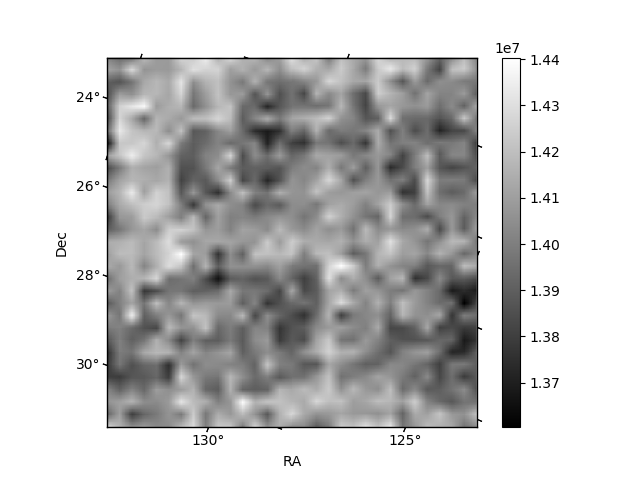
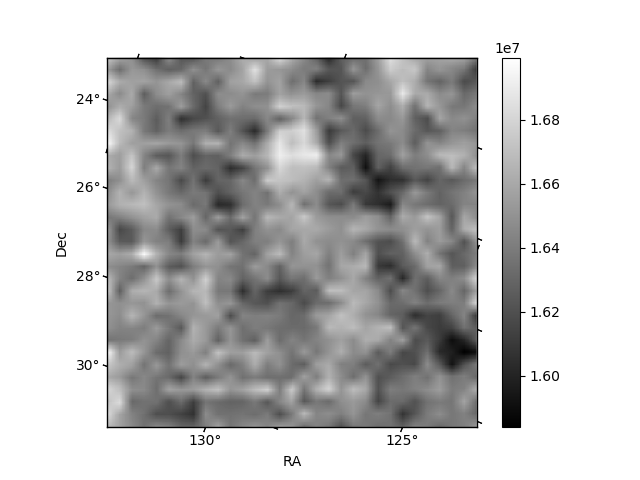
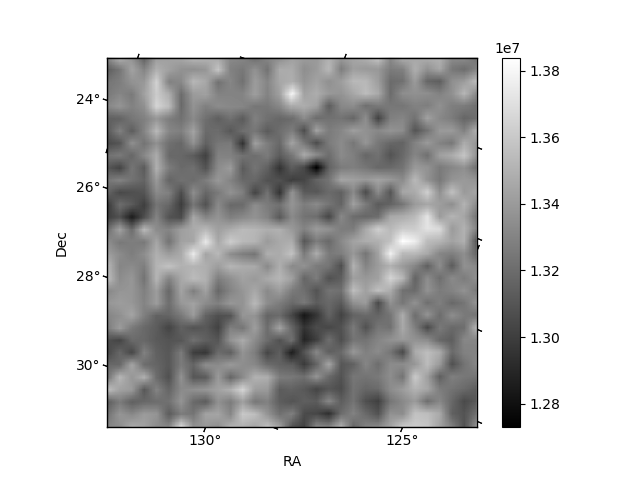
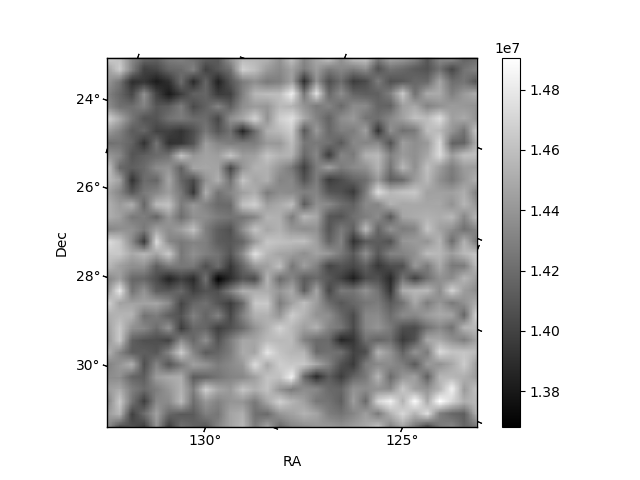
Histogram calculated using DETX and DETY for each event in the final _common_clean file
| Quadrant A | 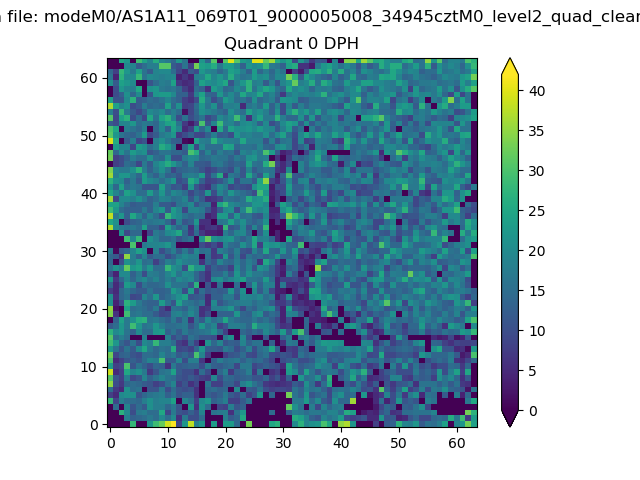 |
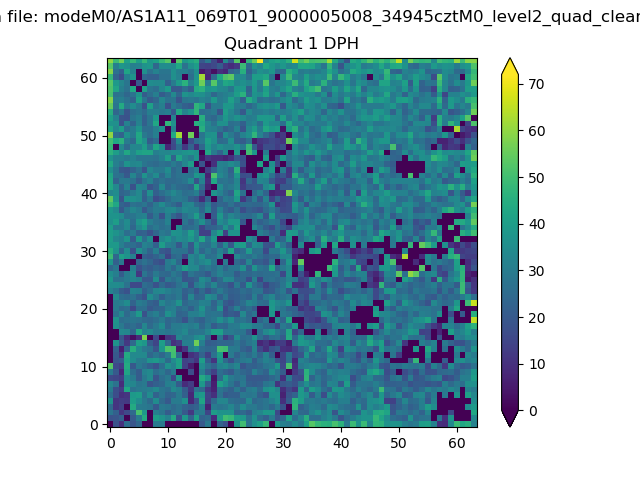 |
Quadrant B |
|---|---|---|---|
| Quadrant D | 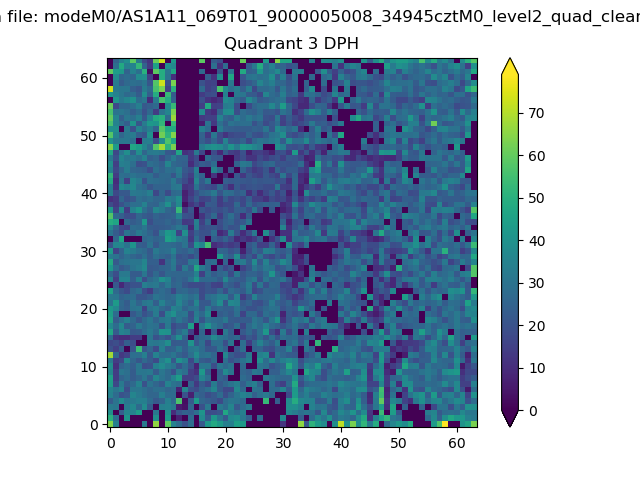 |
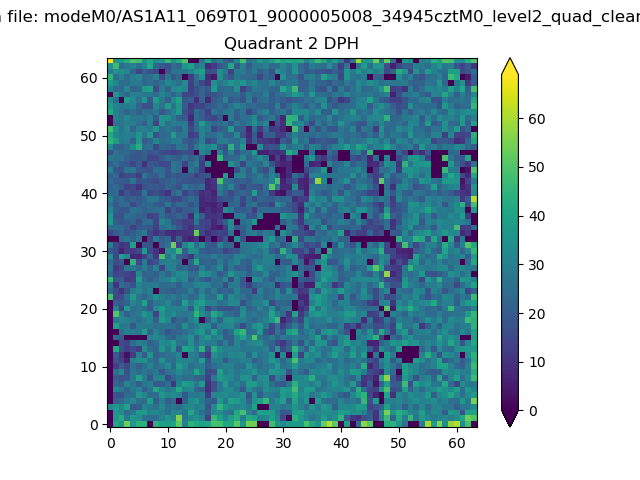 |
Quadrant C |
| Plot type | Count rate plots | Images |
|---|---|---|
| Comparison with Poisson distribution Blue bars denote a histogram of data divided into 1 sec bins. Red curve is a Poisson curve with rate = median count rate of data. |
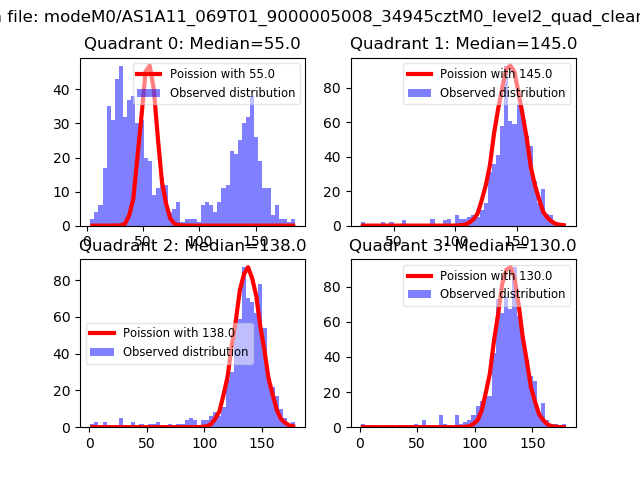 |
 |
| Quadrant-wise count rates Data is divided into 100 sec bins |
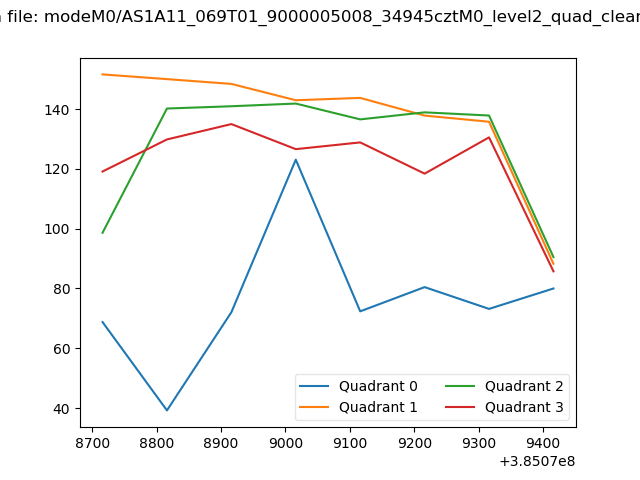 |
|
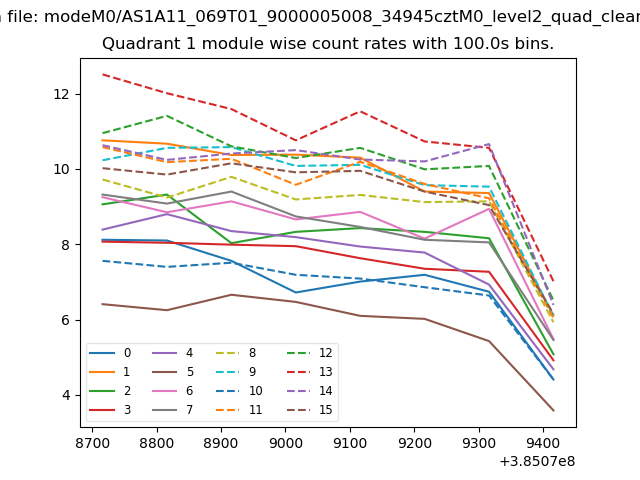
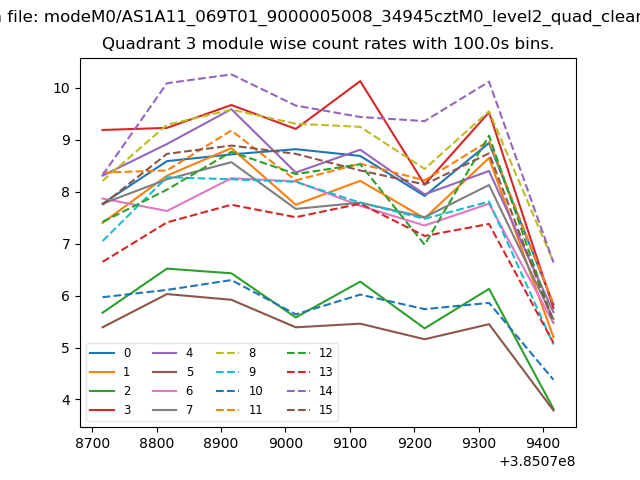
| Module-wise count rates for Quadrant A Data is divided into 100 sec bins |
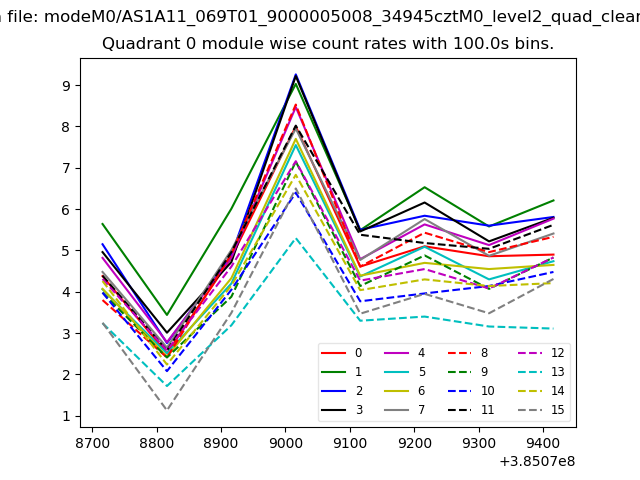 |
 |
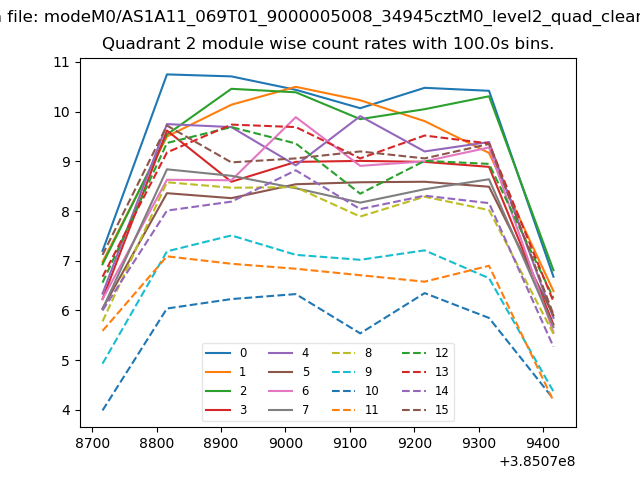
| Module-wise count rates for Quadrant B Data is divided into 100 sec bins |
 |
 |
| Module-wise count rates for Quadrant C Data is divided into 100 sec bins |
 |
 |
| Module-wise count rates for Quadrant D Data is divided into 100 sec bins |
 |
 |
| Parameter | Plot |
|---|---|
| CZT HV Monitor | 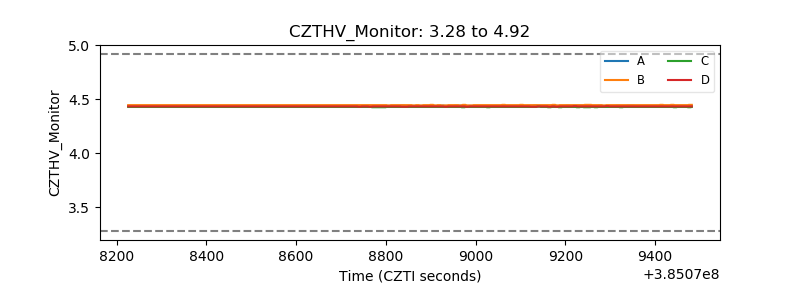 |
| D_VDD | 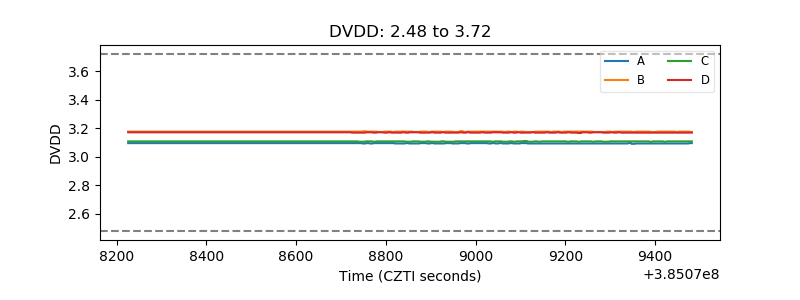 |
| Temperature 1 | 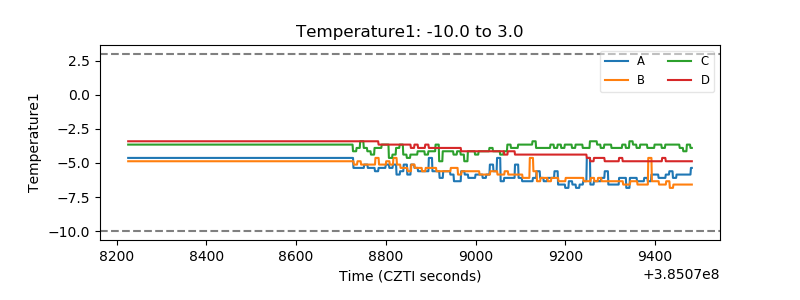 |
| Veto HV Monitor | 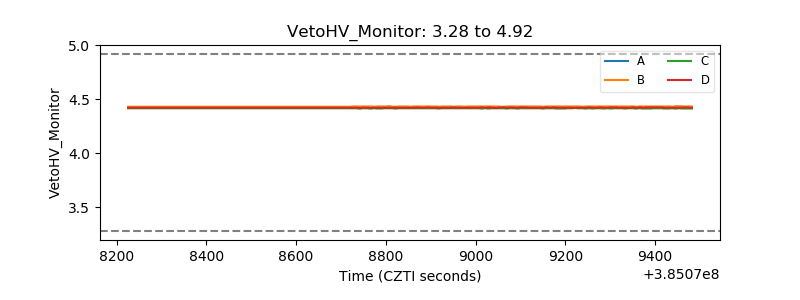 |
| Veto LLD | 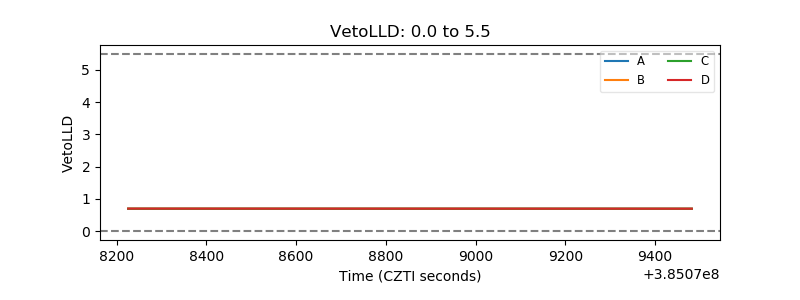 |
| Alpha Counter | 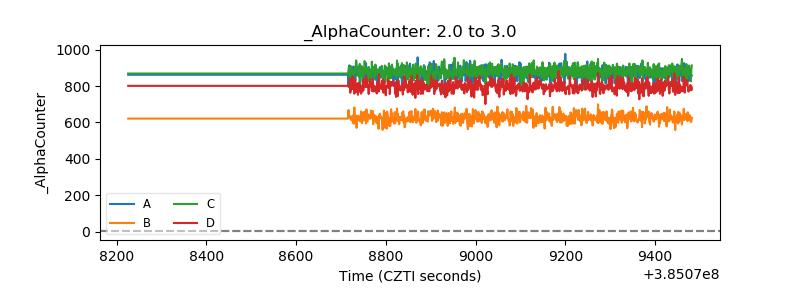 |
| _CPM_Rate | 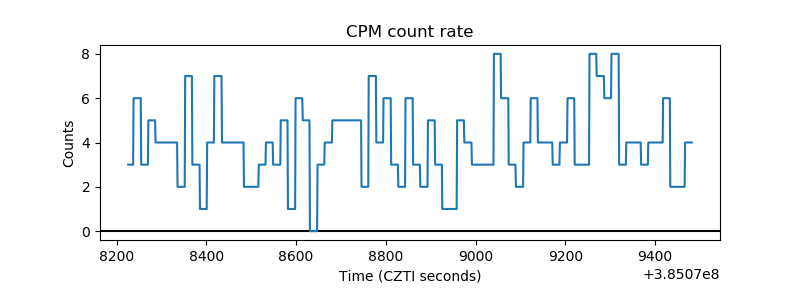 |
| CZT Counter | 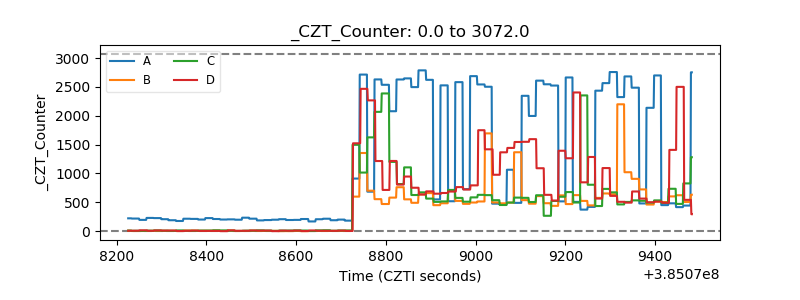 |
| +2.5 Volts monitor | 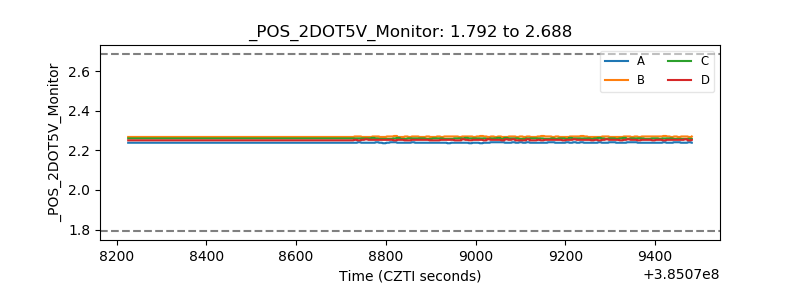 |
| +5 Volts monitor | 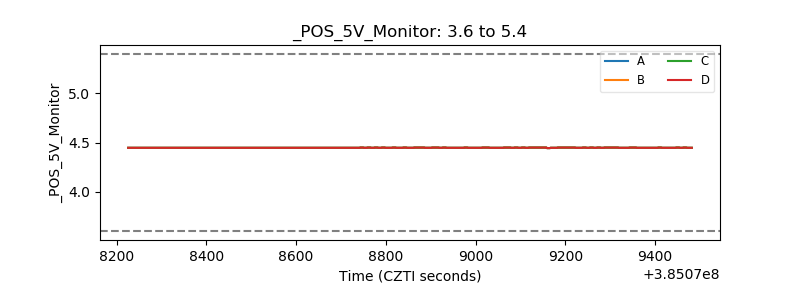 |
| _ROLL_ROT | 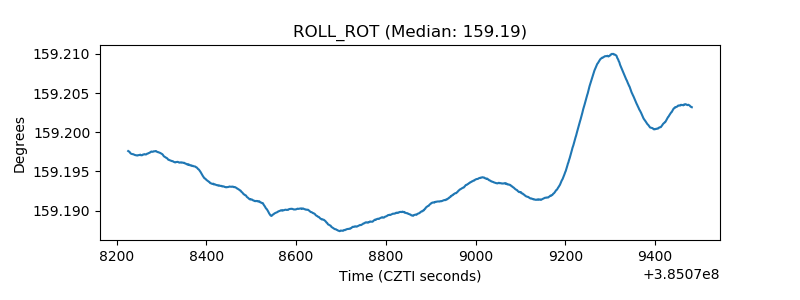 |
| _Roll_DEC | 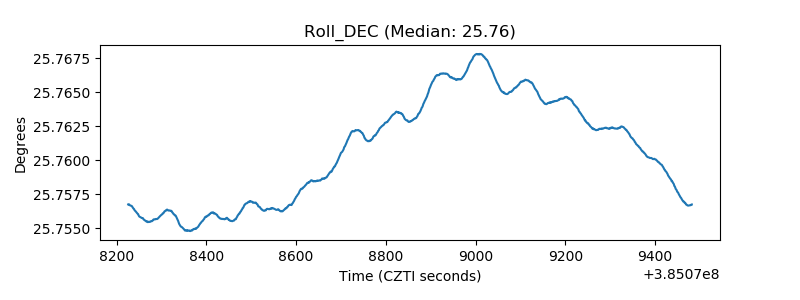 |
| _Roll_RA | 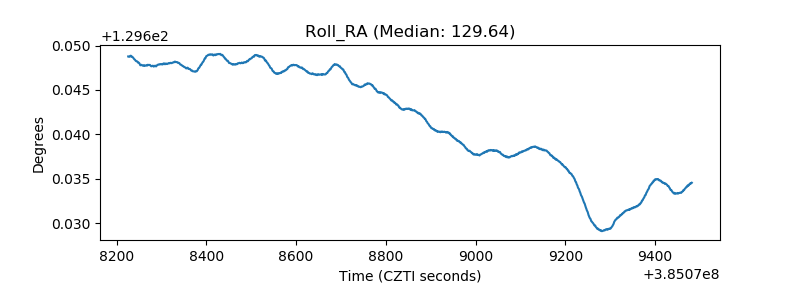 |
| Veto Counter | 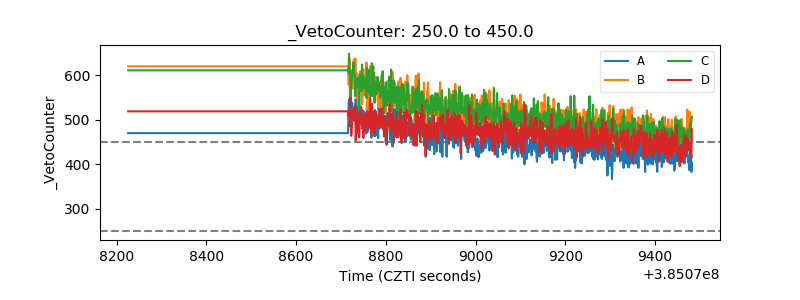 |