| Param | Original file | Final file |
|---|---|---|
| Filename | modeM0/AS1A11_069T01_9000005008_34944cztM0_level2.evt | modeM0/AS1A11_069T01_9000005008_34944cztM0_level2_quad_clean.evt |
| Size (bytes) | 683,974,080 | 52,505,280 |
| Size | 652.3 MB | 50.1 MB |
| Events in quadrant A | 9,740,578 | 170,446 |
| Events in quadrant B | 3,214,189 | 376,940 |
| Events in quadrant C | 2,870,275 | 369,812 |
| Events in quadrant D | 4,558,791 | 328,251 |
| Mode M0 | |||
|---|---|---|---|
| Quadrant | BADHDUFLAG | Total packets | Discarded packets |
| A | 0 | 32062 | 2 |
| B | 0 | 12606 | 2 |
| C | 0 | 11322 | 2 |
| D | 0 | 16884 | 2 |
| Mode SS | |||
|---|---|---|---|
| Quadrant | BADHDUFLAG | Total packets | Discarded packets |
| A | 0 | 100 | 0 |
| B | 0 | 100 | 0 |
| C | 0 | 100 | 0 |
| D | 0 | 100 | 0 |
| Mode M9 | |||
|---|---|---|---|
| Quadrant | BADHDUFLAG | Total packets | Discarded packets |
| A | 0 | 35 | 0 |
| B | 0 | 35 | 0 |
| C | 0 | 35 | 0 |
| D | 0 | 36 | 0 |
| Quadrant | Total seconds | Saturated seconds | Saturation percentage |
|---|---|---|---|
| A | 4884 | 3577 | 73.239148% |
| B | 4884 | 256 | 5.241605% |
| C | 4884 | 121 | 2.477477% |
| D | 4884 | 443 | 9.070434% |
Noise dominated data is calculated using 1-second bins in cleaned event files. If a bin has >2000 counts, and if more than 50% of those come from <1% of pixels, then it is considered to be noise-dominated and hence unusable.
| Quadrant | # 1 sec bins | Bins with >0 counts | Bins with >2000 counts | High rate bins dominated by noise | Noise dominated (total time) | Noise dominated (detector-on time) | Marked lightcurve |
|---|---|---|---|---|---|---|---|
| A | 7037 | 4884 | 3503 | 3503 | 49.78% | 71.72% | 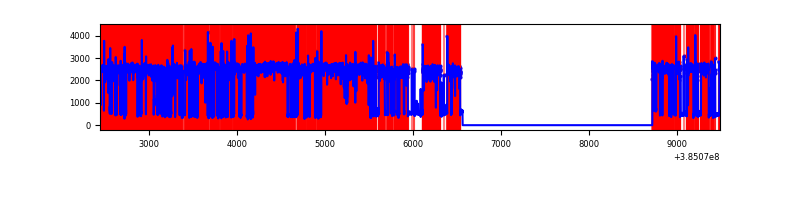 |
| B | 7038 | 4885 | 230 | 230 | 3.27% | 4.71% | 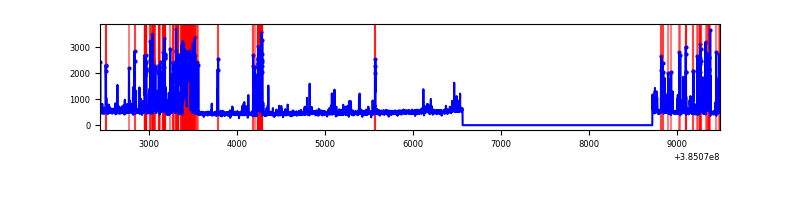 |
| C | 7038 | 4885 | 102 | 102 | 1.45% | 2.09% | 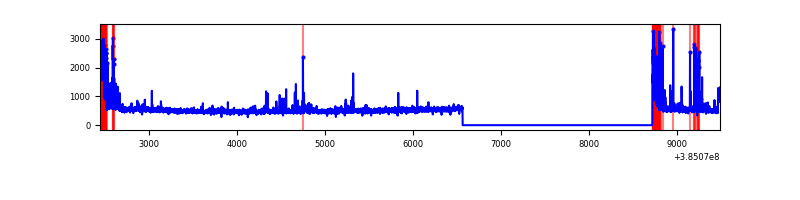 |
| D | 7038 | 4885 | 450 | 450 | 6.39% | 9.21% | 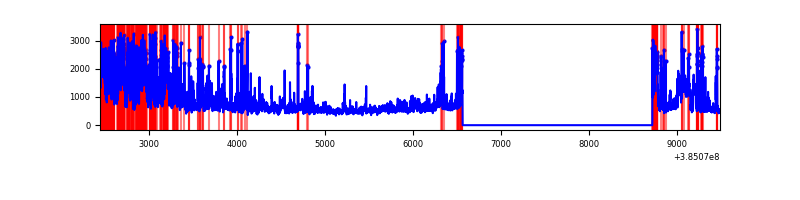 |
Top three noisy pixels from each quadrant. If the there are fewer than three noisy pixels in the level2.evt file, extra rows are filled as -1
| Pixel properties | Quadrant properties | ||||||
|---|---|---|---|---|---|---|---|
| Quadrant | DetID | PixID | Counts | Sigma | Mean | Median | Sigma |
| A | 15 | 169 | 8564425 | 142490.06 | 291 | 285 | 60.1 |
| A | 10 | 83 | 32640 | 538.32 | 291 | 285 | 60.1 |
| A | 7 | 16 | 7036 | 112.32 | 291 | 285 | 60.1 |
| B | 5 | 172 | 774675 | 7113.03 | 576 | 562 | 108.8 |
| B | 0 | 190 | 105266 | 962.09 | 576 | 562 | 108.8 |
| B | 4 | 232 | 25764 | 231.57 | 576 | 562 | 108.8 |
| C | 0 | 10 | 418203 | 3169.87 | 568 | 572 | 131.7 |
| C | 15 | 214 | 203683 | 1541.64 | 568 | 572 | 131.7 |
| C | 12 | 250 | 18804 | 138.38 | 568 | 572 | 131.7 |
| D | 8 | 195 | 638918 | 4732.64 | 550 | 536 | 134.9 |
| D | 1 | 47 | 574641 | 4256.12 | 550 | 536 | 134.9 |
| D | 13 | 249 | 250810 | 1855.4 | 550 | 536 | 134.9 |
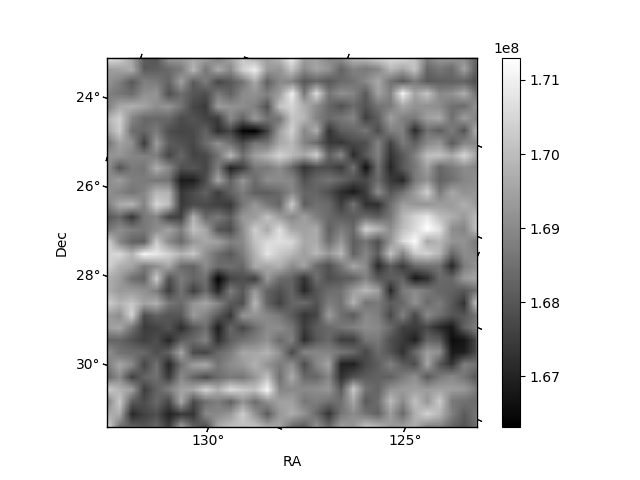
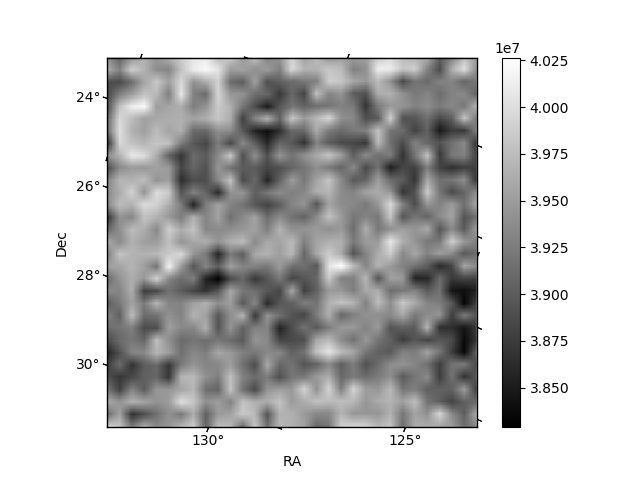
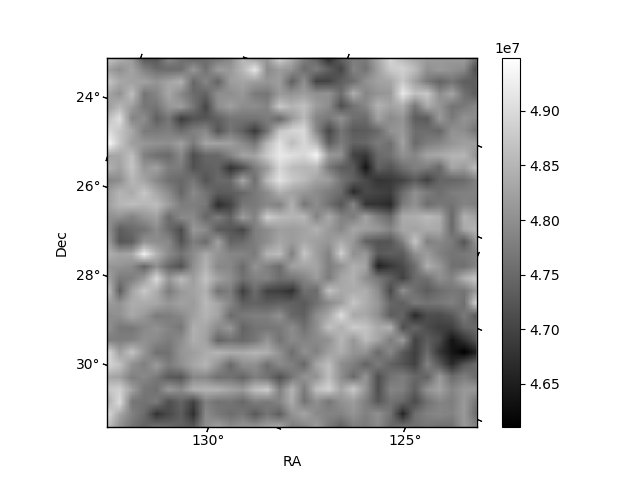
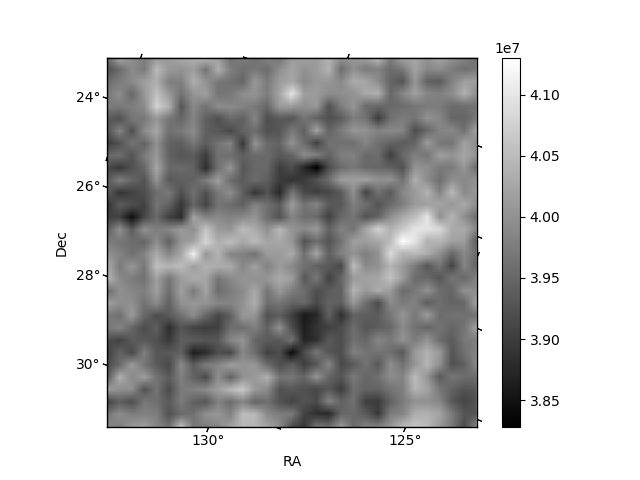
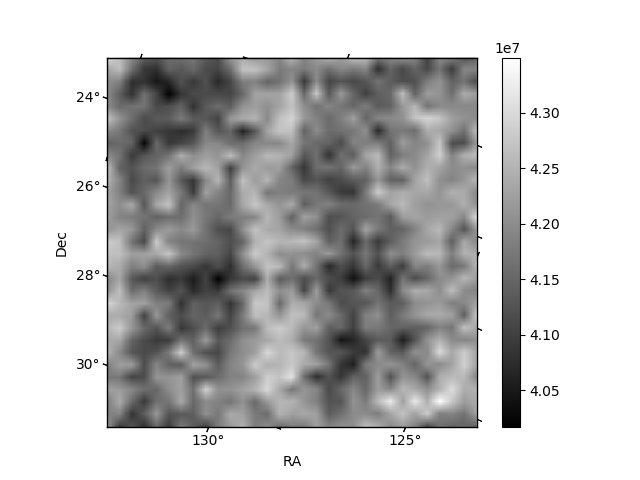
Histogram calculated using DETX and DETY for each event in the final _common_clean file
| Quadrant A | 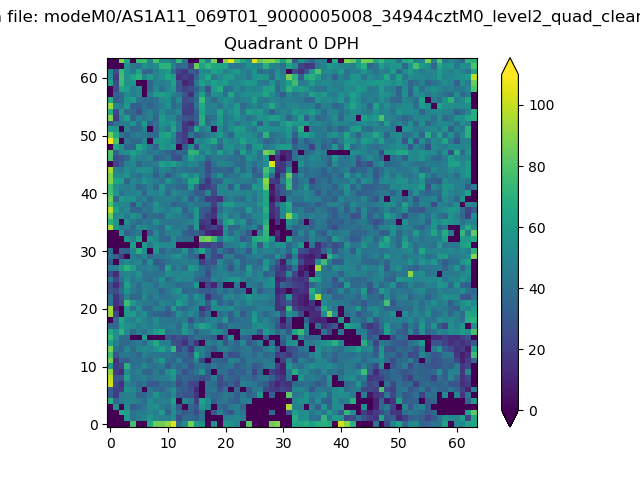 |
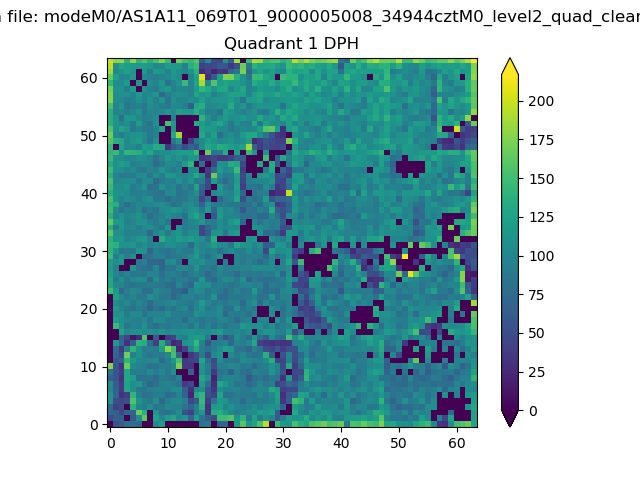 |
Quadrant B |
|---|---|---|---|
| Quadrant D | 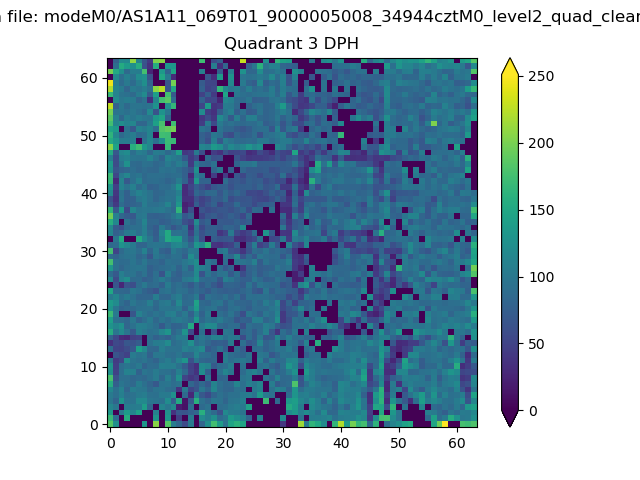 |
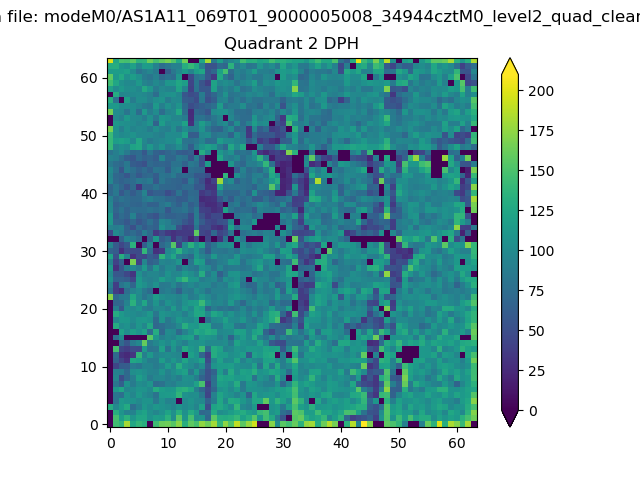 |
Quadrant C |
| Plot type | Count rate plots | Images |
|---|---|---|
| Comparison with Poisson distribution Blue bars denote a histogram of data divided into 1 sec bins. Red curve is a Poisson curve with rate = median count rate of data. |
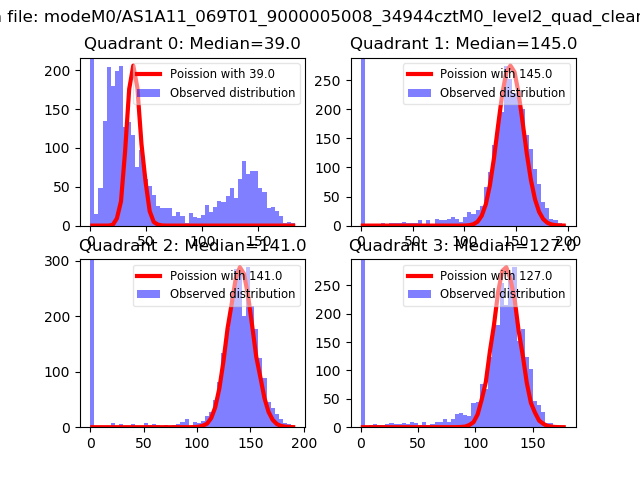 |
 |
| Quadrant-wise count rates Data is divided into 100 sec bins |
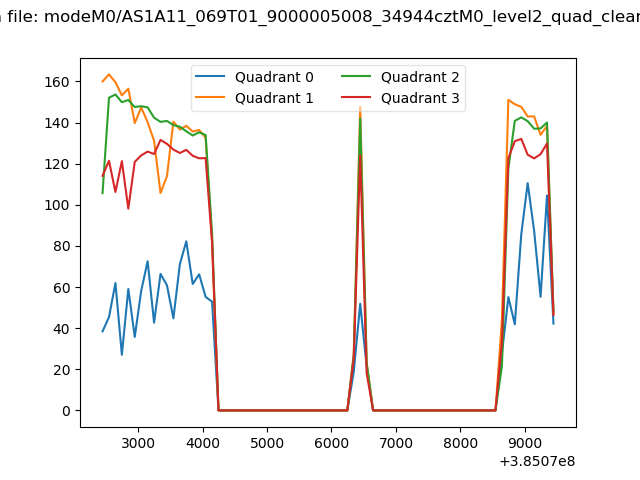 |
|
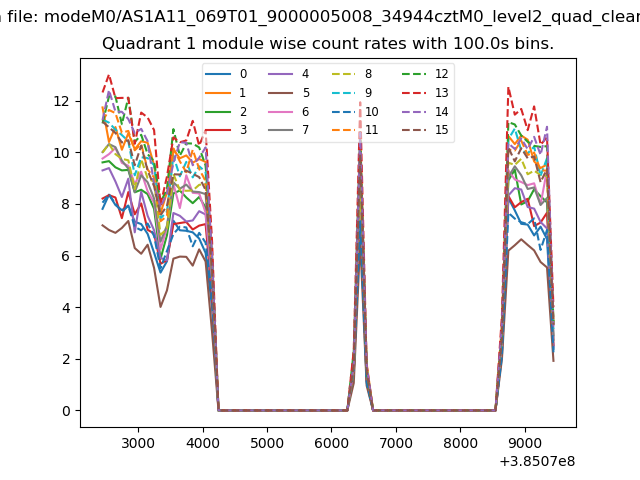
| Module-wise count rates for Quadrant A Data is divided into 100 sec bins |
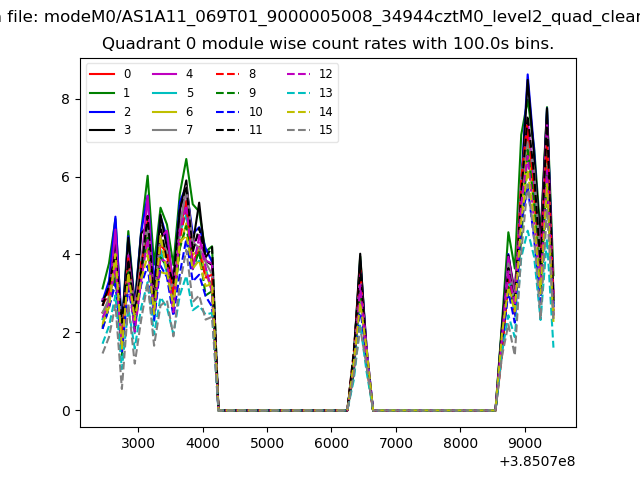 |
 |
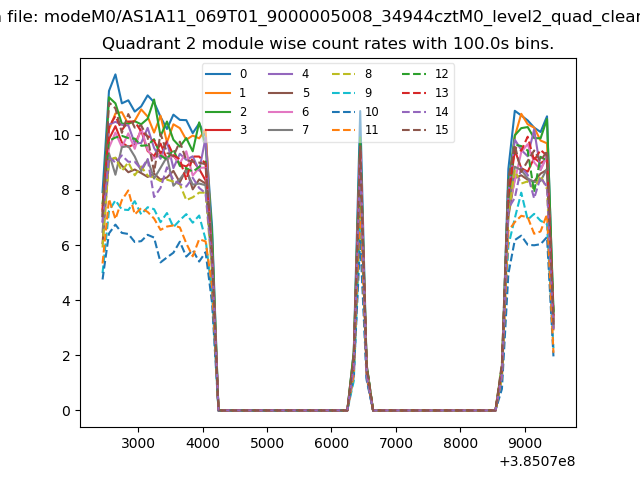
| Module-wise count rates for Quadrant B Data is divided into 100 sec bins |
 |
 |
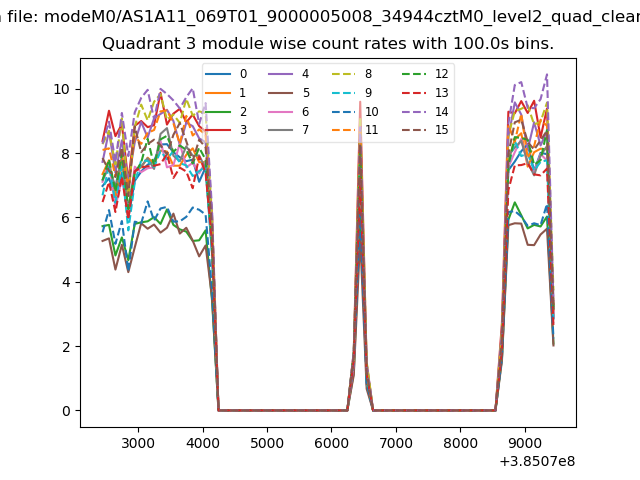
| Module-wise count rates for Quadrant C Data is divided into 100 sec bins |
 |
 |
| Module-wise count rates for Quadrant D Data is divided into 100 sec bins |
 |
 |
| Parameter | Plot |
|---|---|
| CZT HV Monitor | 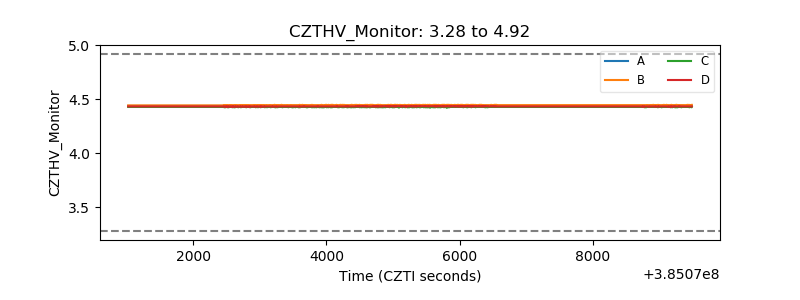 |
| D_VDD | 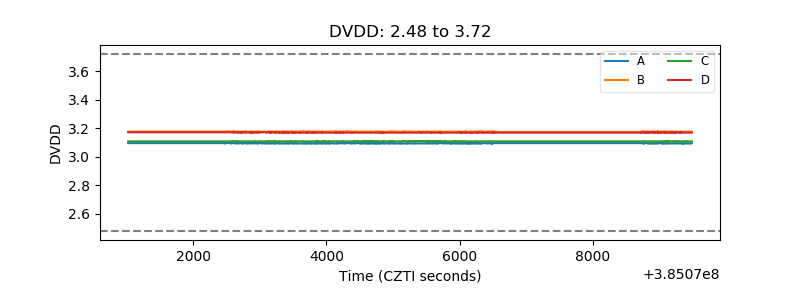 |
| Temperature 1 | 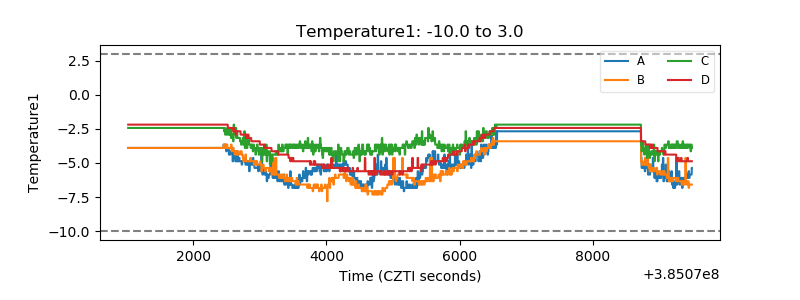 |
| Veto HV Monitor | 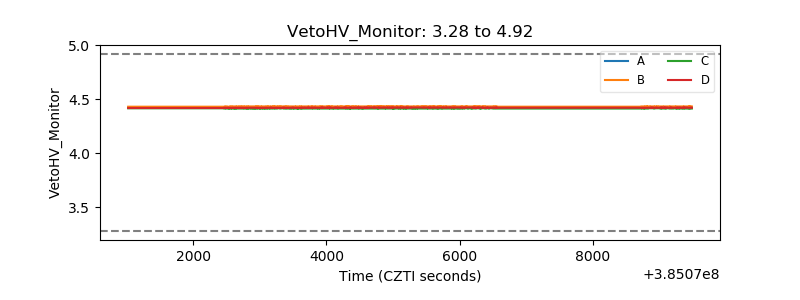 |
| Veto LLD | 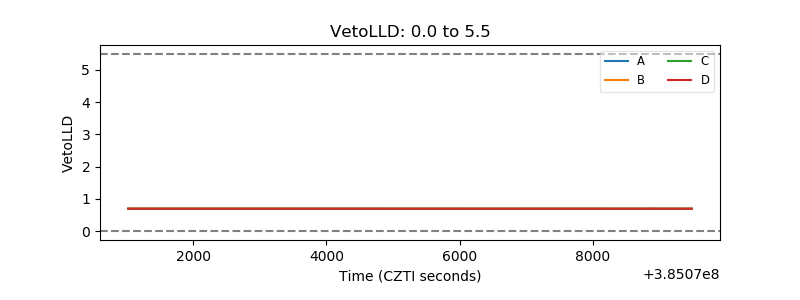 |
| Alpha Counter | 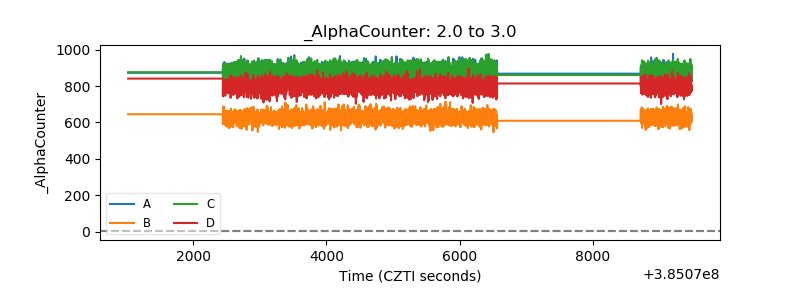 |
| _CPM_Rate | 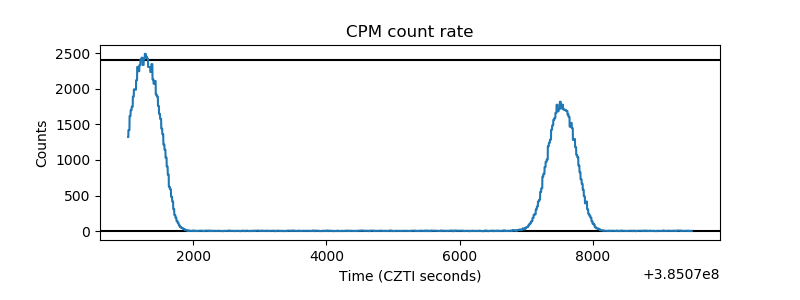 |
| CZT Counter | 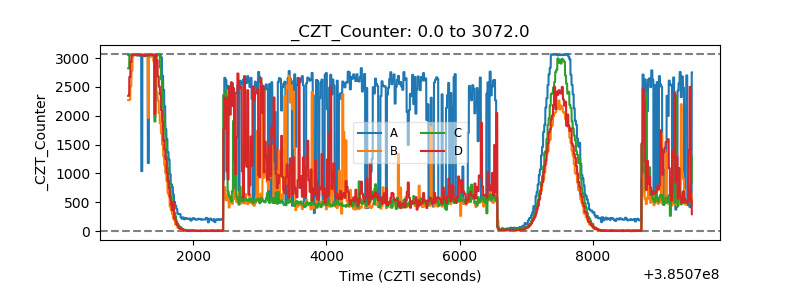 |
| +2.5 Volts monitor | 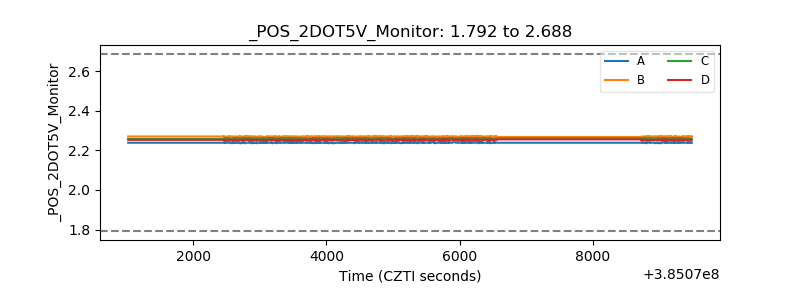 |
| +5 Volts monitor | 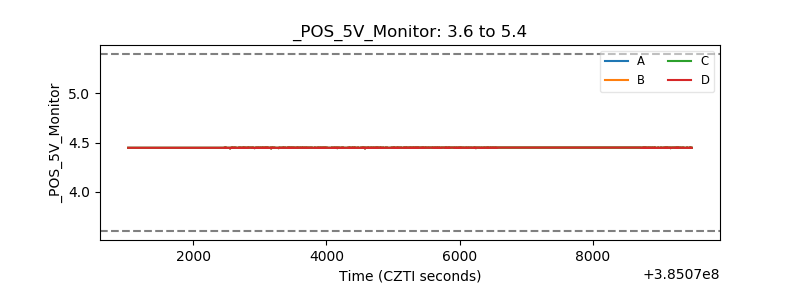 |
| _ROLL_ROT | 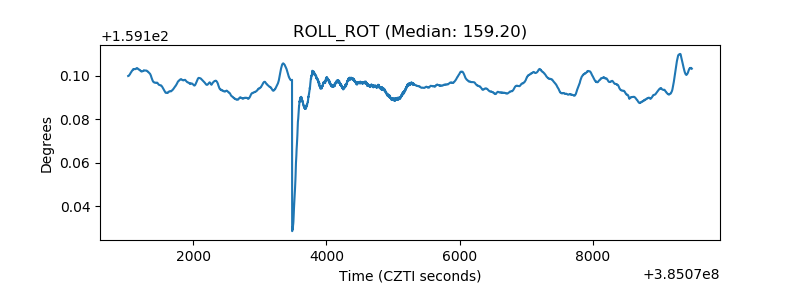 |
| _Roll_DEC | 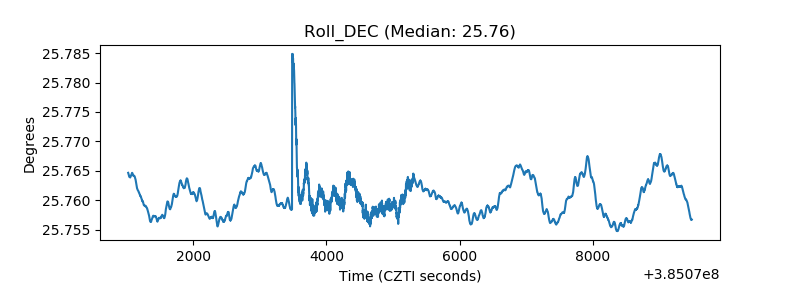 |
| _Roll_RA | 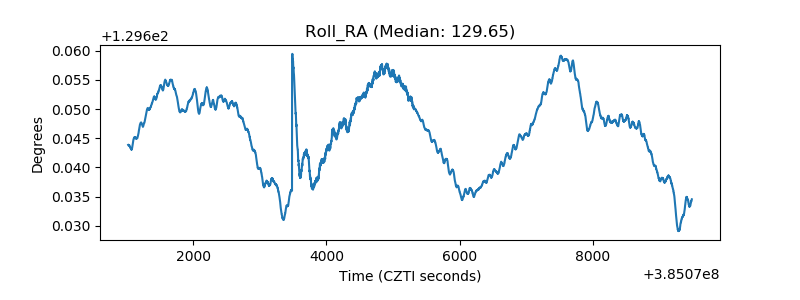 |
| Veto Counter | 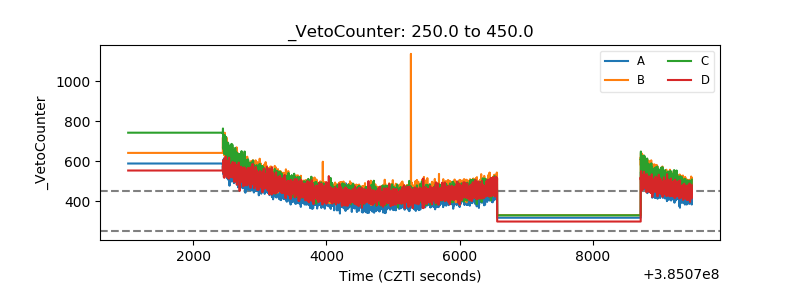 |