| Param | Original file | Final file |
|---|---|---|
| Filename | modeM0/AS1A11_069T01_9000005008_34943cztM0_level2.evt | modeM0/AS1A11_069T01_9000005008_34943cztM0_level2_quad_clean.evt |
| Size (bytes) | 791,712,000 | 56,229,120 |
| Size | 755.0 MB | 53.6 MB |
| Events in quadrant A | 11,264,240 | 134,690 |
| Events in quadrant B | 3,118,648 | 445,577 |
| Events in quadrant C | 2,833,523 | 436,622 |
| Events in quadrant D | 6,421,728 | 331,638 |
| Mode M0 | |||
|---|---|---|---|
| Quadrant | BADHDUFLAG | Total packets | Discarded packets |
| A | 0 | 36711 | 3 |
| B | 0 | 12330 | 2 |
| C | 0 | 11261 | 2 |
| D | 0 | 22506 | 2 |
| Mode SS | |||
|---|---|---|---|
| Quadrant | BADHDUFLAG | Total packets | Discarded packets |
| A | 0 | 102 | 0 |
| B | 0 | 102 | 0 |
| C | 0 | 102 | 0 |
| D | 0 | 102 | 0 |
| Mode M9 | |||
|---|---|---|---|
| Quadrant | BADHDUFLAG | Total packets | Discarded packets |
| A | 0 | 30 | 0 |
| B | 0 | 30 | 0 |
| C | 0 | 30 | 0 |
| D | 0 | 31 | 0 |
| Quadrant | Total seconds | Saturated seconds | Saturation percentage |
|---|---|---|---|
| A | 5020 | 4344 | 86.533865% |
| B | 5020 | 172 | 3.426295% |
| C | 5020 | 80 | 1.593625% |
| D | 5020 | 1241 | 24.721116% |
Noise dominated data is calculated using 1-second bins in cleaned event files. If a bin has >2000 counts, and if more than 50% of those come from <1% of pixels, then it is considered to be noise-dominated and hence unusable.
| Quadrant | # 1 sec bins | Bins with >0 counts | Bins with >2000 counts | High rate bins dominated by noise | Noise dominated (total time) | Noise dominated (detector-on time) | Marked lightcurve |
|---|---|---|---|---|---|---|---|
| A | 7113 | 5020 | 4244 | 4244 | 59.67% | 84.54% | 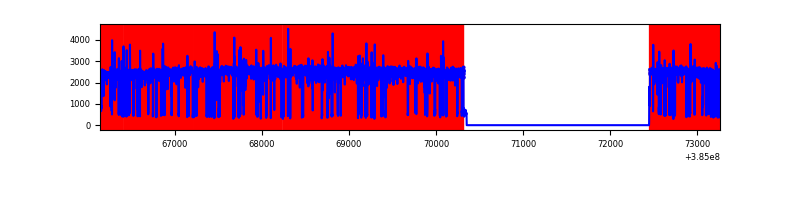 |
| B | 7114 | 5021 | 151 | 151 | 2.12% | 3.01% | 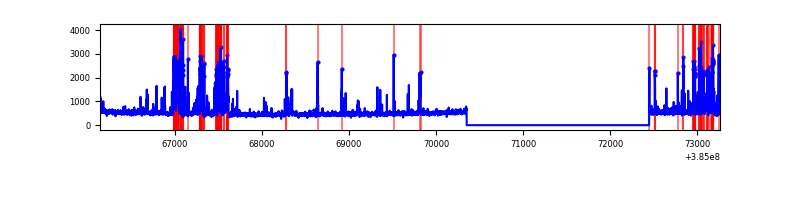 |
| C | 7114 | 5021 | 71 | 71 | 1.00% | 1.41% | 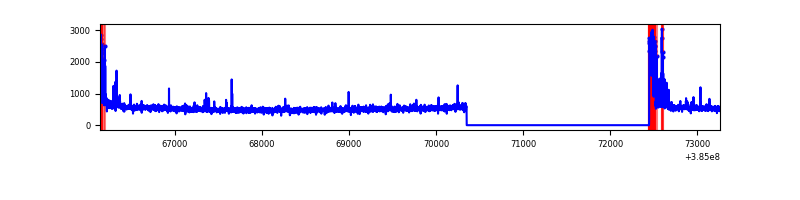 |
| D | 7114 | 5021 | 1217 | 1217 | 17.11% | 24.24% | 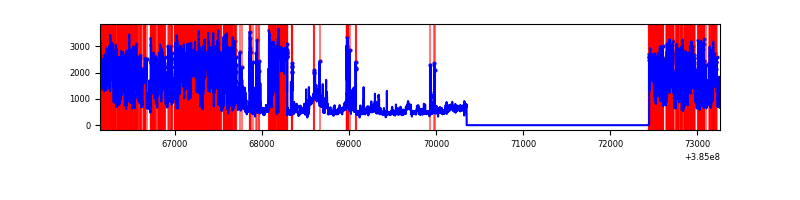 |
Top three noisy pixels from each quadrant. If the there are fewer than three noisy pixels in the level2.evt file, extra rows are filled as -1
| Pixel properties | Quadrant properties | ||||||
|---|---|---|---|---|---|---|---|
| Quadrant | DetID | PixID | Counts | Sigma | Mean | Median | Sigma |
| A | 15 | 169 | 10353029 | 225120.47 | 225 | 222 | 46.0 |
| A | 10 | 83 | 25476 | 549.15 | 225 | 222 | 46.0 |
| A | 13 | 6 | 5993 | 125.49 | 225 | 222 | 46.0 |
| B | 5 | 172 | 588499 | 5198.99 | 606 | 591 | 113.1 |
| B | 0 | 190 | 87999 | 772.97 | 606 | 591 | 113.1 |
| B | 4 | 232 | 49706 | 434.33 | 606 | 591 | 113.1 |
| C | 0 | 10 | 262584 | 1899.44 | 597 | 602 | 137.9 |
| C | 15 | 214 | 210695 | 1523.23 | 597 | 602 | 137.9 |
| C | 2 | 16 | 9968 | 67.91 | 597 | 602 | 137.9 |
| D | 1 | 47 | 1607165 | 12303.12 | 535 | 521 | 130.6 |
| D | 2 | 31 | 538419 | 4119.04 | 535 | 521 | 130.6 |
| D | 1 | 52 | 530317 | 4056.99 | 535 | 521 | 130.6 |
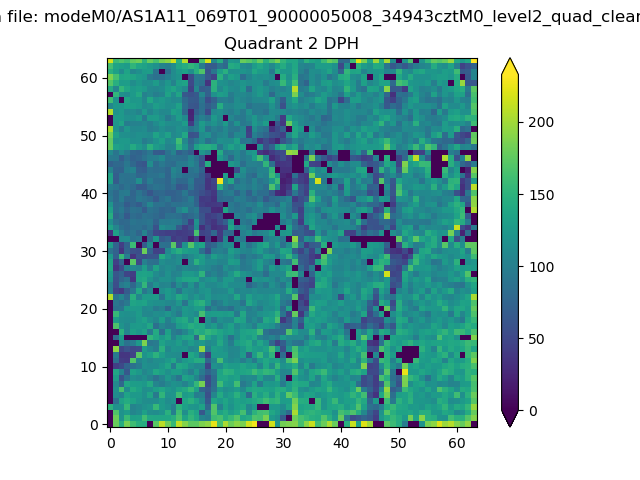
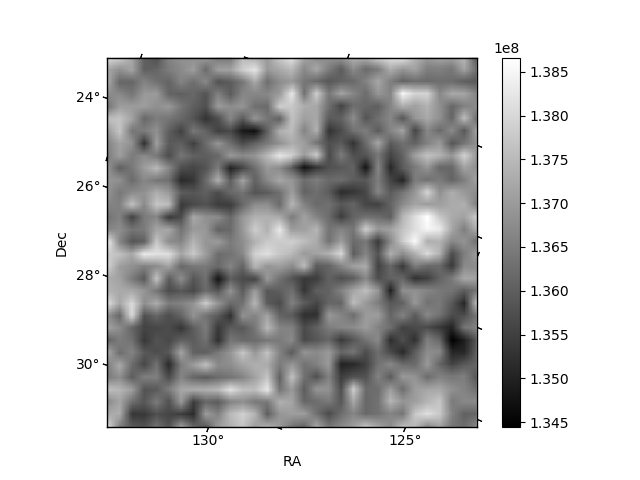
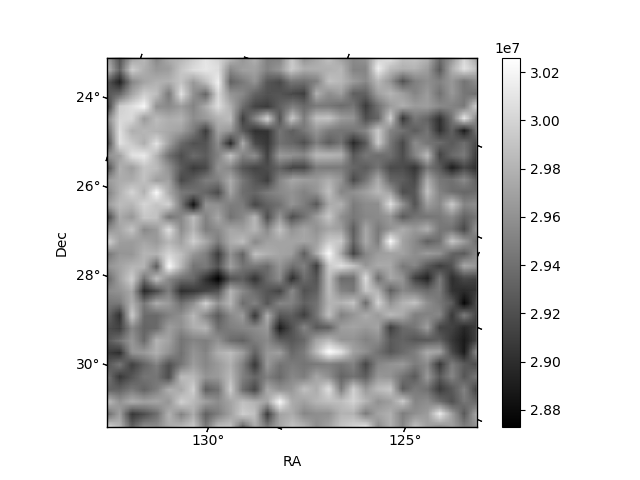
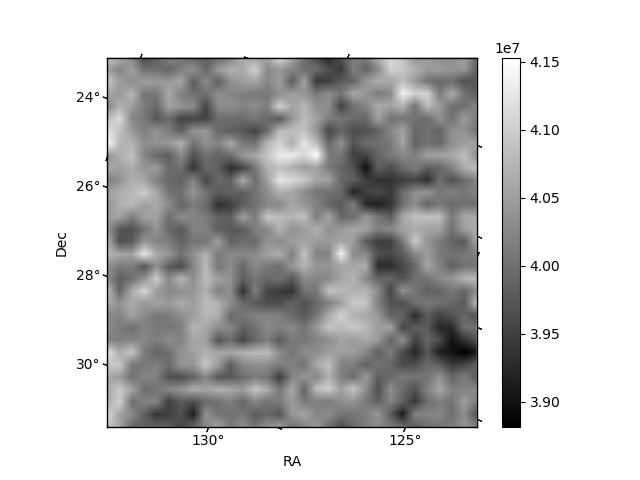
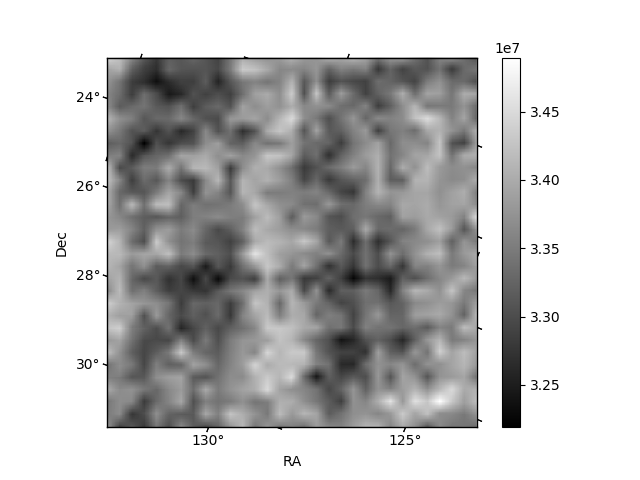
Histogram calculated using DETX and DETY for each event in the final _common_clean file
| Quadrant A | 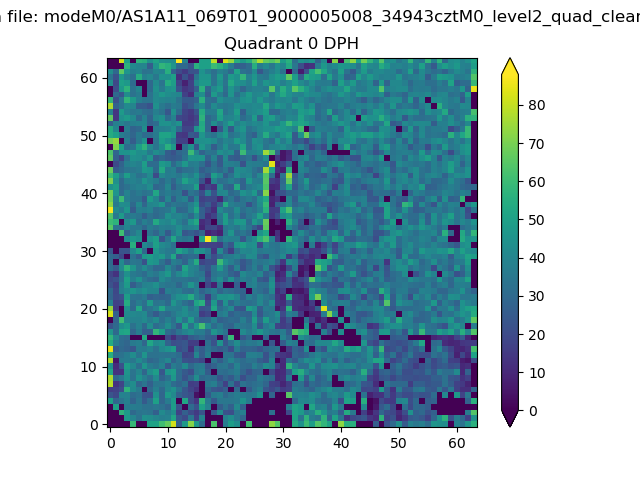 |
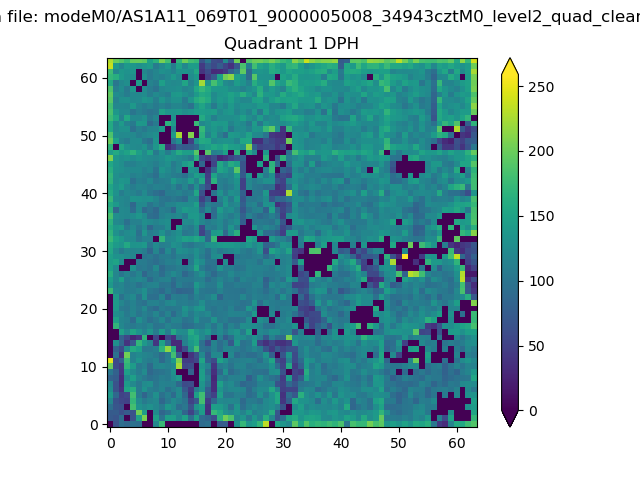 |
Quadrant B |
|---|---|---|---|
| Quadrant D | 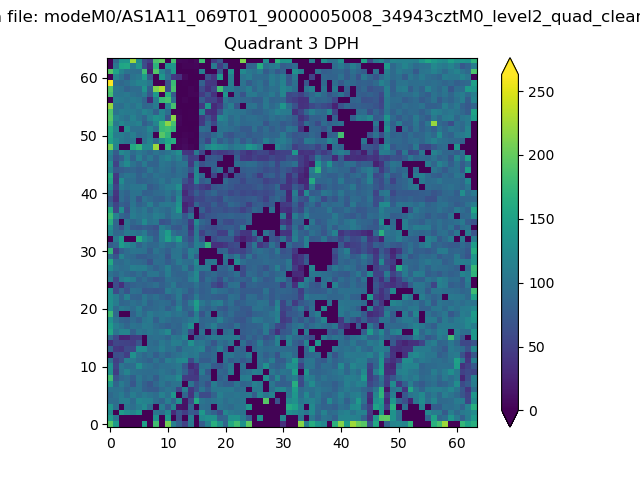 |
 |
Quadrant C |
| Plot type | Count rate plots | Images |
|---|---|---|
| Comparison with Poisson distribution Blue bars denote a histogram of data divided into 1 sec bins. Red curve is a Poisson curve with rate = median count rate of data. |
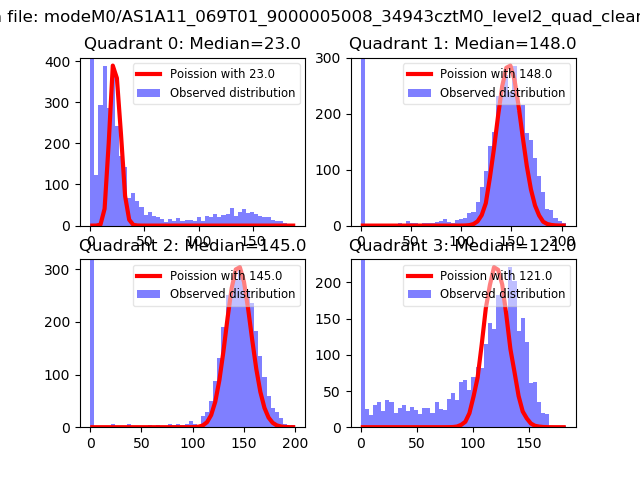 |
 |
| Quadrant-wise count rates Data is divided into 100 sec bins |
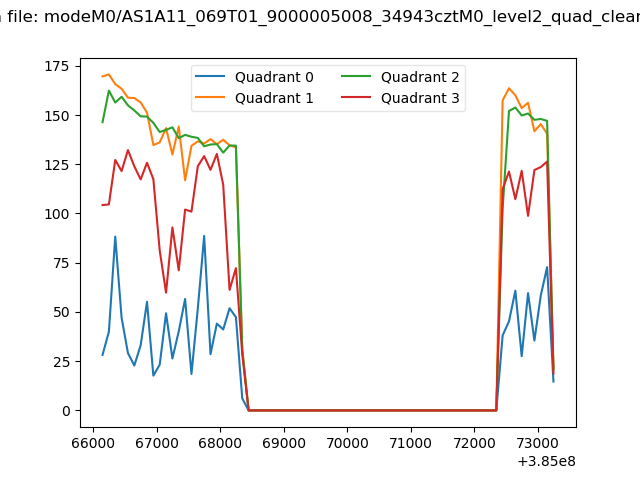 |
|
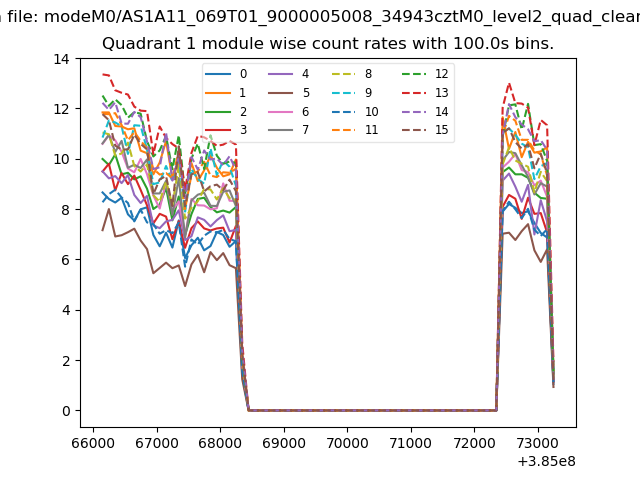
| Module-wise count rates for Quadrant A Data is divided into 100 sec bins |
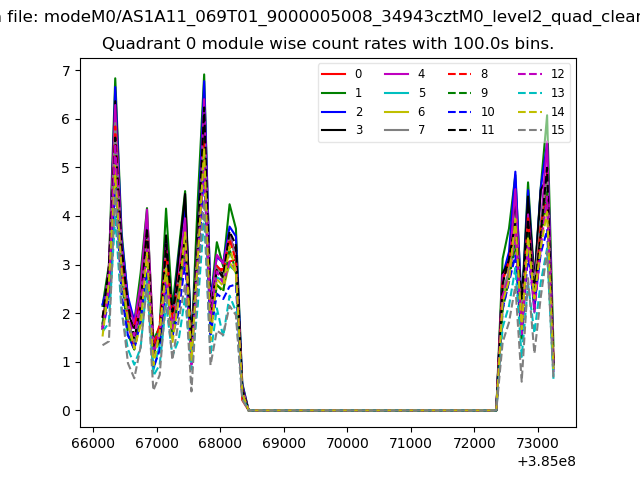 |
 |
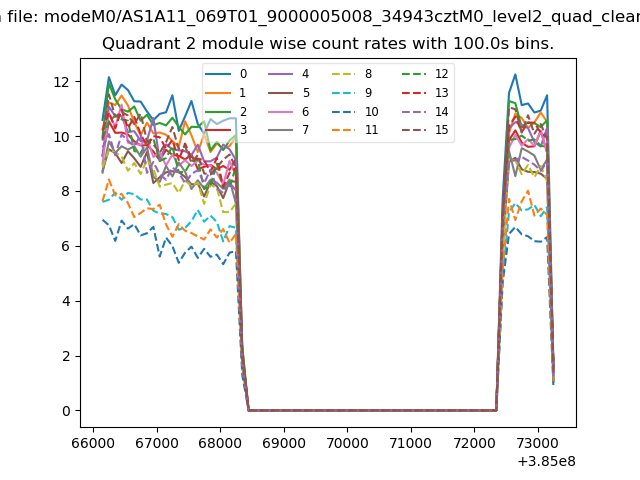
| Module-wise count rates for Quadrant B Data is divided into 100 sec bins |
 |
 |
| Module-wise count rates for Quadrant C Data is divided into 100 sec bins |
 |
 |
| Module-wise count rates for Quadrant D Data is divided into 100 sec bins |
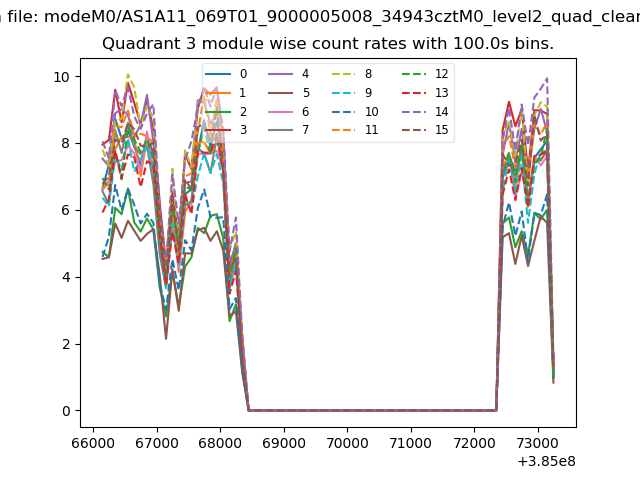 |
 |
| Parameter | Plot |
|---|---|
| CZT HV Monitor | 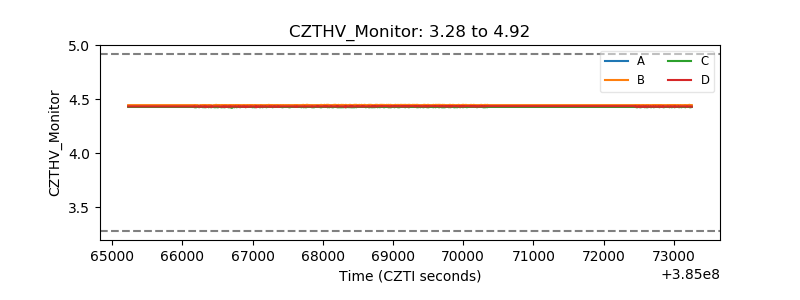 |
| D_VDD | 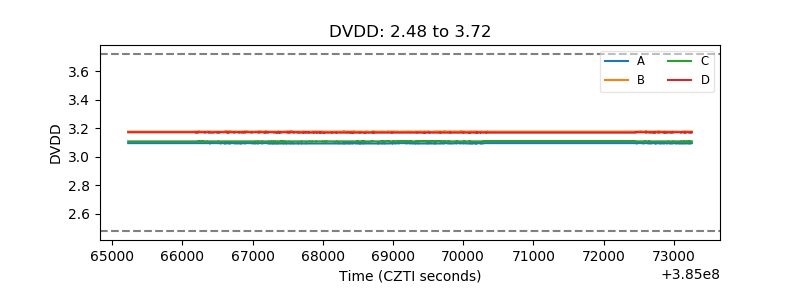 |
| Temperature 1 | 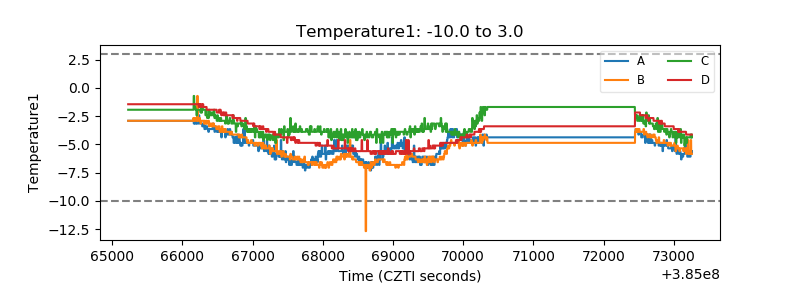 |
| Veto HV Monitor | 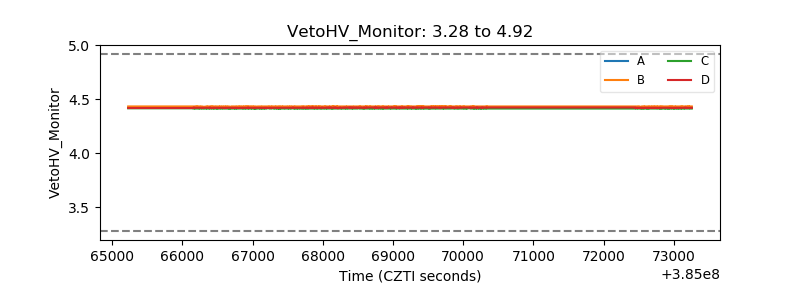 |
| Veto LLD | 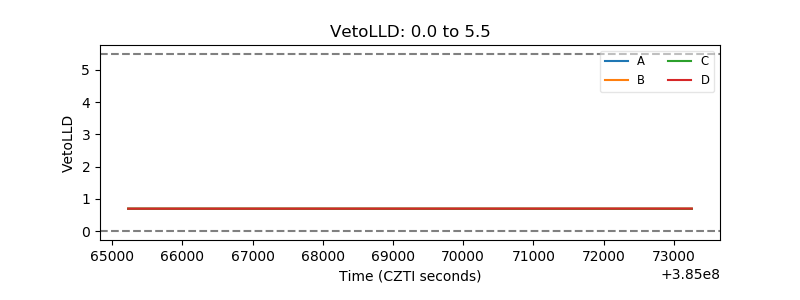 |
| Alpha Counter | 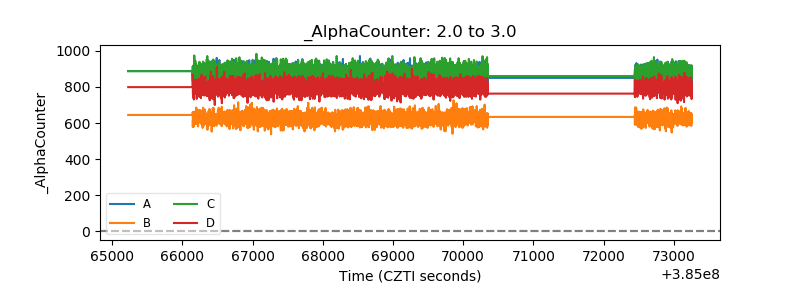 |
| _CPM_Rate | 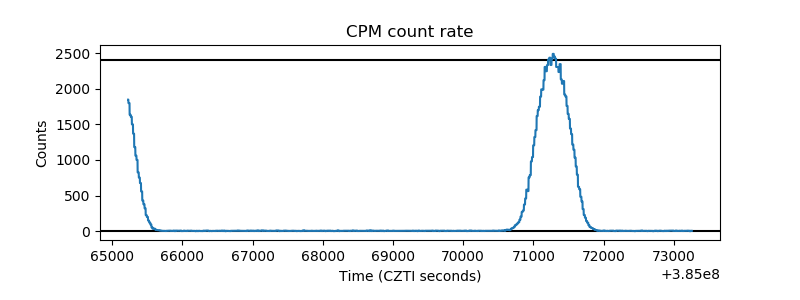 |
| CZT Counter | 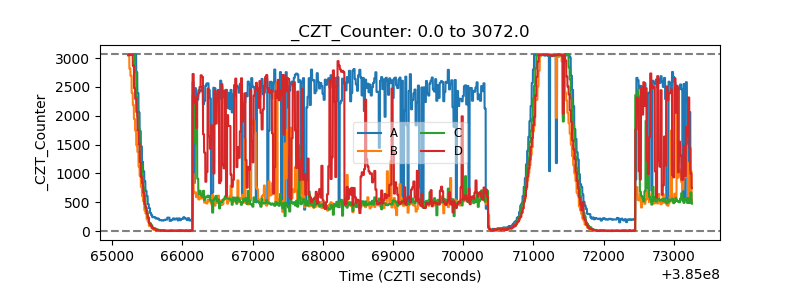 |
| +2.5 Volts monitor | 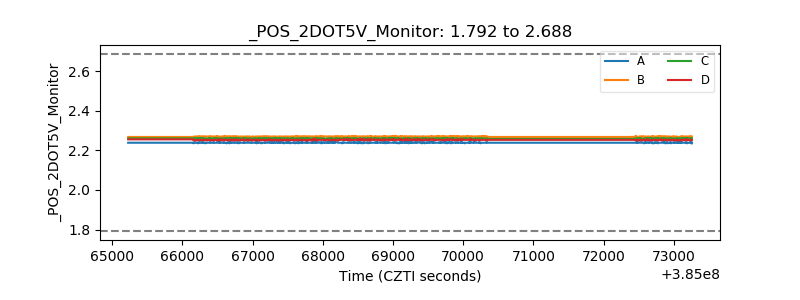 |
| +5 Volts monitor | 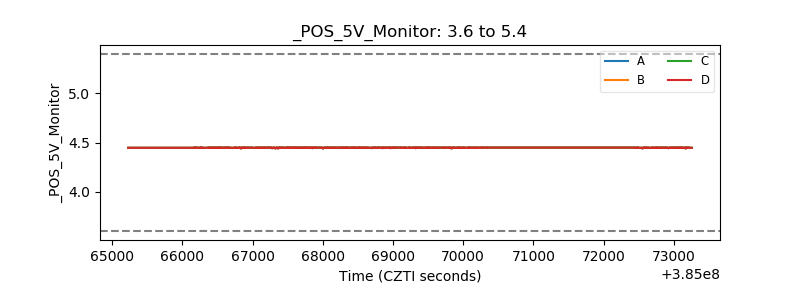 |
| _ROLL_ROT | 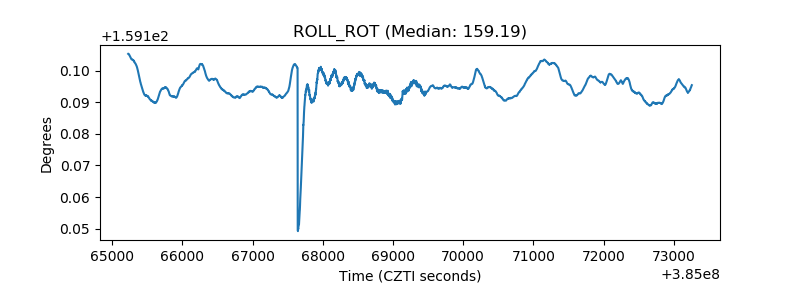 |
| _Roll_DEC | 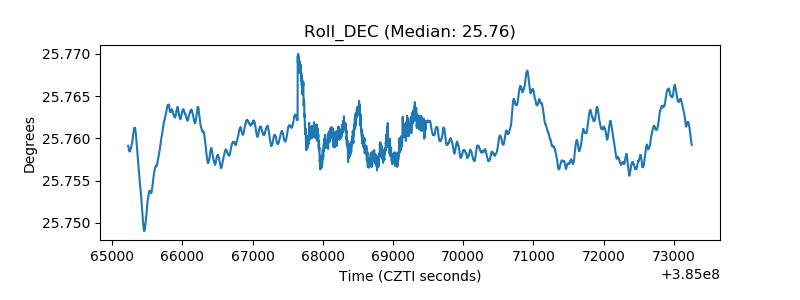 |
| _Roll_RA | 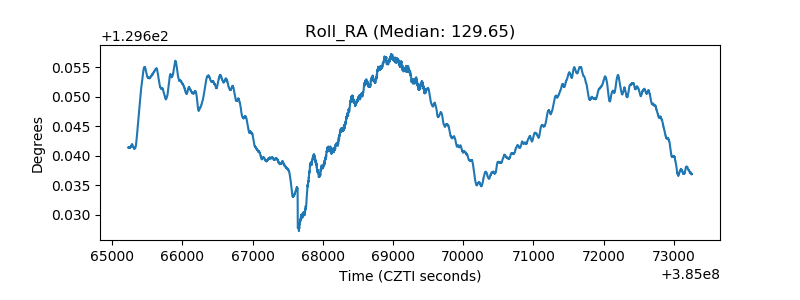 |
| Veto Counter | 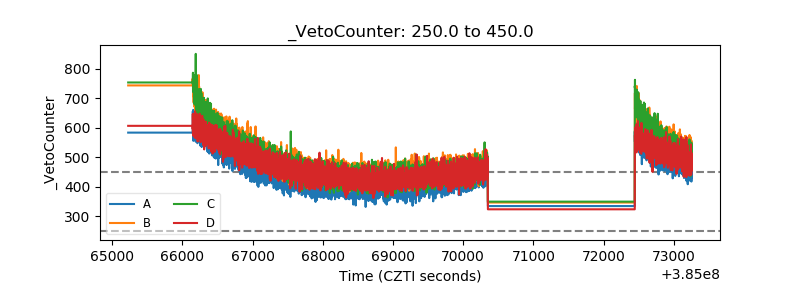 |