| Param | Original file | Final file |
|---|---|---|
| Filename | modeM0/AS1A11_069T01_9000005008_34939cztM0_level2.evt | modeM0/AS1A11_069T01_9000005008_34939cztM0_level2_quad_clean.evt |
| Size (bytes) | 639,973,440 | 83,666,880 |
| Size | 610.3 MB | 79.8 MB |
| Events in quadrant A | 5,926,688 | 540,579 |
| Events in quadrant B | 3,794,719 | 553,723 |
| Events in quadrant C | 2,909,079 | 555,813 |
| Events in quadrant D | 6,382,103 | 500,275 |
| Mode M0 | |||
|---|---|---|---|
| Quadrant | BADHDUFLAG | Total packets | Discarded packets |
| A | 0 | 21372 | 3 |
| B | 0 | 14846 | 2 |
| C | 0 | 11886 | 2 |
| D | 0 | 22729 | 2 |
| Mode SS | |||
|---|---|---|---|
| Quadrant | BADHDUFLAG | Total packets | Discarded packets |
| A | 0 | 110 | 0 |
| B | 0 | 110 | 0 |
| C | 0 | 110 | 0 |
| D | 0 | 110 | 0 |
| Mode M9 | |||
|---|---|---|---|
| Quadrant | BADHDUFLAG | Total packets | Discarded packets |
| A | 0 | 27 | 0 |
| B | 0 | 27 | 0 |
| C | 0 | 27 | 0 |
| D | 0 | 28 | 0 |
| Quadrant | Total seconds | Saturated seconds | Saturation percentage |
|---|---|---|---|
| A | 5471 | 773 | 14.129044% |
| B | 5471 | 345 | 6.305977% |
| C | 5471 | 109 | 1.992323% |
| D | 5471 | 731 | 13.361360% |
Noise dominated data is calculated using 1-second bins in cleaned event files. If a bin has >2000 counts, and if more than 50% of those come from <1% of pixels, then it is considered to be noise-dominated and hence unusable.
| Quadrant | # 1 sec bins | Bins with >0 counts | Bins with >2000 counts | High rate bins dominated by noise | Noise dominated (total time) | Noise dominated (detector-on time) | Marked lightcurve |
|---|---|---|---|---|---|---|---|
| A | 7204 | 5471 | 667 | 667 | 9.26% | 12.19% |  |
| B | 7204 | 5472 | 259 | 259 | 3.60% | 4.73% | 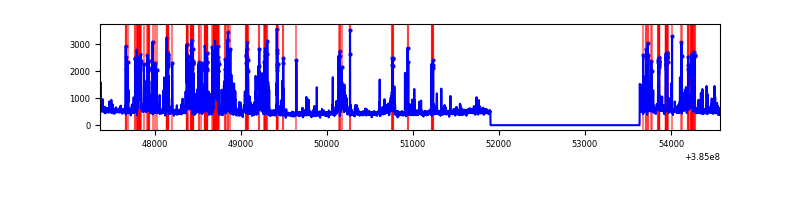 |
| C | 7204 | 5472 | 79 | 79 | 1.10% | 1.44% | 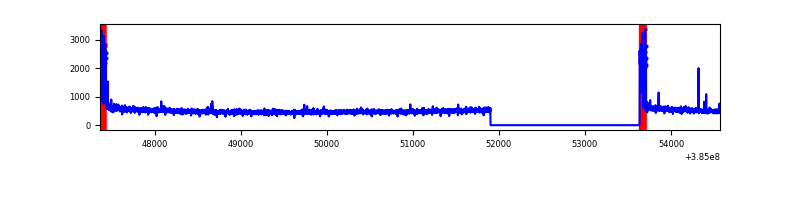 |
| D | 7204 | 5472 | 766 | 766 | 10.63% | 14.00% | 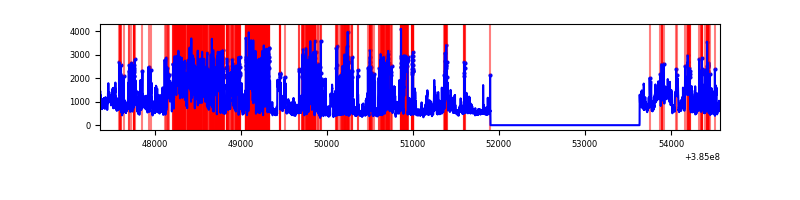 |
Top three noisy pixels from each quadrant. If the there are fewer than three noisy pixels in the level2.evt file, extra rows are filled as -1
| Pixel properties | Quadrant properties | ||||||
|---|---|---|---|---|---|---|---|
| Quadrant | DetID | PixID | Counts | Sigma | Mean | Median | Sigma |
| A | 15 | 169 | 3455510 | 27489.39 | 620 | 608 | 125.7 |
| A | 10 | 83 | 66356 | 523.13 | 620 | 608 | 125.7 |
| A | 13 | 254 | 9059 | 67.24 | 620 | 608 | 125.7 |
| B | 5 | 172 | 1121889 | 9444.9 | 618 | 603 | 118.7 |
| B | 0 | 190 | 107221 | 898.07 | 618 | 603 | 118.7 |
| B | 4 | 232 | 61537 | 513.26 | 618 | 603 | 118.7 |
| C | 0 | 10 | 247306 | 1718.76 | 618 | 623 | 143.5 |
| C | 15 | 214 | 229951 | 1597.84 | 618 | 623 | 143.5 |
| C | 12 | 250 | 8415 | 54.29 | 618 | 623 | 143.5 |
| D | 1 | 52 | 2232271 | 15059.65 | 599 | 582 | 148.2 |
| D | 8 | 195 | 554169 | 3735.66 | 599 | 582 | 148.2 |
| D | 2 | 31 | 486140 | 3276.59 | 599 | 582 | 148.2 |
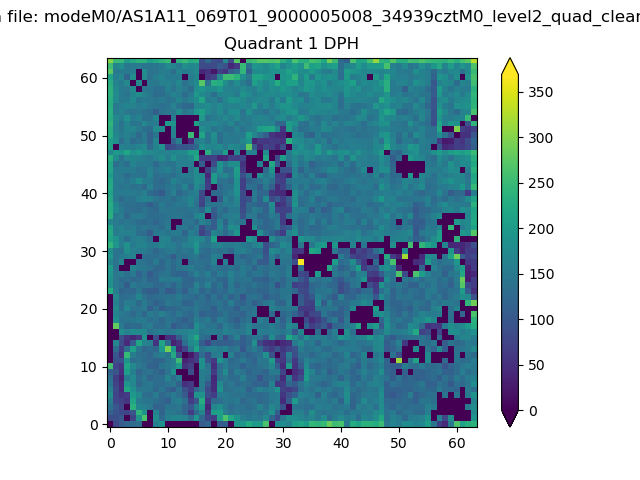
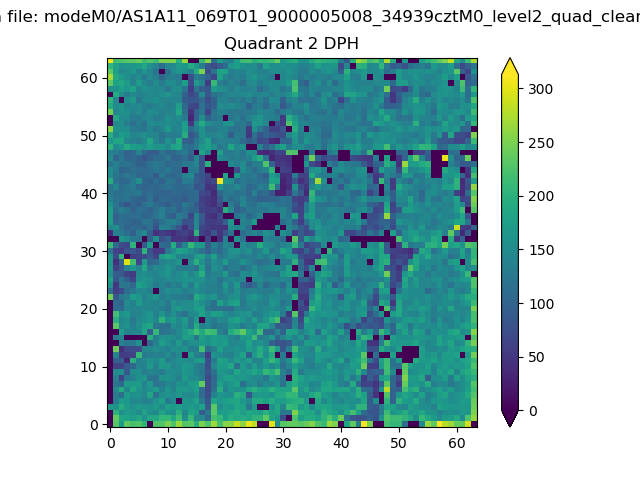
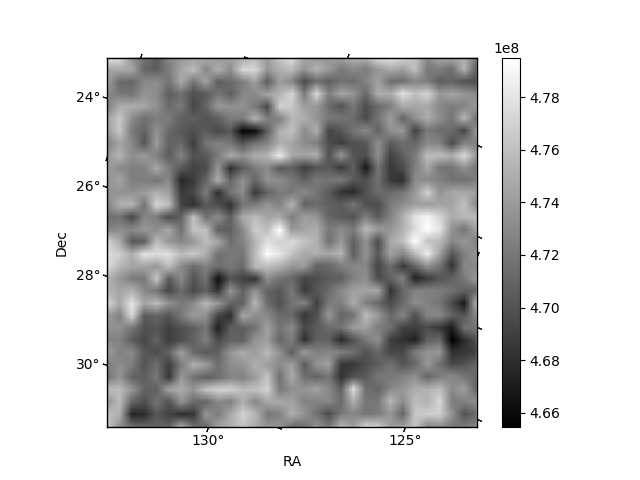
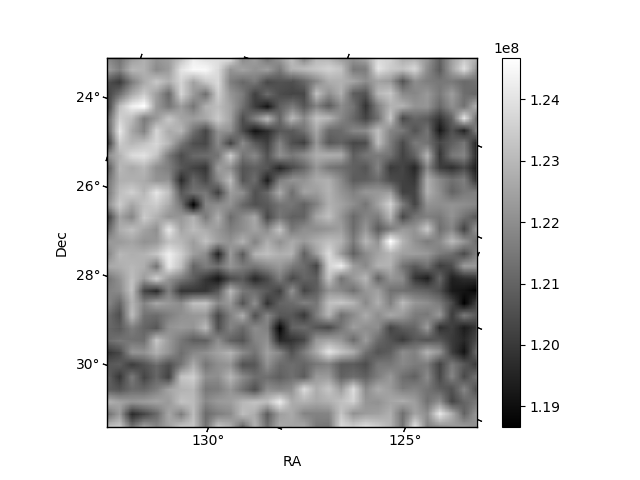
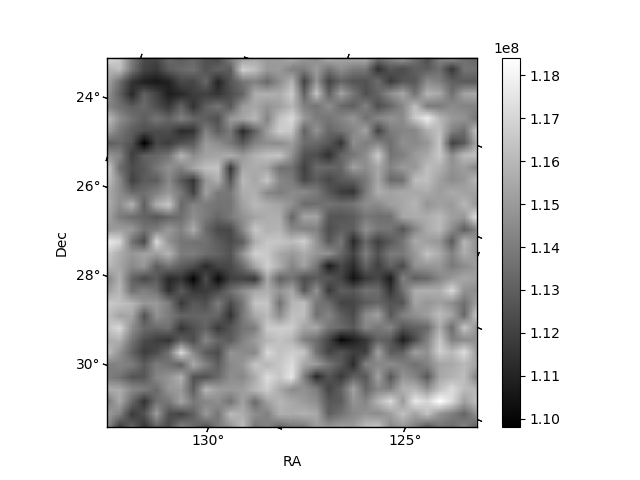
Histogram calculated using DETX and DETY for each event in the final _common_clean file
| Quadrant A | 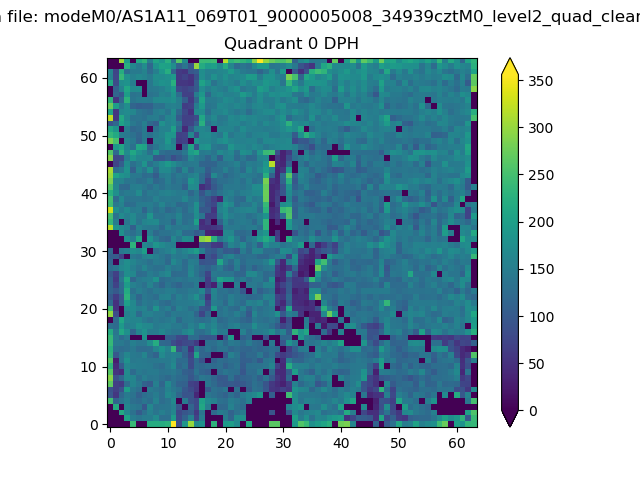 |
 |
Quadrant B |
|---|---|---|---|
| Quadrant D | 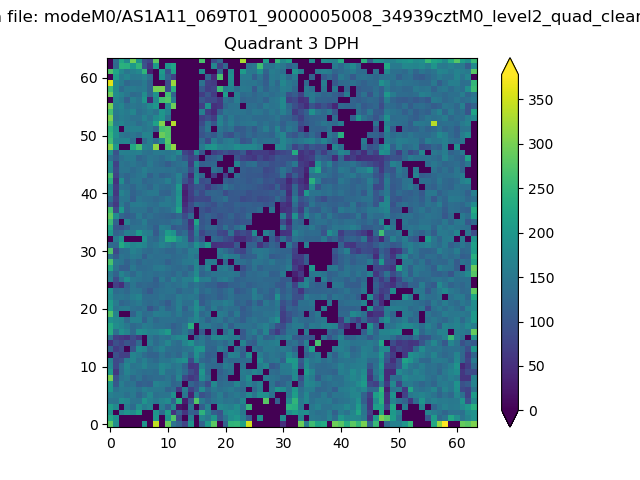 |
 |
Quadrant C |
| Plot type | Count rate plots | Images |
|---|---|---|
| Comparison with Poisson distribution Blue bars denote a histogram of data divided into 1 sec bins. Red curve is a Poisson curve with rate = median count rate of data. |
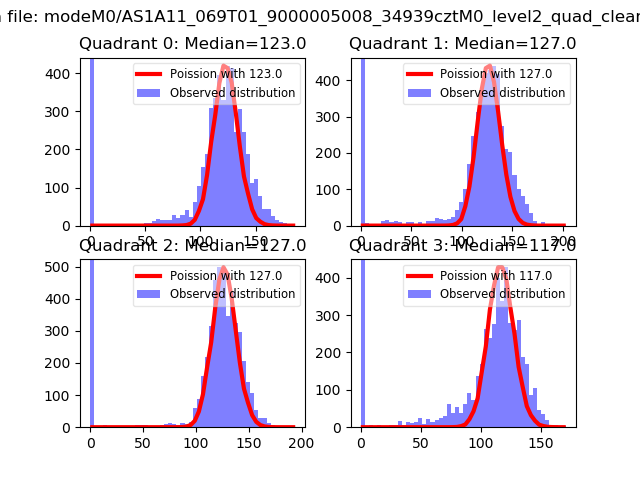 |
 |
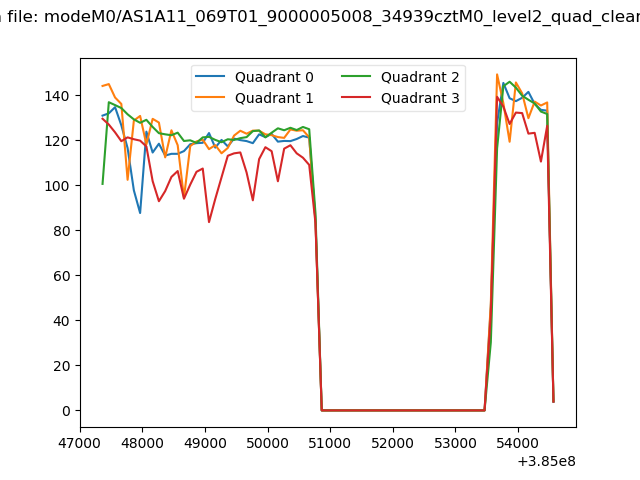
| Quadrant-wise count rates Data is divided into 100 sec bins |
 |
|
| Module-wise count rates for Quadrant A Data is divided into 100 sec bins |
 |
 |
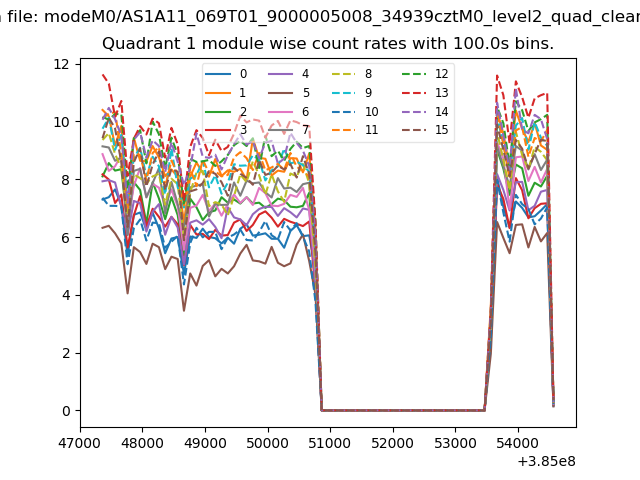
| Module-wise count rates for Quadrant B Data is divided into 100 sec bins |
 |
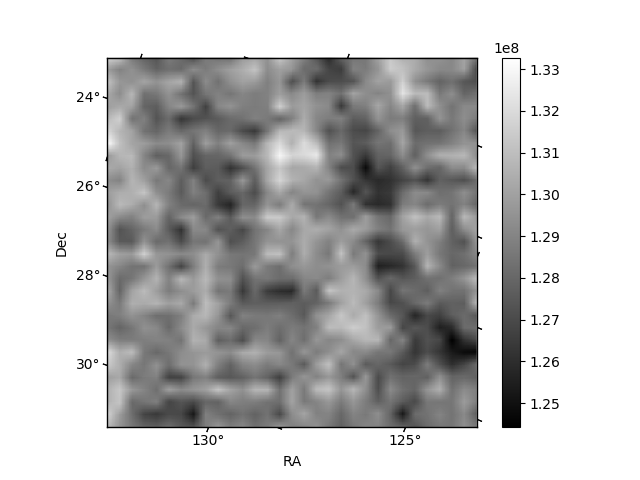 |
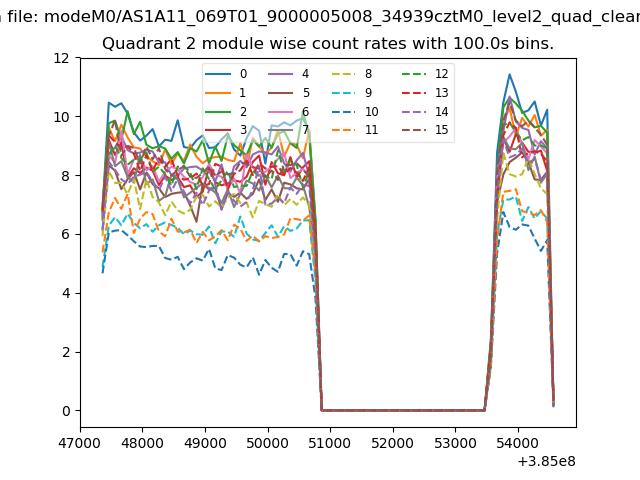
| Module-wise count rates for Quadrant C Data is divided into 100 sec bins |
 |
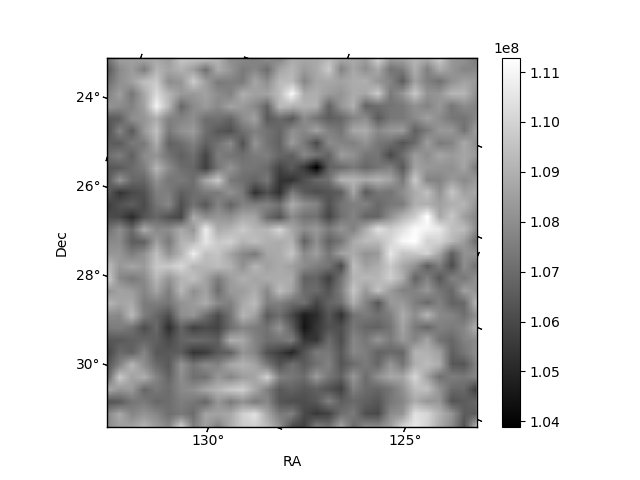 |
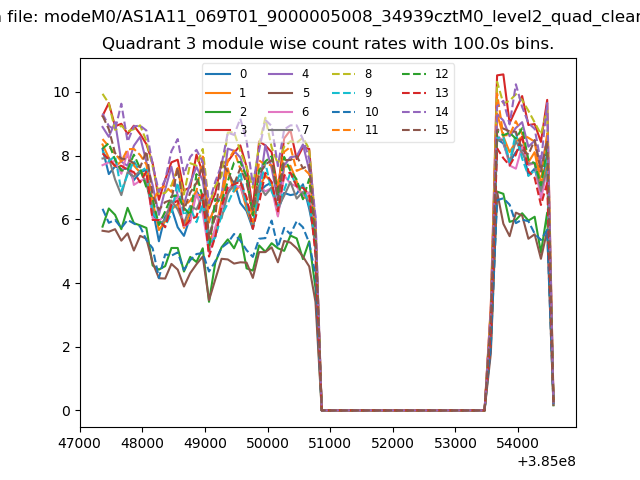
| Module-wise count rates for Quadrant D Data is divided into 100 sec bins |
 |
 |
| Parameter | Plot |
|---|---|
| CZT HV Monitor | 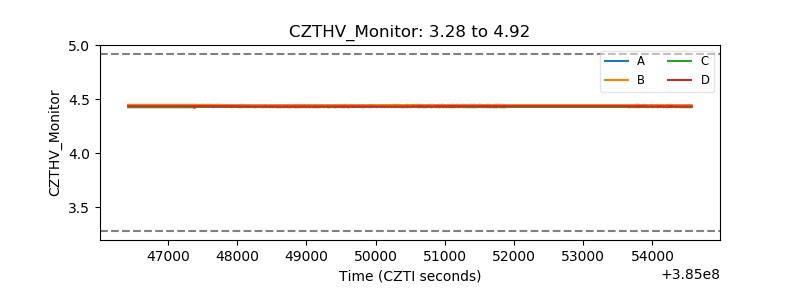 |
| D_VDD | 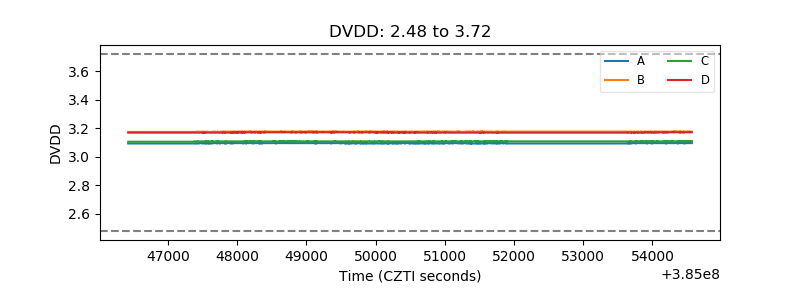 |
| Temperature 1 | 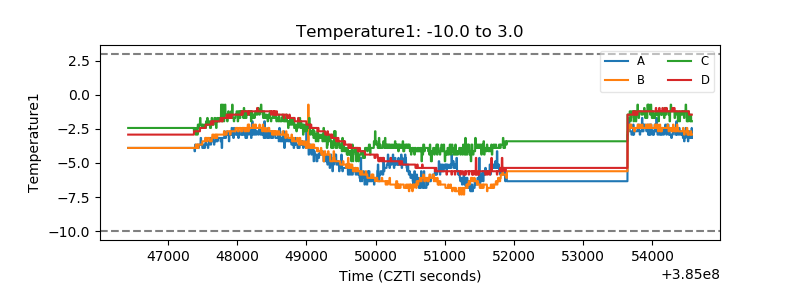 |
| Veto HV Monitor | 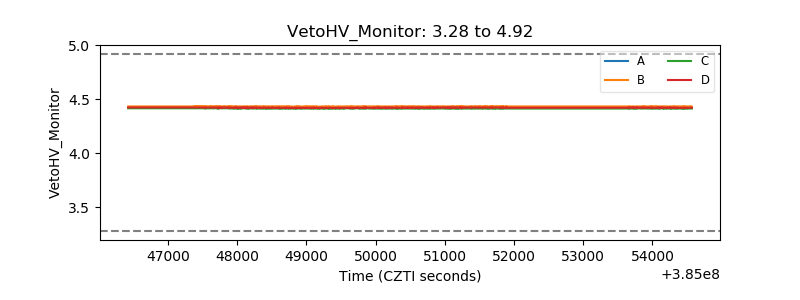 |
| Veto LLD | 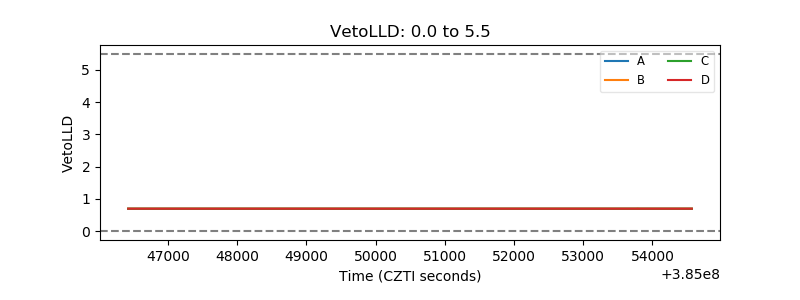 |
| Alpha Counter | 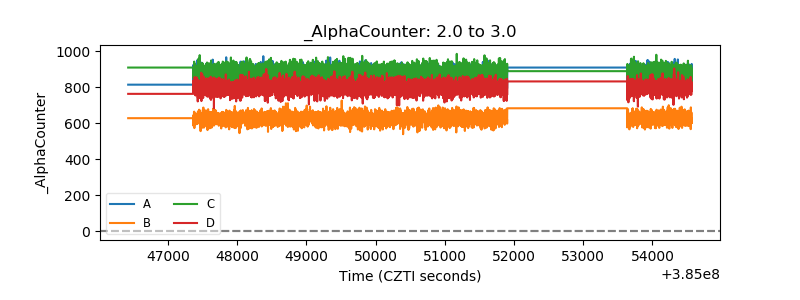 |
| _CPM_Rate |  |
| CZT Counter | 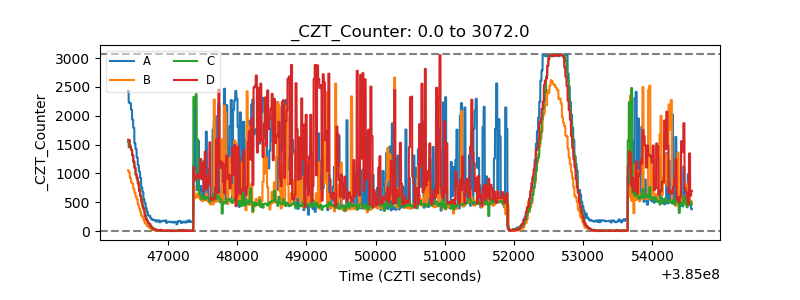 |
| +2.5 Volts monitor | 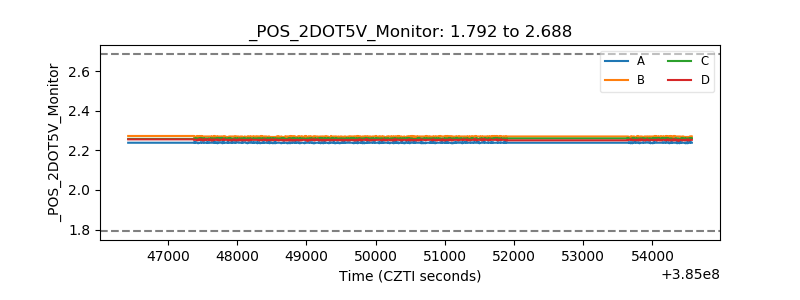 |
| +5 Volts monitor | 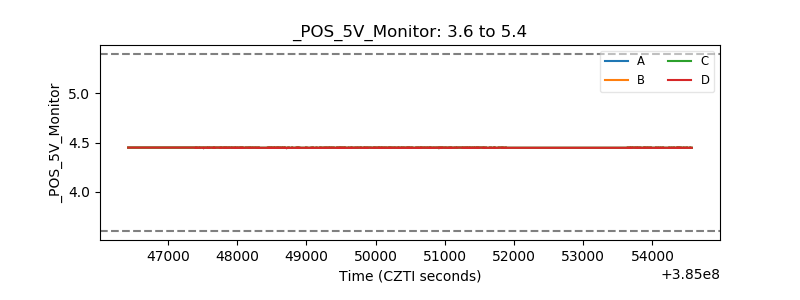 |
| _ROLL_ROT | 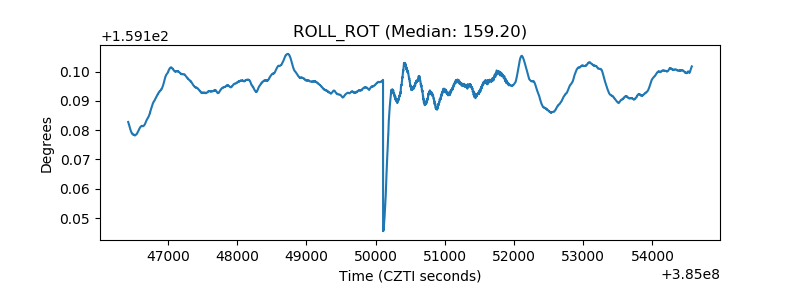 |
| _Roll_DEC | 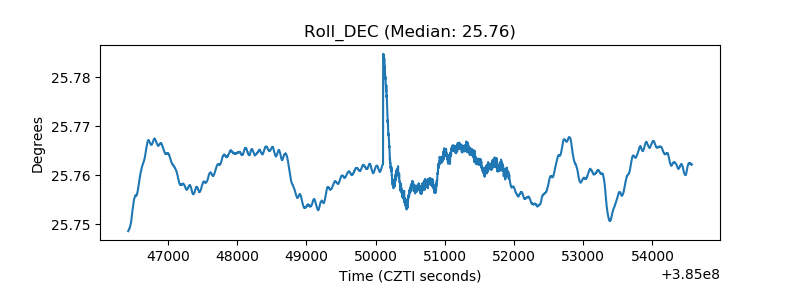 |
| _Roll_RA | 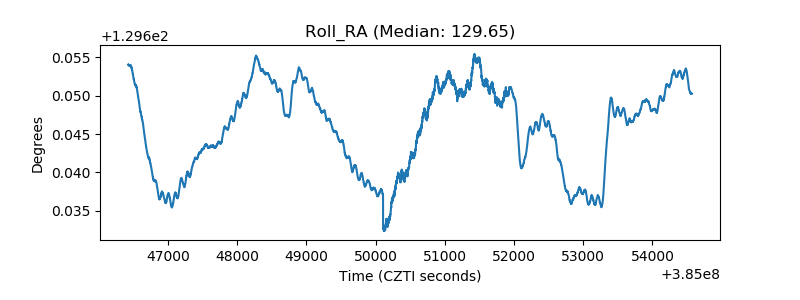 |
| Veto Counter | 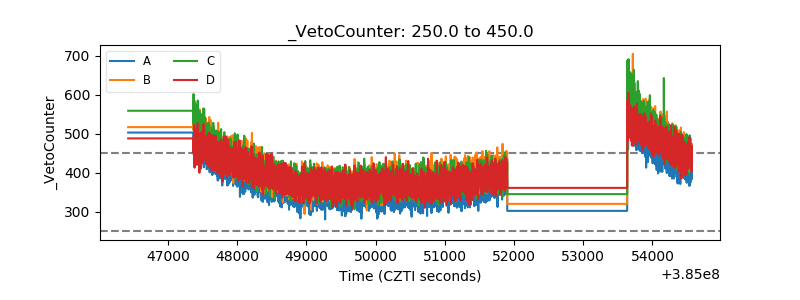 |