| Param | Original file | Final file |
|---|---|---|
| Filename | modeM0/AS1A11_069T01_9000005008_34938cztM0_level2.evt | modeM0/AS1A11_069T01_9000005008_34938cztM0_level2_quad_clean.evt |
| Size (bytes) | 212,958,720 | 20,024,640 |
| Size | 203.1 MB | 19.1 MB |
| Events in quadrant A | 2,221,682 | 114,346 |
| Events in quadrant B | 1,269,945 | 126,415 |
| Events in quadrant C | 1,014,149 | 123,194 |
| Events in quadrant D | 1,824,366 | 114,625 |
| Mode M0 | |||
|---|---|---|---|
| Quadrant | BADHDUFLAG | Total packets | Discarded packets |
| A | 0 | 7759 | 2 |
| B | 0 | 4839 | 1 |
| C | 0 | 3938 | 1 |
| D | 0 | 6618 | 1 |
| Mode SS | |||
|---|---|---|---|
| Quadrant | BADHDUFLAG | Total packets | Discarded packets |
| A | 0 | 38 | 0 |
| B | 0 | 38 | 0 |
| C | 0 | 38 | 0 |
| D | 0 | 38 | 0 |
| Mode M9 | |||
|---|---|---|---|
| Quadrant | BADHDUFLAG | Total packets | Discarded packets |
| A | 0 | 16 | 0 |
| B | 0 | 16 | 0 |
| C | 0 | 16 | 0 |
| D | 0 | 16 | 0 |
| Quadrant | Total seconds | Saturated seconds | Saturation percentage |
|---|---|---|---|
| A | 1727 | 427 | 24.724957% |
| B | 1727 | 141 | 8.164447% |
| C | 1727 | 55 | 3.184713% |
| D | 1727 | 125 | 7.237985% |
Noise dominated data is calculated using 1-second bins in cleaned event files. If a bin has >2000 counts, and if more than 50% of those come from <1% of pixels, then it is considered to be noise-dominated and hence unusable.
| Quadrant | # 1 sec bins | Bins with >0 counts | Bins with >2000 counts | High rate bins dominated by noise | Noise dominated (total time) | Noise dominated (detector-on time) | Marked lightcurve |
|---|---|---|---|---|---|---|---|
| A | 3339 | 1728 | 319 | 319 | 9.55% | 18.46% | 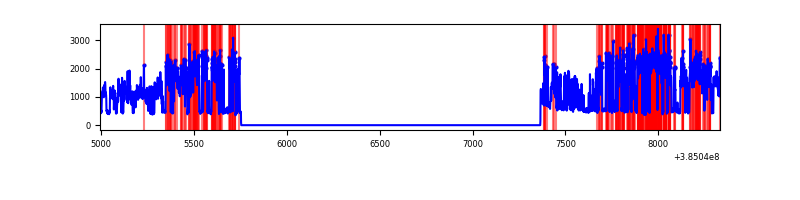 |
| B | 3339 | 1728 | 97 | 97 | 2.91% | 5.61% | 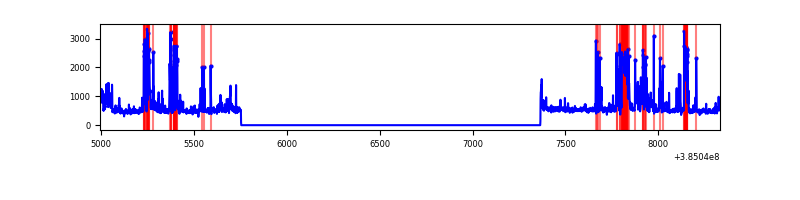 |
| C | 3339 | 1728 | 43 | 43 | 1.29% | 2.49% | 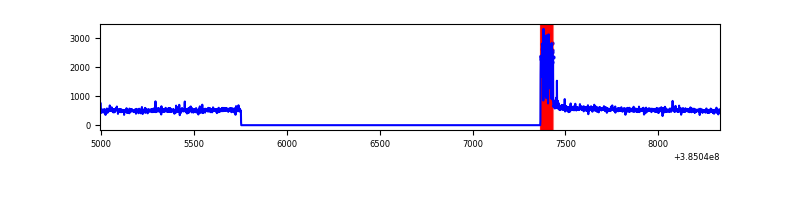 |
| D | 3339 | 1728 | 107 | 107 | 3.20% | 6.19% | 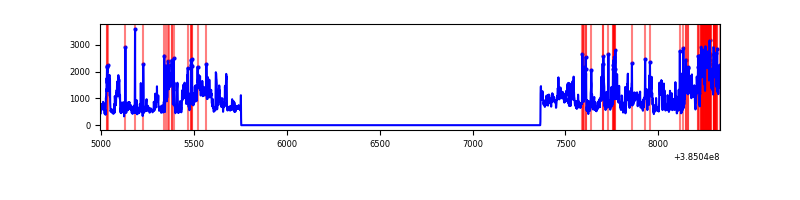 |
Top three noisy pixels from each quadrant. If the there are fewer than three noisy pixels in the level2.evt file, extra rows are filled as -1
| Pixel properties | Quadrant properties | ||||||
|---|---|---|---|---|---|---|---|
| Quadrant | DetID | PixID | Counts | Sigma | Mean | Median | Sigma |
| A | 15 | 169 | 1403832 | 32658.92 | 203 | 199 | 43.0 |
| A | 10 | 83 | 28659 | 662.19 | 203 | 199 | 43.0 |
| A | 13 | 254 | 2724 | 58.75 | 203 | 199 | 43.0 |
| B | 5 | 172 | 407459 | 9725.95 | 206 | 200 | 41.9 |
| B | 0 | 244 | 17092 | 403.41 | 206 | 200 | 41.9 |
| B | 0 | 190 | 15212 | 358.51 | 206 | 200 | 41.9 |
| C | 0 | 10 | 121633 | 2477.51 | 205 | 207 | 49.0 |
| C | 15 | 214 | 74373 | 1513.24 | 205 | 207 | 49.0 |
| C | 15 | 159 | 5839 | 114.91 | 205 | 207 | 49.0 |
| D | 1 | 52 | 541375 | 10406.77 | 204 | 198 | 52.0 |
| D | 8 | 195 | 158457 | 3043.3 | 204 | 198 | 52.0 |
| D | 2 | 31 | 96504 | 1851.95 | 204 | 198 | 52.0 |
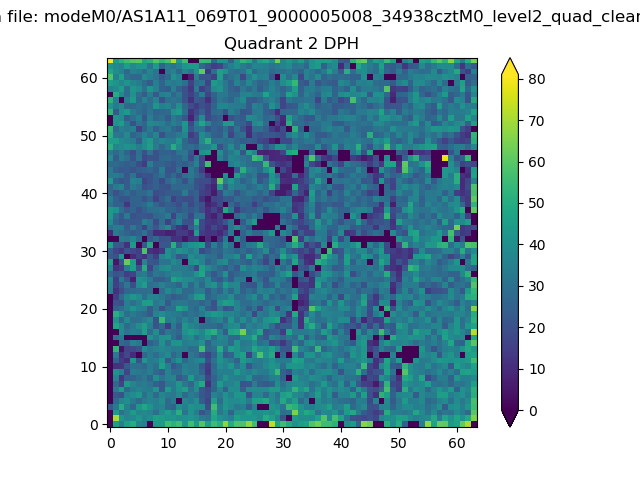
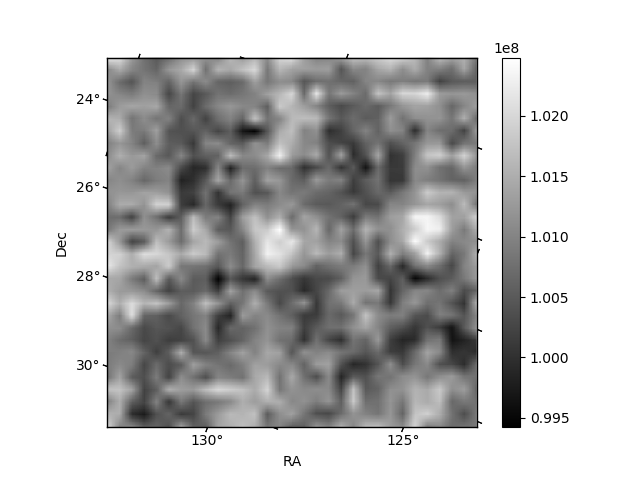
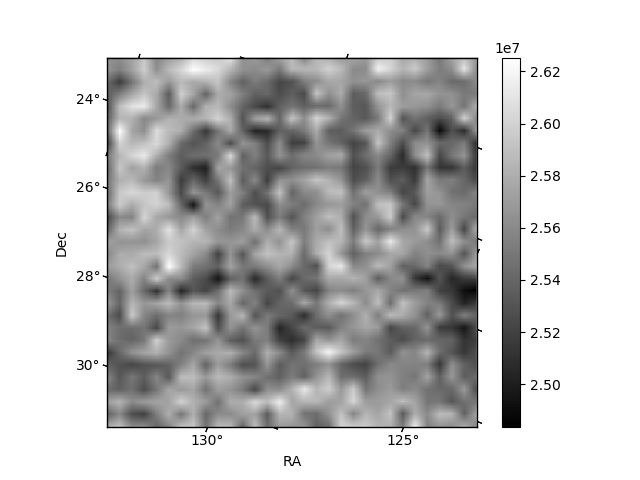
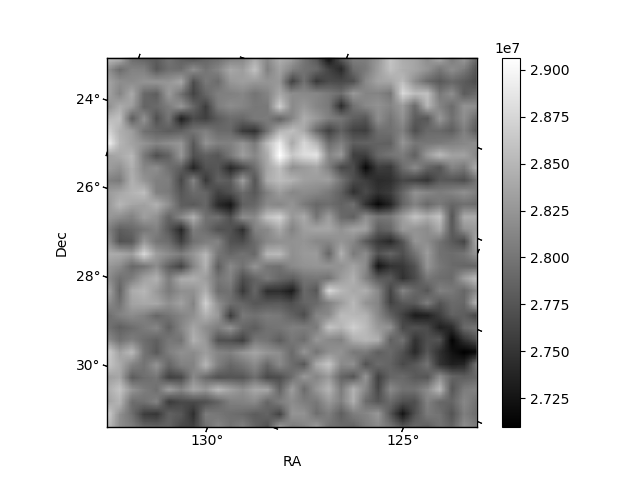
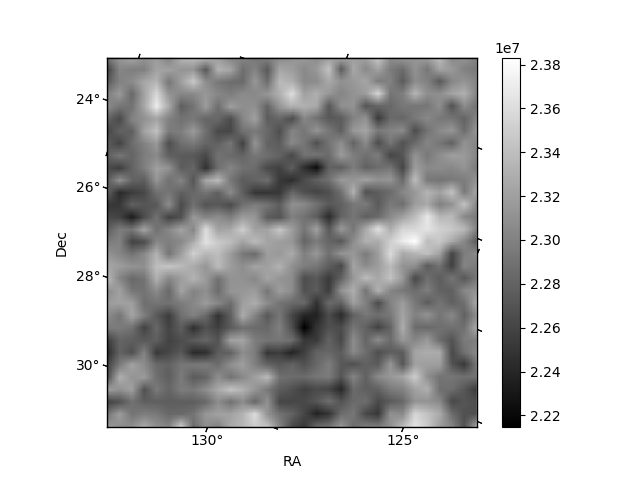
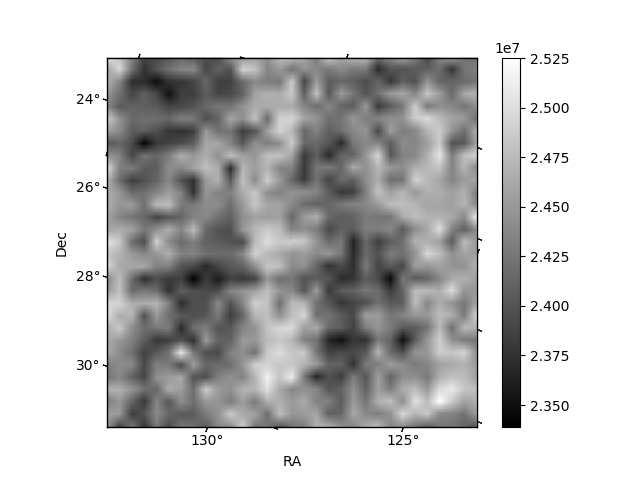
Histogram calculated using DETX and DETY for each event in the final _common_clean file
| Quadrant A | 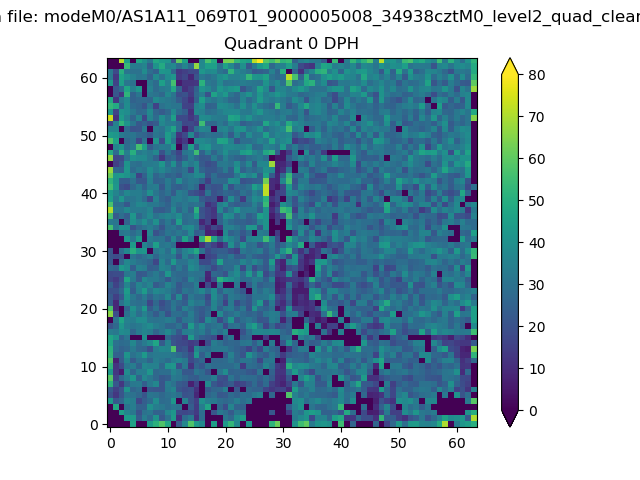 |
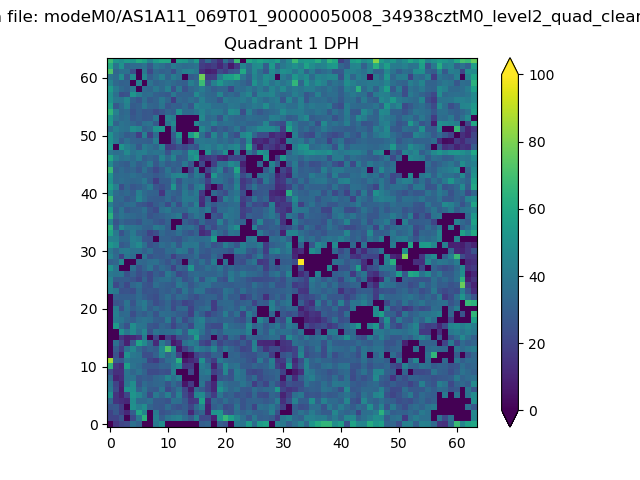 |
Quadrant B |
|---|---|---|---|
| Quadrant D | 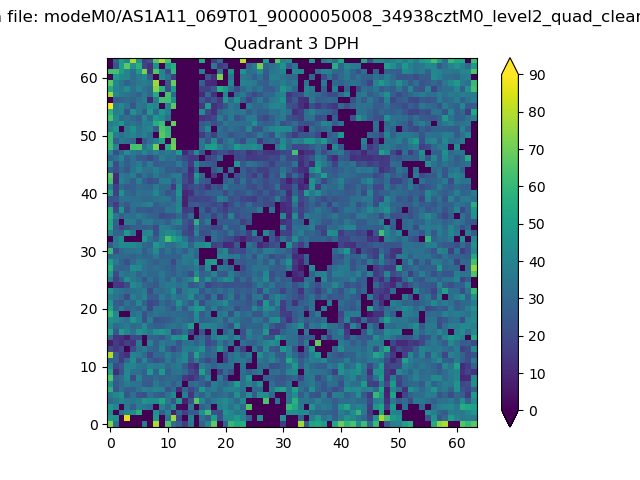 |
 |
Quadrant C |
| Plot type | Count rate plots | Images |
|---|---|---|
| Comparison with Poisson distribution Blue bars denote a histogram of data divided into 1 sec bins. Red curve is a Poisson curve with rate = median count rate of data. |
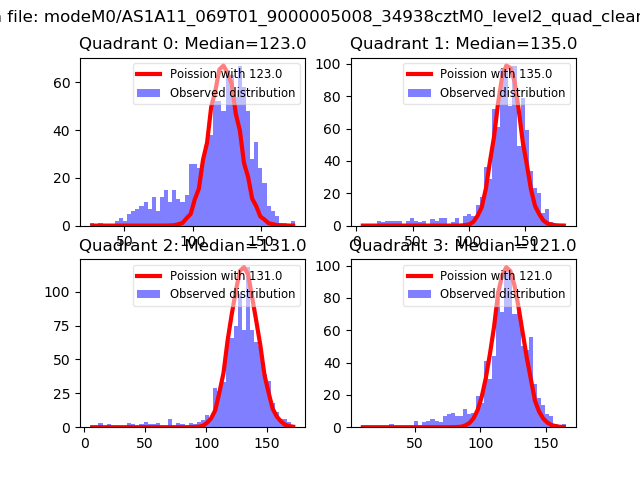 |
 |
| Quadrant-wise count rates Data is divided into 100 sec bins |
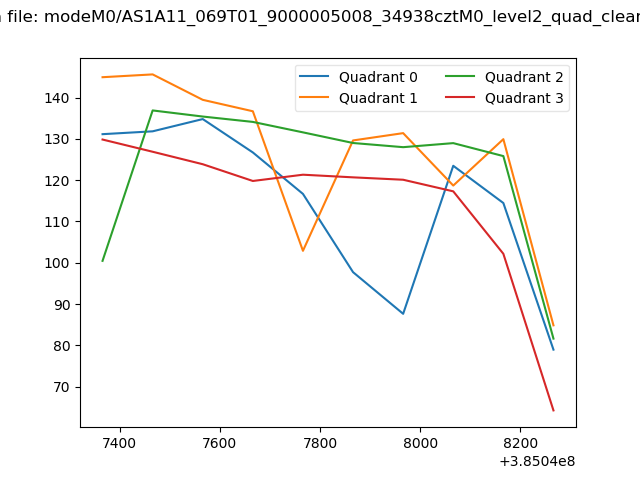 |
|
| Module-wise count rates for Quadrant A Data is divided into 100 sec bins |
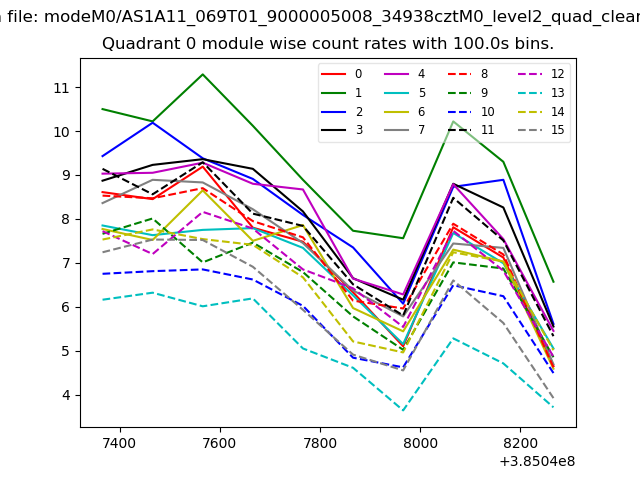 |
 |
| Module-wise count rates for Quadrant B Data is divided into 100 sec bins |
 |
 |
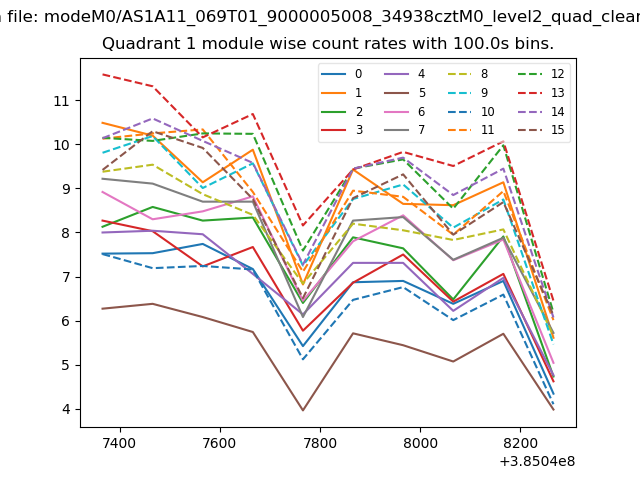
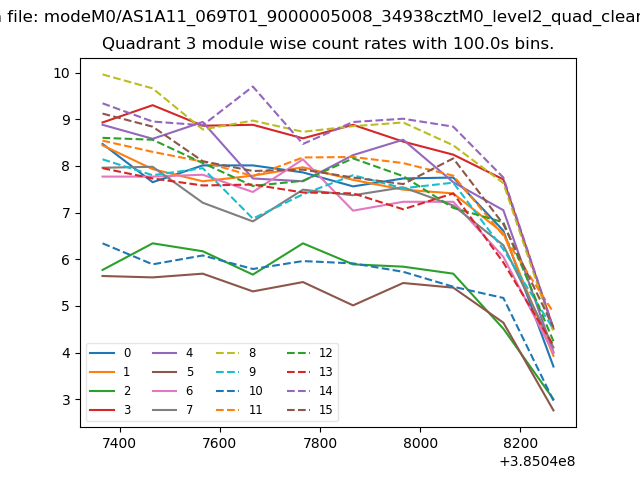
| Module-wise count rates for Quadrant C Data is divided into 100 sec bins |
 |
 |
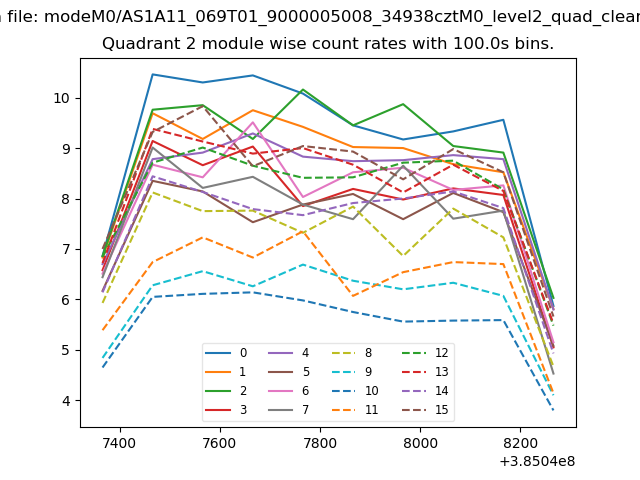
| Module-wise count rates for Quadrant D Data is divided into 100 sec bins |
 |
 |
| Parameter | Plot |
|---|---|
| CZT HV Monitor |  |
| D_VDD | 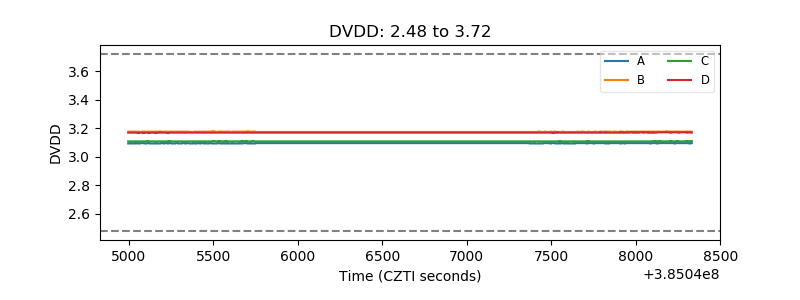 |
| Temperature 1 | 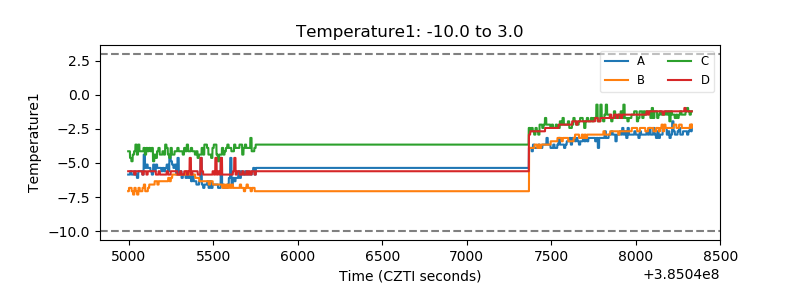 |
| Veto HV Monitor | 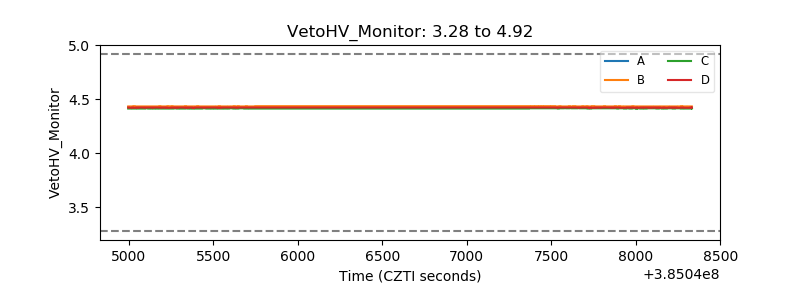 |
| Veto LLD | 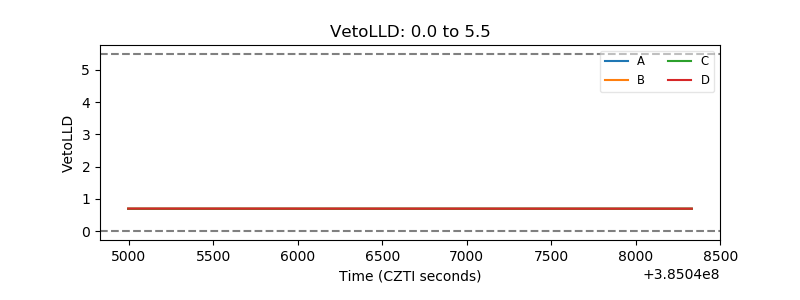 |
| Alpha Counter | 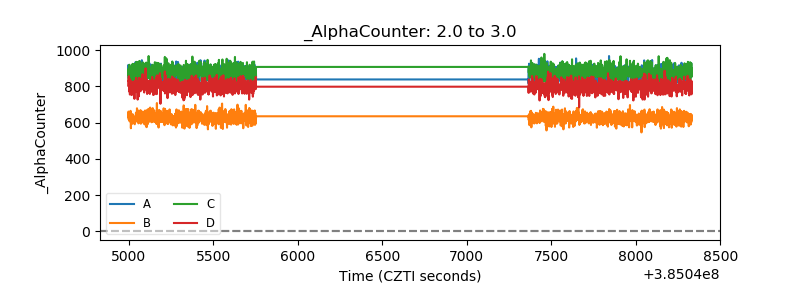 |
| _CPM_Rate | 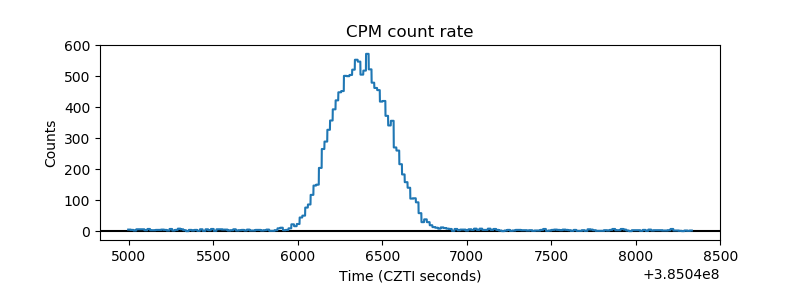 |
| CZT Counter | 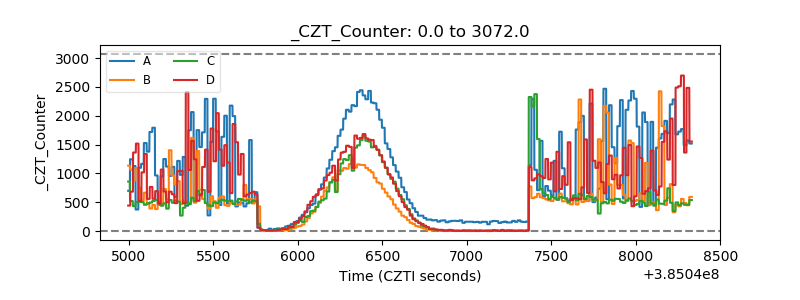 |
| +2.5 Volts monitor | 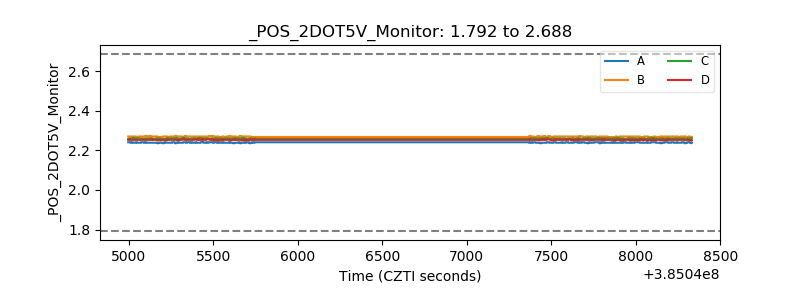 |
| +5 Volts monitor | 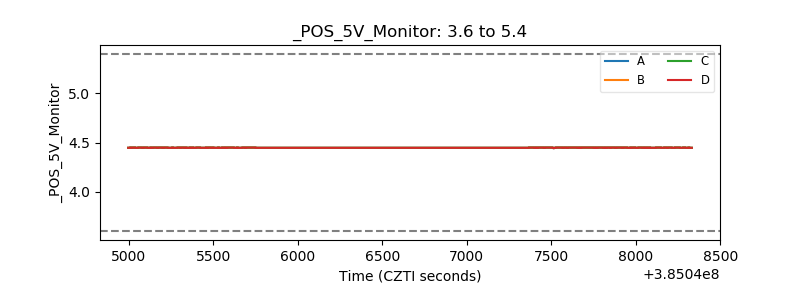 |
| _ROLL_ROT | 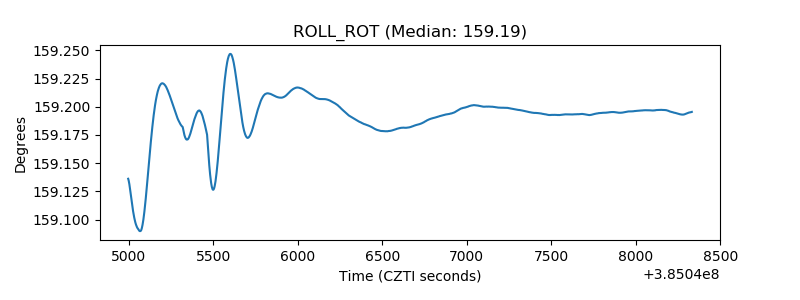 |
| _Roll_DEC | 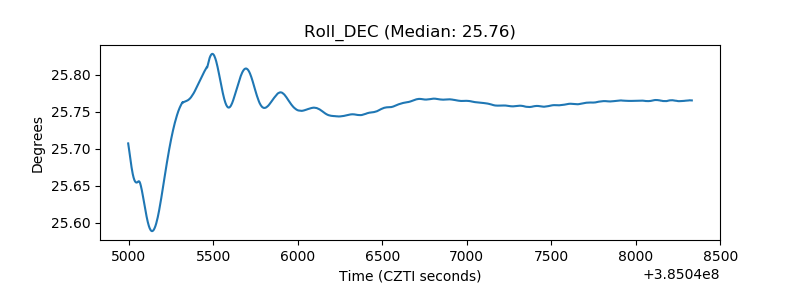 |
| _Roll_RA | 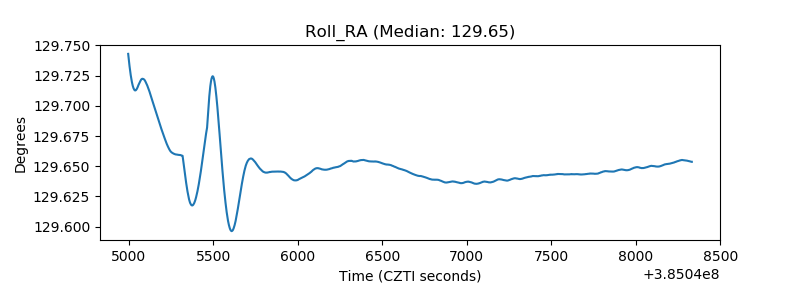 |
| Veto Counter | 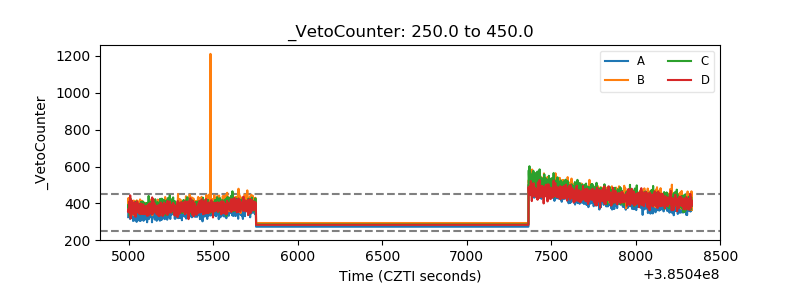 |