| Param | Original file | Final file |
|---|---|---|
| Filename | modeM0/AS1A11_047T09_9000005010_34971cztM0_level2.evt | modeM0/AS1A11_047T09_9000005010_34971cztM0_level2_quad_clean.evt |
| Size (bytes) | 422,582,400 | 83,249,280 |
| Size | 403.0 MB | 79.4 MB |
| Events in quadrant A | 2,587,406 | 556,539 |
| Events in quadrant B | 2,767,242 | 559,164 |
| Events in quadrant C | 2,842,607 | 539,817 |
| Events in quadrant D | 4,248,997 | 502,440 |
| Mode SS | |||
|---|---|---|---|
| Quadrant | BADHDUFLAG | Total packets | Discarded packets |
| A | 0 | 106 | 0 |
| B | 0 | 106 | 0 |
| C | 0 | 106 | 0 |
| D | 0 | 106 | 0 |
| Mode M0 | |||
|---|---|---|---|
| Quadrant | BADHDUFLAG | Total packets | Discarded packets |
| A | 0 | 10943 | 3 |
| B | 0 | 11317 | 2 |
| C | 0 | 11391 | 2 |
| D | 0 | 16122 | 2 |
| Mode M9 | |||
|---|---|---|---|
| Quadrant | BADHDUFLAG | Total packets | Discarded packets |
| A | 0 | 37 | 0 |
| B | 0 | 37 | 0 |
| C | 0 | 37 | 0 |
| D | 0 | 38 | 0 |
| Quadrant | Total seconds | Saturated seconds | Saturation percentage |
|---|---|---|---|
| A | 5178 | 8 | 0.154500% |
| B | 5178 | 42 | 0.811124% |
| C | 5178 | 65 | 1.255311% |
| D | 5178 | 168 | 3.244496% |
Noise dominated data is calculated using 1-second bins in cleaned event files. If a bin has >2000 counts, and if more than 50% of those come from <1% of pixels, then it is considered to be noise-dominated and hence unusable.
| Quadrant | # 1 sec bins | Bins with >0 counts | Bins with >2000 counts | High rate bins dominated by noise | Noise dominated (total time) | Noise dominated (detector-on time) | Marked lightcurve |
|---|---|---|---|---|---|---|---|
| A | 7181 | 5179 | 0 | 0 | 0.00% | 0.00% | 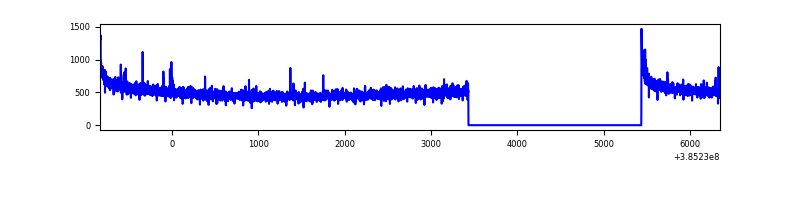 |
| B | 7181 | 5179 | 27 | 27 | 0.38% | 0.52% | 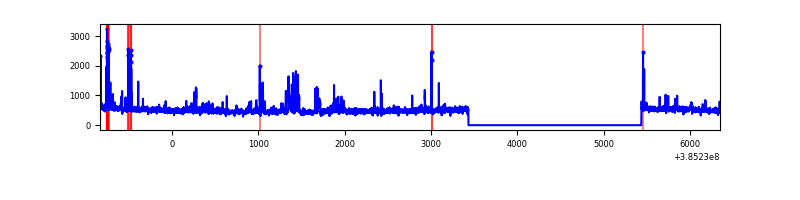 |
| C | 7181 | 5179 | 49 | 49 | 0.68% | 0.95% | 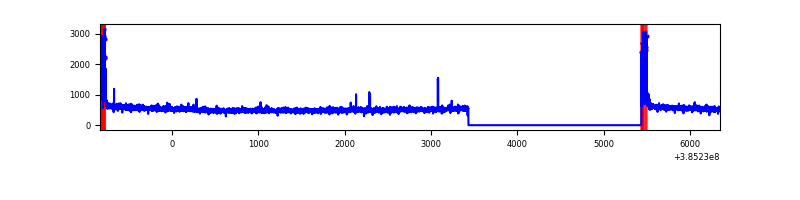 |
| D | 7181 | 5179 | 131 | 131 | 1.82% | 2.53% | 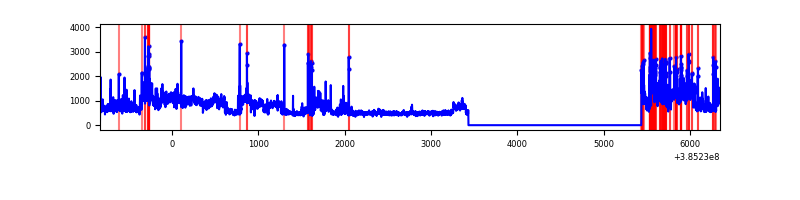 |
Top three noisy pixels from each quadrant. If the there are fewer than three noisy pixels in the level2.evt file, extra rows are filled as -1
| Pixel properties | Quadrant properties | ||||||
|---|---|---|---|---|---|---|---|
| Quadrant | DetID | PixID | Counts | Sigma | Mean | Median | Sigma |
| A | 10 | 83 | 72531 | 561.04 | 644 | 633 | 128.2 |
| A | 15 | 223 | 10042 | 73.42 | 644 | 633 | 128.2 |
| A | 13 | 254 | 8849 | 64.11 | 644 | 633 | 128.2 |
| B | 5 | 172 | 210976 | 1757.42 | 635 | 620 | 119.7 |
| B | 3 | 112 | 46691 | 384.9 | 635 | 620 | 119.7 |
| B | 12 | 111 | 14054 | 112.23 | 635 | 620 | 119.7 |
| C | 15 | 214 | 216092 | 1499.84 | 622 | 626 | 143.7 |
| C | 0 | 10 | 164667 | 1141.87 | 622 | 626 | 143.7 |
| C | 14 | 67 | 21924 | 148.25 | 622 | 626 | 143.7 |
| D | 8 | 195 | 1198582 | 7971.33 | 620 | 604 | 150.3 |
| D | 1 | 47 | 136892 | 906.86 | 620 | 604 | 150.3 |
| D | 13 | 249 | 125943 | 834.0 | 620 | 604 | 150.3 |
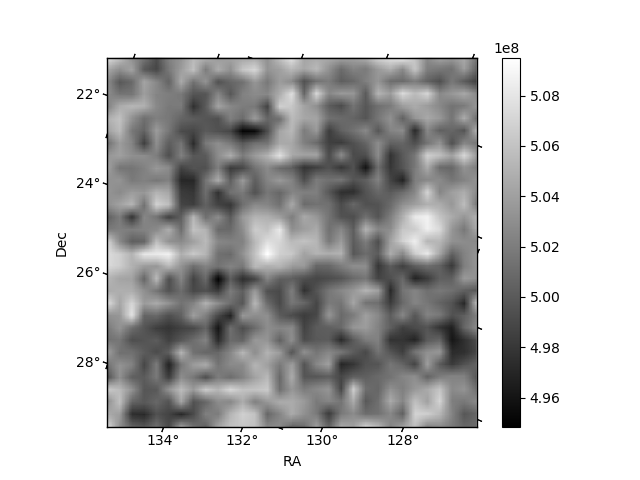
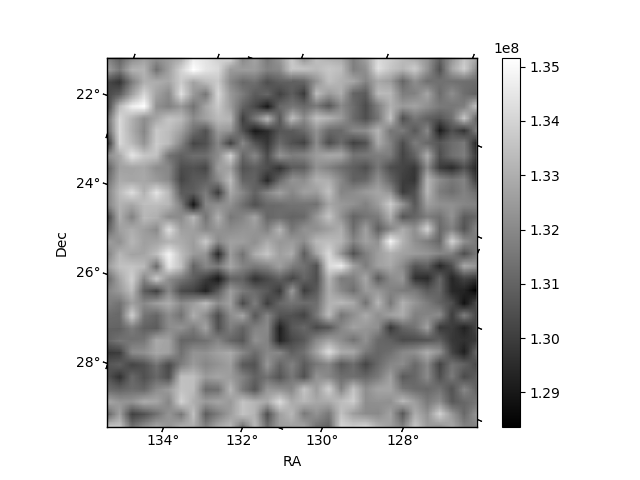
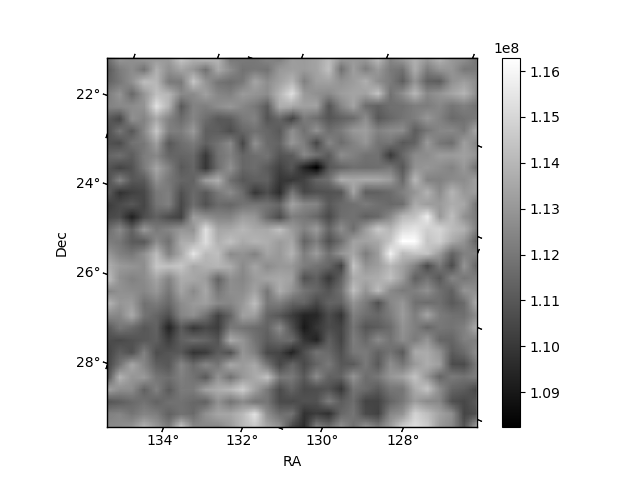
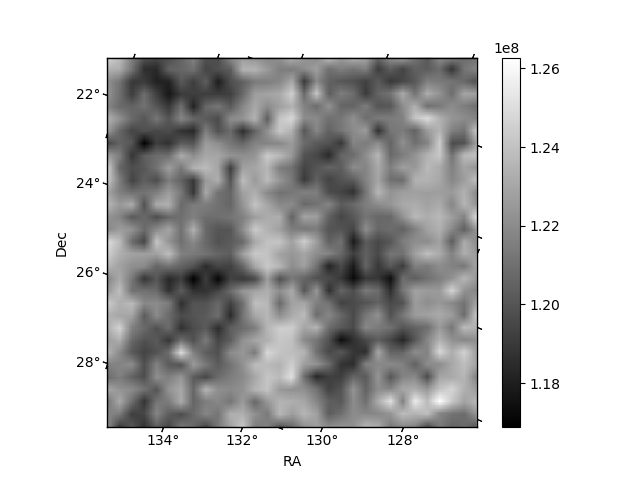
Histogram calculated using DETX and DETY for each event in the final _common_clean file
| Quadrant A | 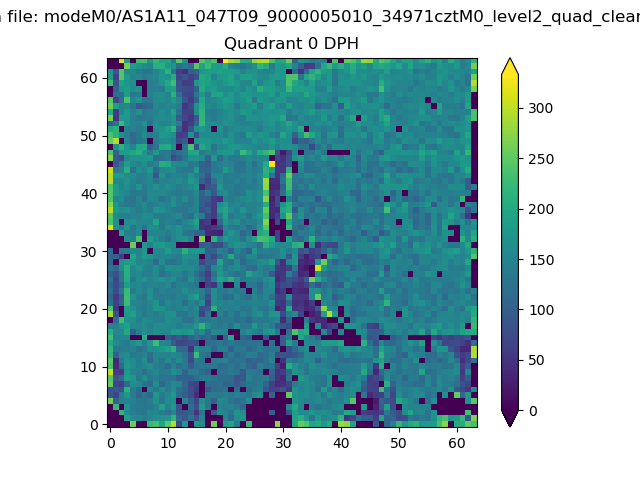 |
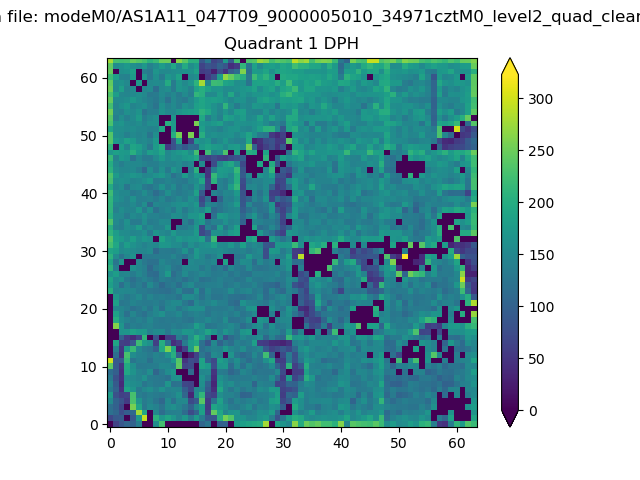 |
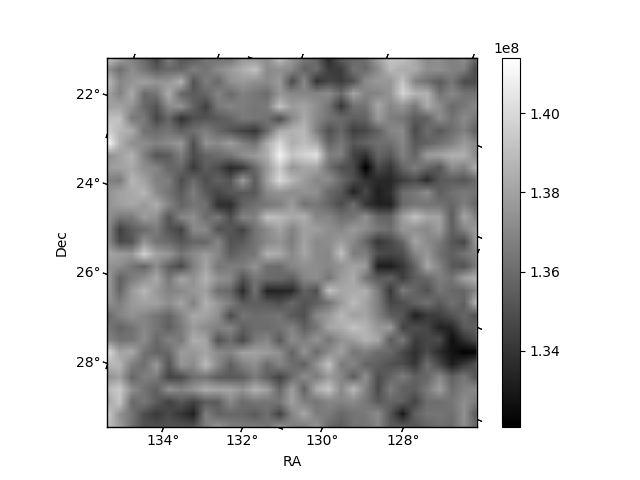
Quadrant B |
|---|---|---|---|
| Quadrant D | 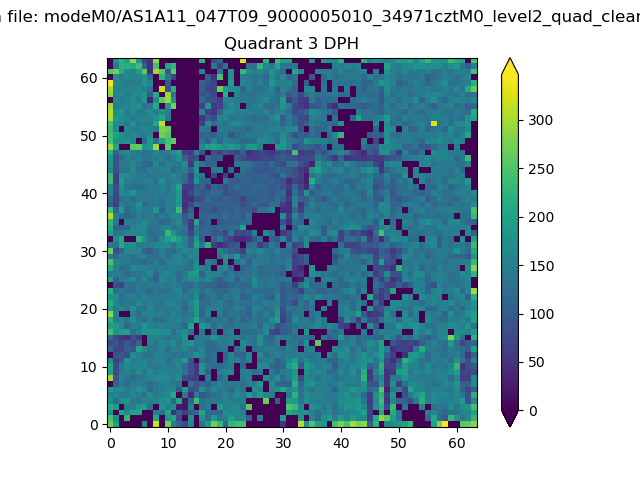 |
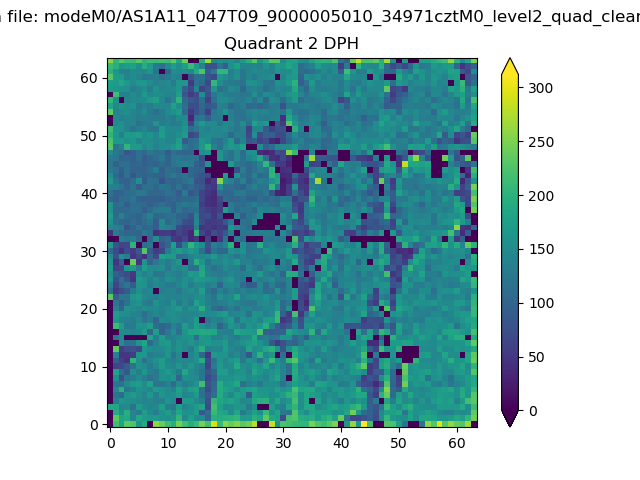 |
Quadrant C |
| Plot type | Count rate plots | Images |
|---|---|---|
| Comparison with Poisson distribution Blue bars denote a histogram of data divided into 1 sec bins. Red curve is a Poisson curve with rate = median count rate of data. |
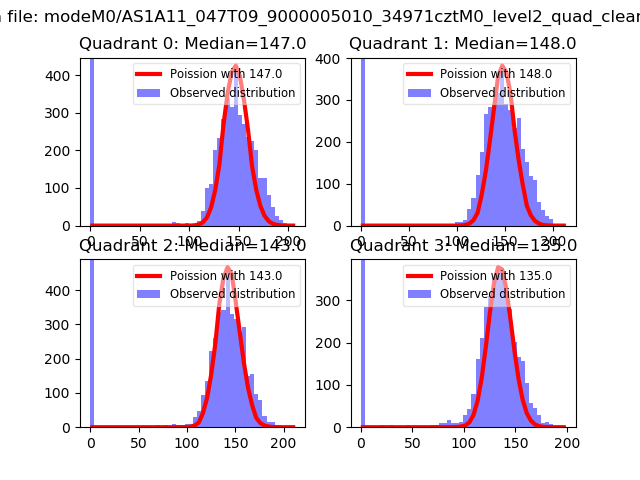 |
 |
| Quadrant-wise count rates Data is divided into 100 sec bins |
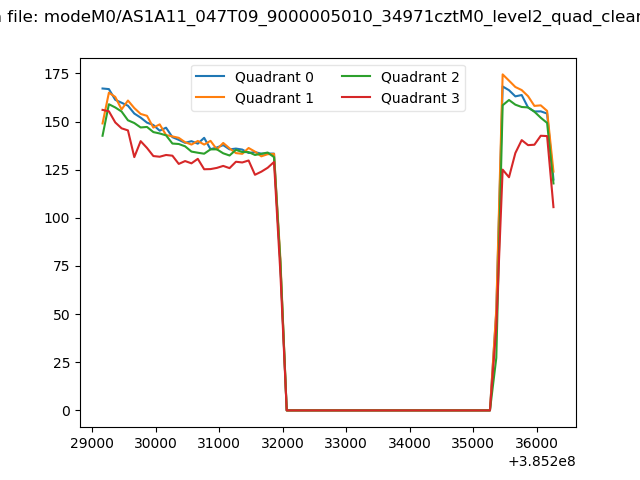 |
|
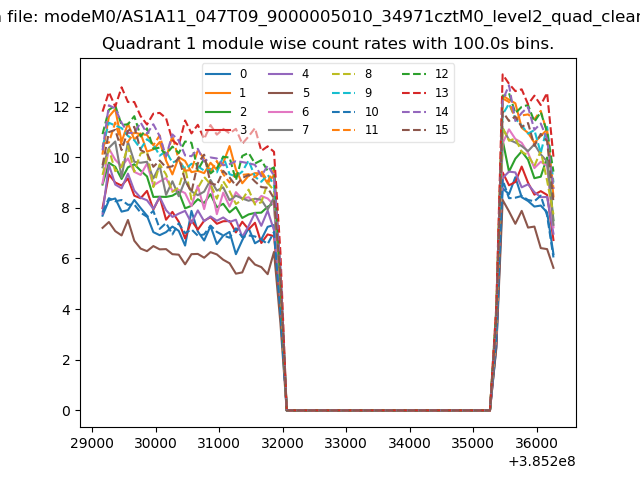
| Module-wise count rates for Quadrant A Data is divided into 100 sec bins |
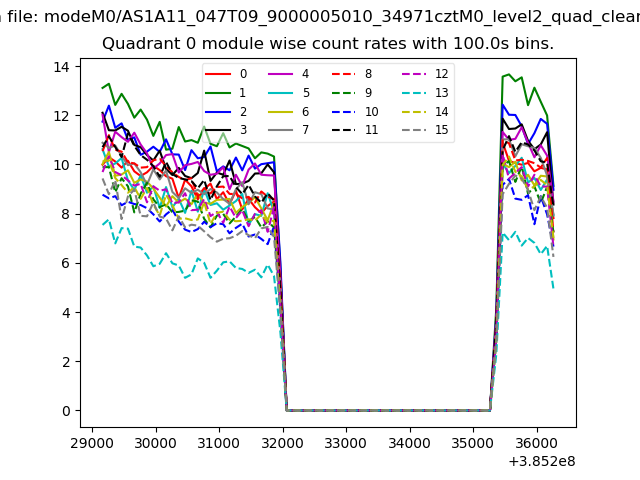 |
 |
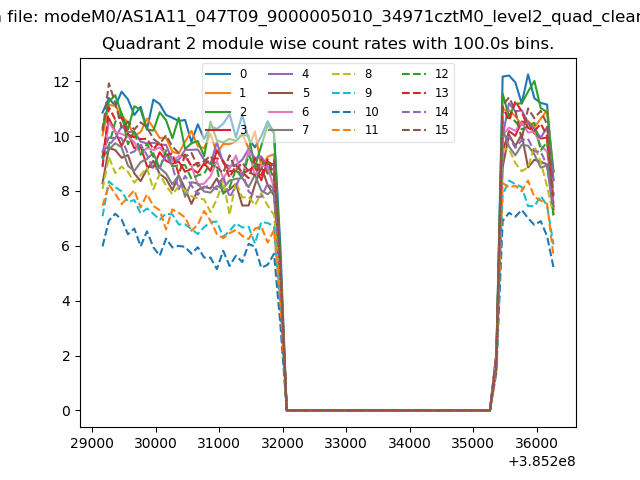
| Module-wise count rates for Quadrant B Data is divided into 100 sec bins |
 |
 |
| Module-wise count rates for Quadrant C Data is divided into 100 sec bins |
 |
 |
| Module-wise count rates for Quadrant D Data is divided into 100 sec bins |
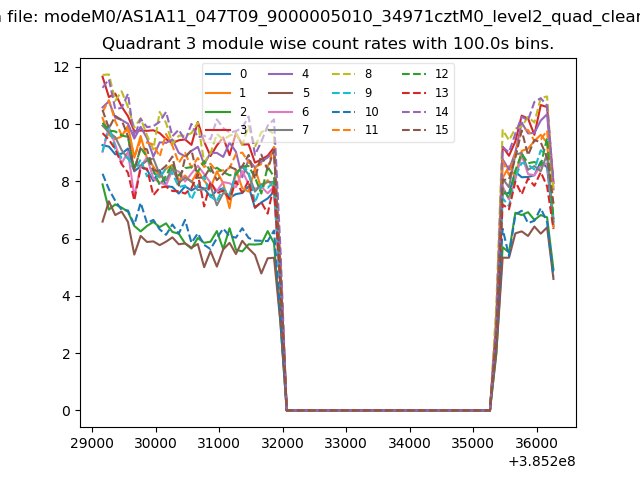 |
 |
| Parameter | Plot |
|---|---|
| CZT HV Monitor | 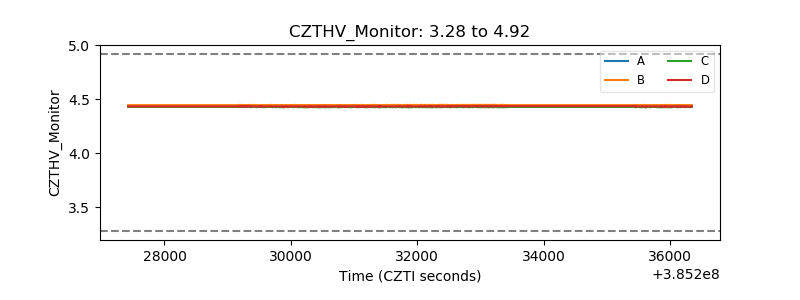 |
| D_VDD | 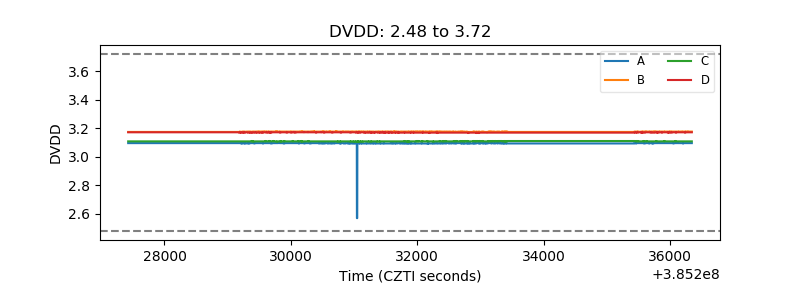 |
| Temperature 1 | 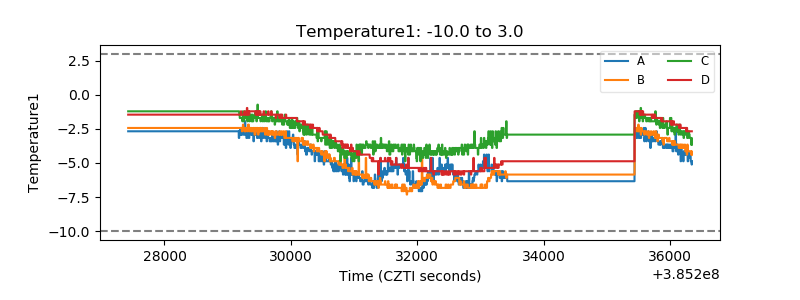 |
| Veto HV Monitor | 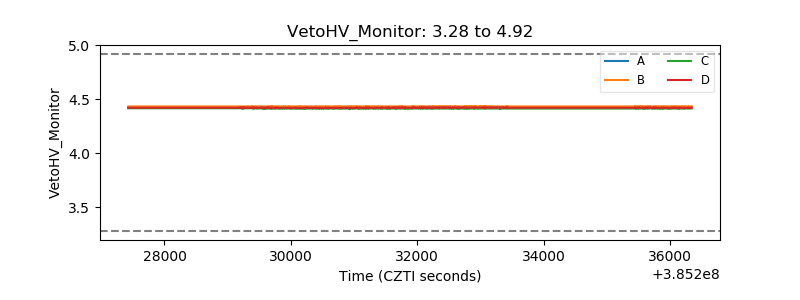 |
| Veto LLD | 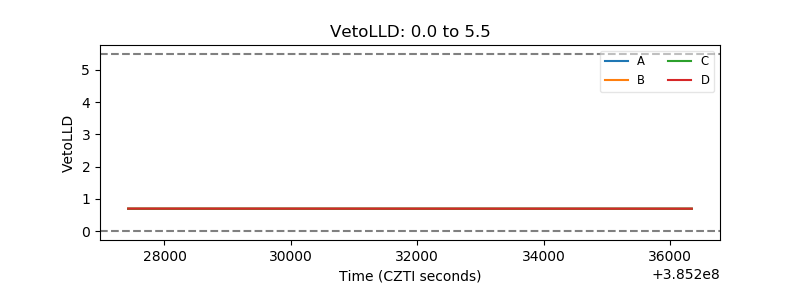 |
| Alpha Counter | 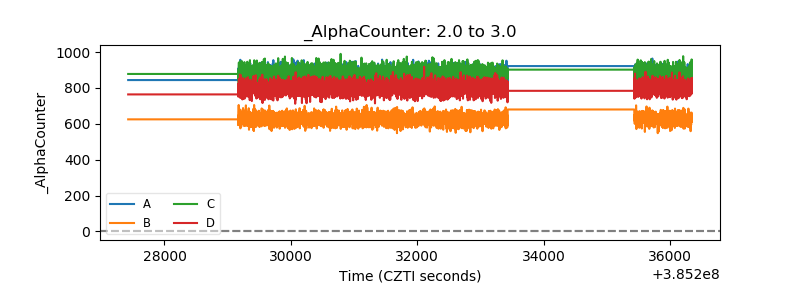 |
| _CPM_Rate | 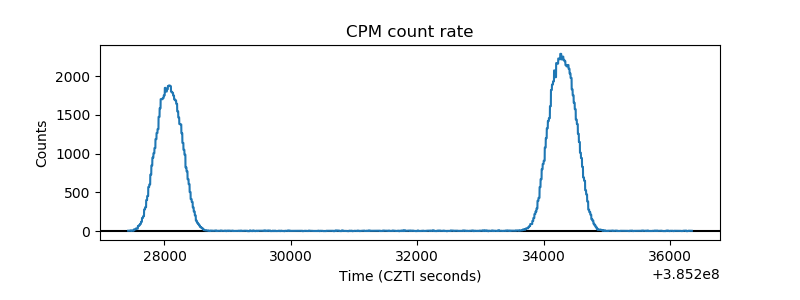 |
| CZT Counter | 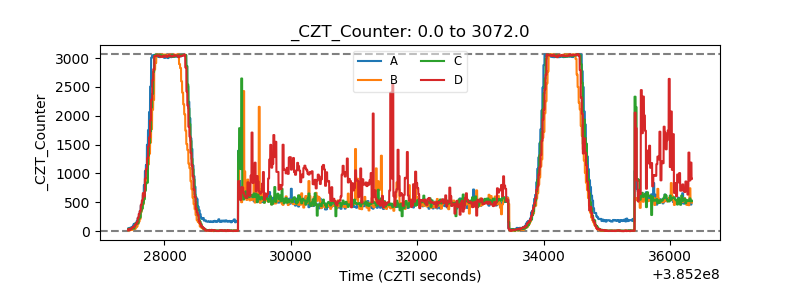 |
| +2.5 Volts monitor | 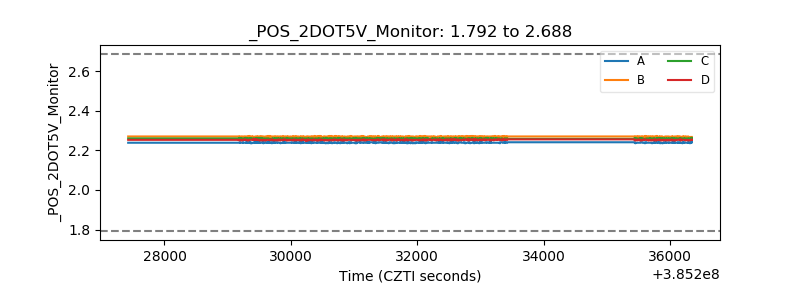 |
| +5 Volts monitor | 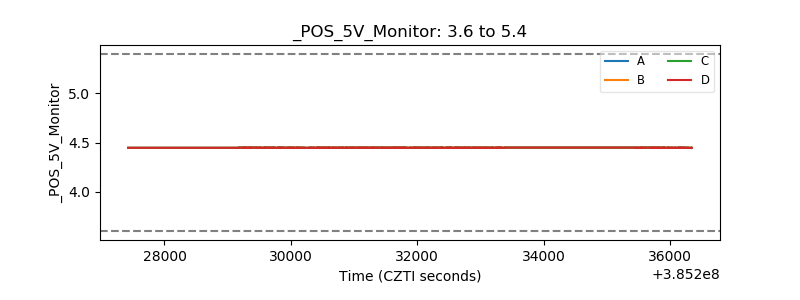 |
| _ROLL_ROT | 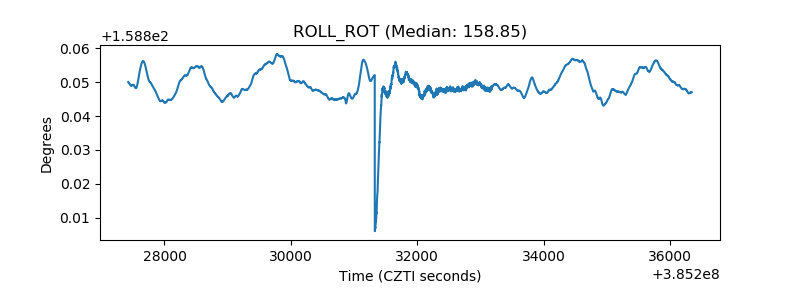 |
| _Roll_DEC | 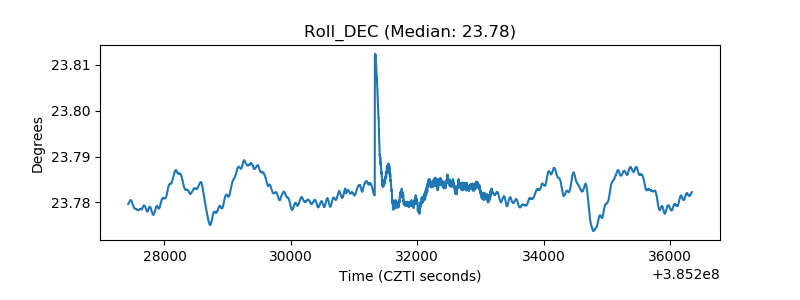 |
| _Roll_RA | 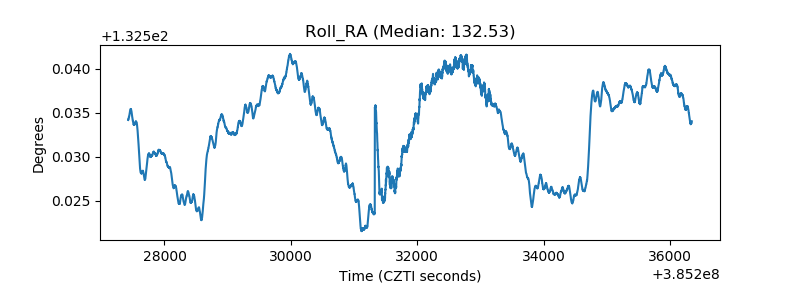 |
| Veto Counter | 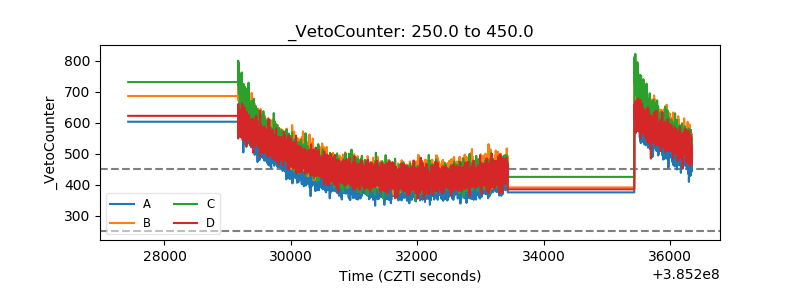 |