| Param | Original file | Final file |
|---|---|---|
| Filename | modeM0/AS1A11_047T09_9000005010_34970cztM0_level2.evt | modeM0/AS1A11_047T09_9000005010_34970cztM0_level2_quad_clean.evt |
| Size (bytes) | 466,015,680 | 88,614,720 |
| Size | 444.4 MB | 84.5 MB |
| Events in quadrant A | 2,643,754 | 599,521 |
| Events in quadrant B | 3,539,263 | 580,515 |
| Events in quadrant C | 2,923,496 | 581,133 |
| Events in quadrant D | 4,642,895 | 546,854 |
| Mode SS | |||
|---|---|---|---|
| Quadrant | BADHDUFLAG | Total packets | Discarded packets |
| A | 0 | 110 | 0 |
| B | 0 | 110 | 0 |
| C | 0 | 110 | 0 |
| D | 0 | 110 | 0 |
| Mode M0 | |||
|---|---|---|---|
| Quadrant | BADHDUFLAG | Total packets | Discarded packets |
| A | 0 | 11308 | 3 |
| B | 0 | 13840 | 2 |
| C | 0 | 11851 | 2 |
| D | 0 | 17487 | 2 |
| Mode M9 | |||
|---|---|---|---|
| Quadrant | BADHDUFLAG | Total packets | Discarded packets |
| A | 0 | 20 | 0 |
| B | 0 | 20 | 0 |
| C | 0 | 20 | 0 |
| D | 0 | 21 | 0 |
| Quadrant | Total seconds | Saturated seconds | Saturation percentage |
|---|---|---|---|
| A | 5359 | 9 | 0.167942% |
| B | 5359 | 332 | 6.195186% |
| C | 5359 | 66 | 1.231573% |
| D | 5359 | 225 | 4.198545% |
Noise dominated data is calculated using 1-second bins in cleaned event files. If a bin has >2000 counts, and if more than 50% of those come from <1% of pixels, then it is considered to be noise-dominated and hence unusable.
| Quadrant | # 1 sec bins | Bins with >0 counts | Bins with >2000 counts | High rate bins dominated by noise | Noise dominated (total time) | Noise dominated (detector-on time) | Marked lightcurve |
|---|---|---|---|---|---|---|---|
| A | 7242 | 5360 | 0 | 0 | 0.00% | 0.00% | 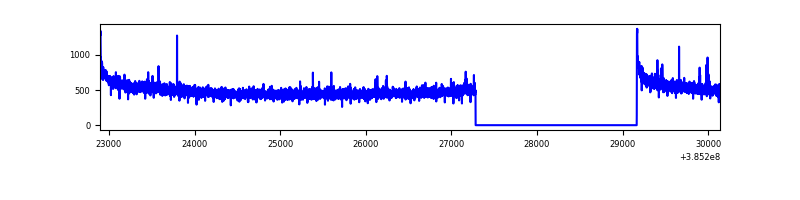 |
| B | 7242 | 5360 | 258 | 258 | 3.56% | 4.81% | 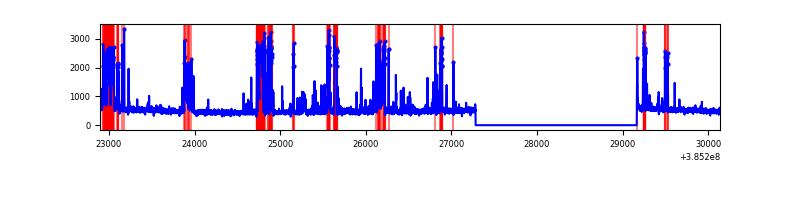 |
| C | 7242 | 5360 | 51 | 51 | 0.70% | 0.95% | 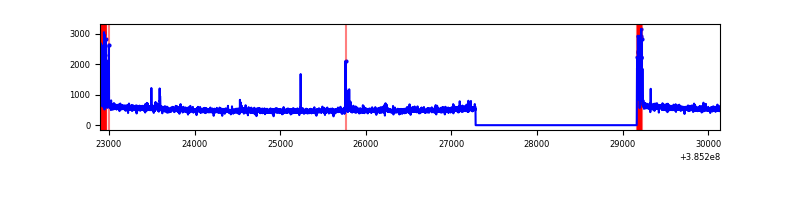 |
| D | 7242 | 5360 | 191 | 191 | 2.64% | 3.56% | 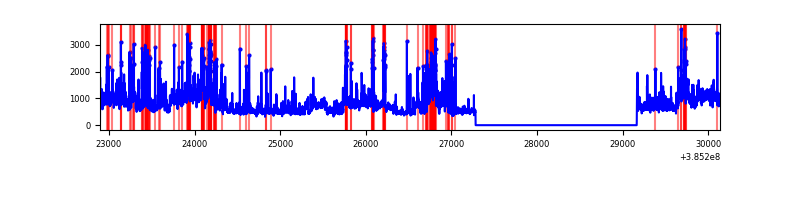 |
Top three noisy pixels from each quadrant. If the there are fewer than three noisy pixels in the level2.evt file, extra rows are filled as -1
| Pixel properties | Quadrant properties | ||||||
|---|---|---|---|---|---|---|---|
| Quadrant | DetID | PixID | Counts | Sigma | Mean | Median | Sigma |
| A | 10 | 83 | 72860 | 549.88 | 657 | 645 | 131.3 |
| A | 15 | 223 | 12928 | 93.53 | 657 | 645 | 131.3 |
| A | 13 | 6 | 12708 | 91.85 | 657 | 645 | 131.3 |
| B | 5 | 172 | 932743 | 7683.82 | 630 | 614 | 121.3 |
| B | 0 | 155 | 83791 | 685.65 | 630 | 614 | 121.3 |
| B | 0 | 190 | 20757 | 166.04 | 630 | 614 | 121.3 |
| C | 15 | 214 | 224457 | 1532.31 | 632 | 637 | 146.1 |
| C | 0 | 10 | 182440 | 1244.65 | 632 | 637 | 146.1 |
| C | 0 | 207 | 18142 | 119.84 | 632 | 637 | 146.1 |
| D | 8 | 195 | 1199049 | 7845.06 | 632 | 616 | 152.8 |
| D | 13 | 249 | 350158 | 2288.14 | 632 | 616 | 152.8 |
| D | 1 | 47 | 160713 | 1048.01 | 632 | 616 | 152.8 |
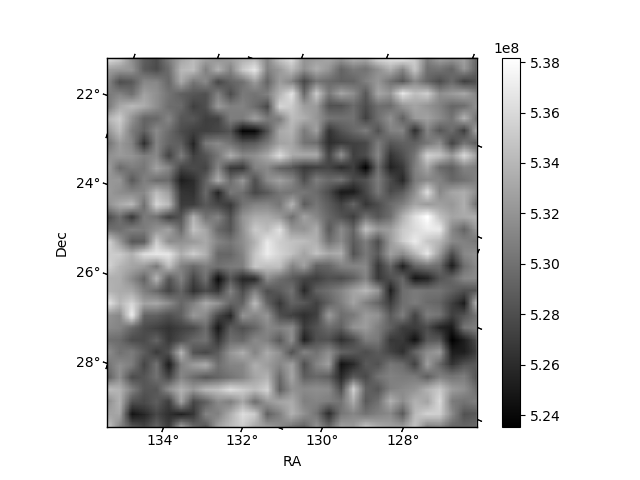
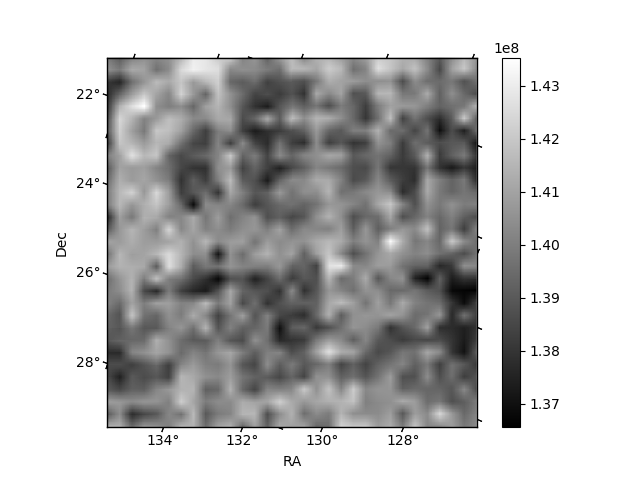
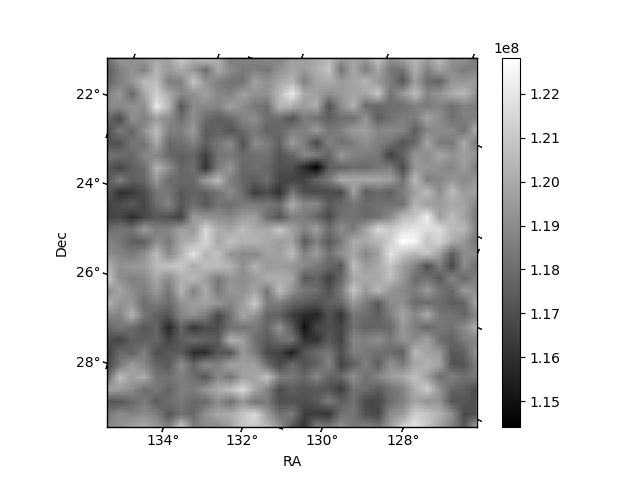
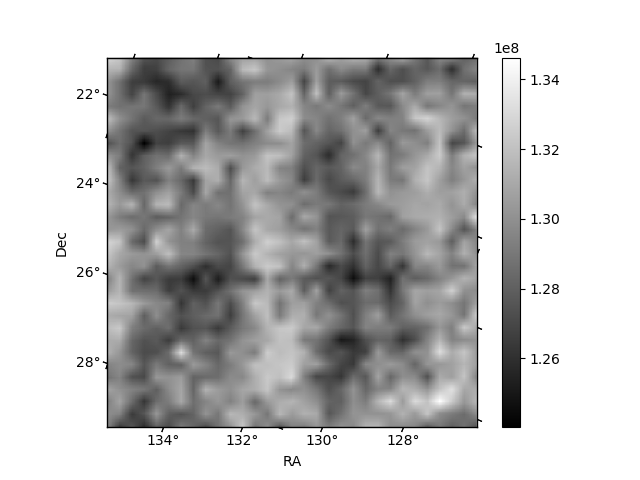
Histogram calculated using DETX and DETY for each event in the final _common_clean file
| Quadrant A | 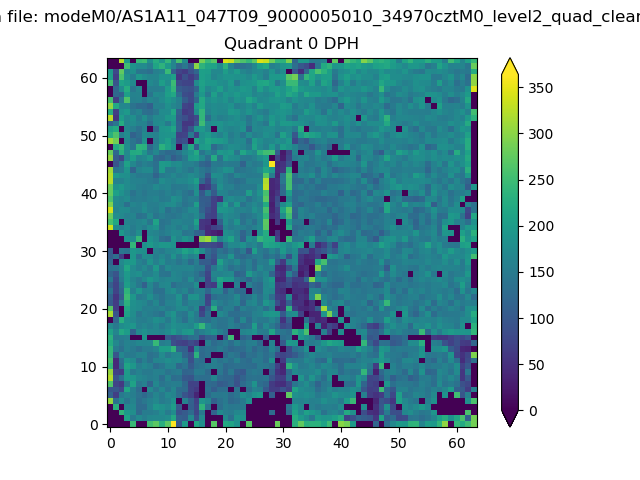 |
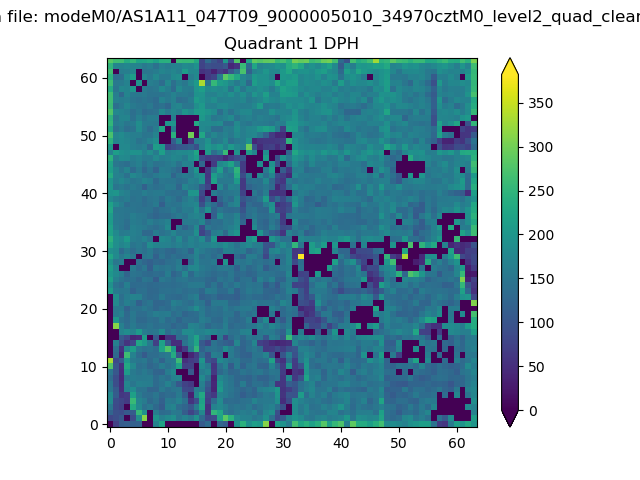 |
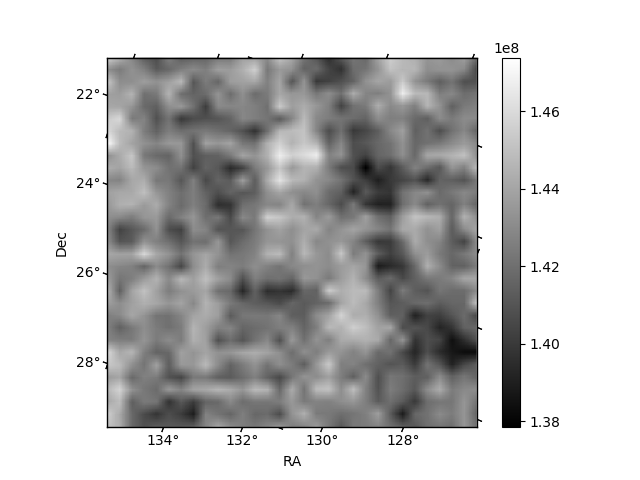
Quadrant B |
|---|---|---|---|
| Quadrant D | 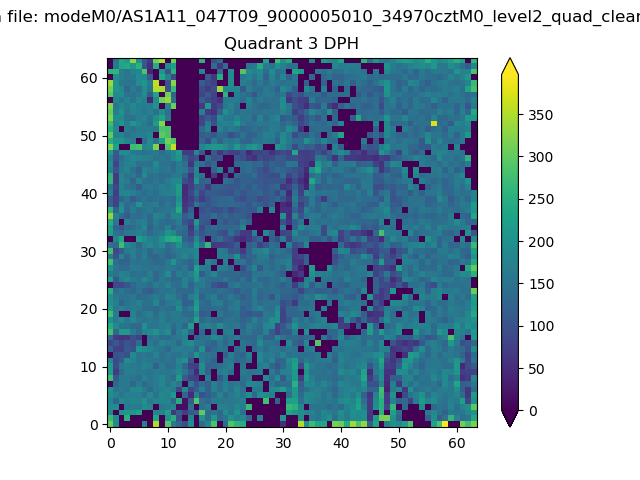 |
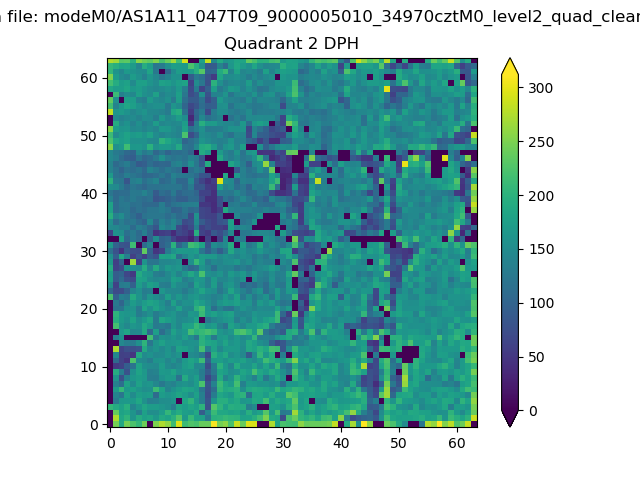 |
Quadrant C |
| Plot type | Count rate plots | Images |
|---|---|---|
| Comparison with Poisson distribution Blue bars denote a histogram of data divided into 1 sec bins. Red curve is a Poisson curve with rate = median count rate of data. |
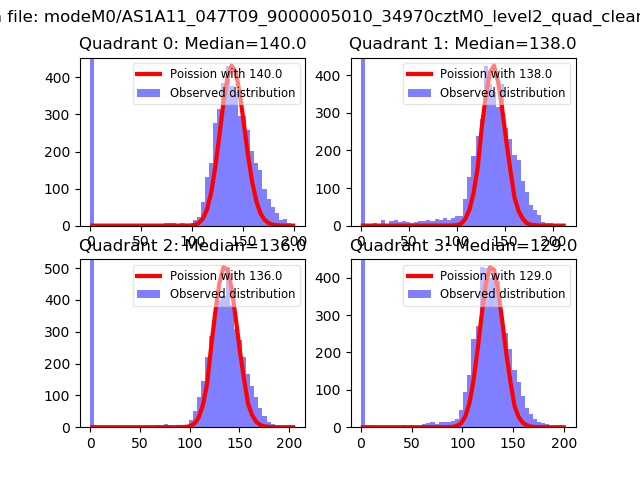 |
 |
| Quadrant-wise count rates Data is divided into 100 sec bins |
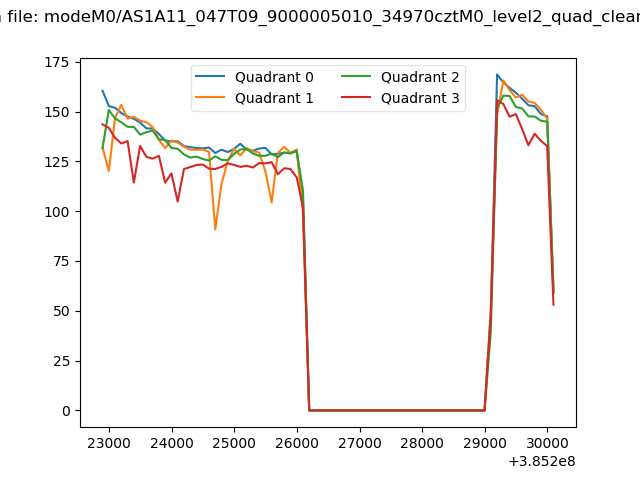 |
|
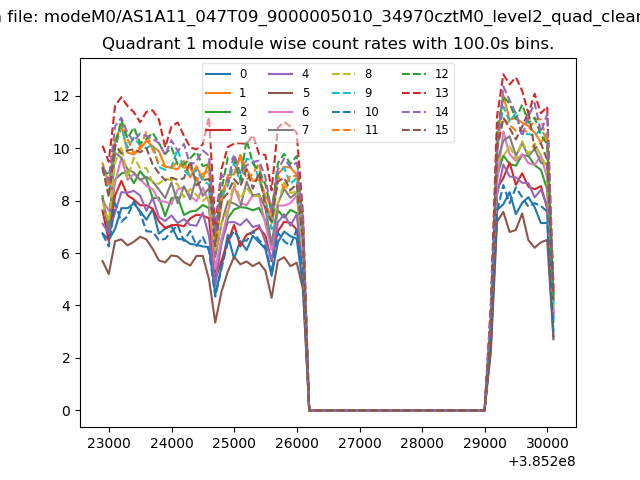
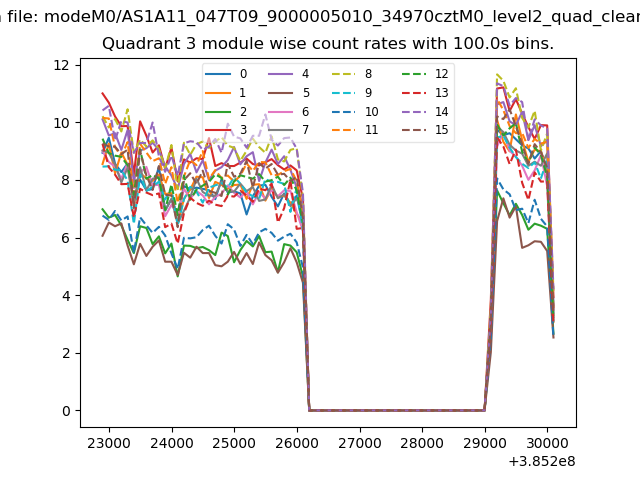
| Module-wise count rates for Quadrant A Data is divided into 100 sec bins |
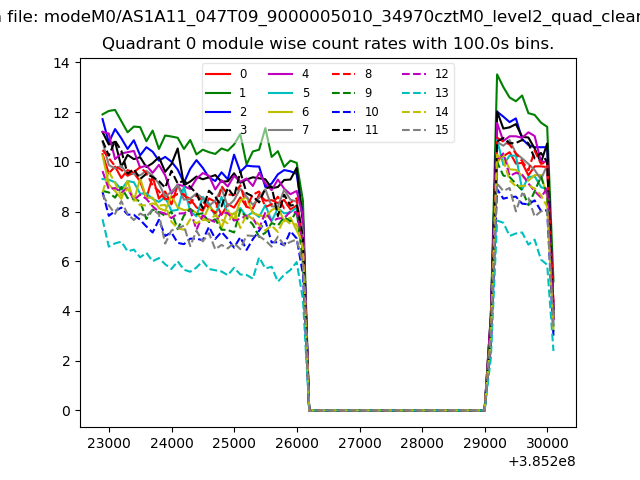 |
 |
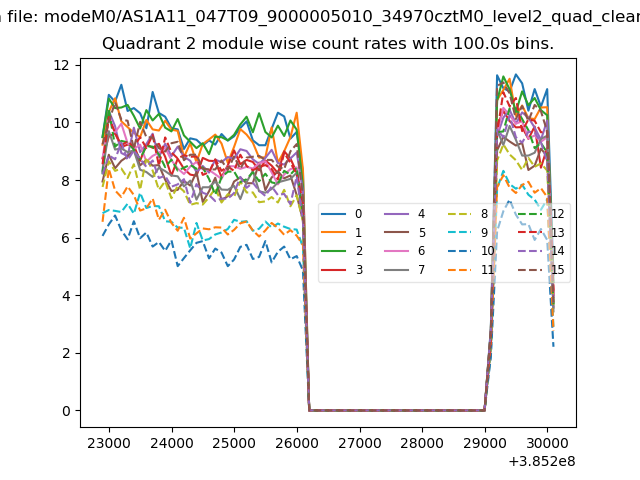
| Module-wise count rates for Quadrant B Data is divided into 100 sec bins |
 |
 |
| Module-wise count rates for Quadrant C Data is divided into 100 sec bins |
 |
 |
| Module-wise count rates for Quadrant D Data is divided into 100 sec bins |
 |
 |
| Parameter | Plot |
|---|---|
| CZT HV Monitor | 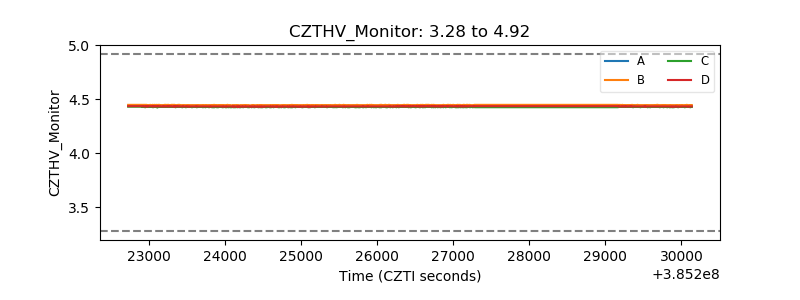 |
| D_VDD | 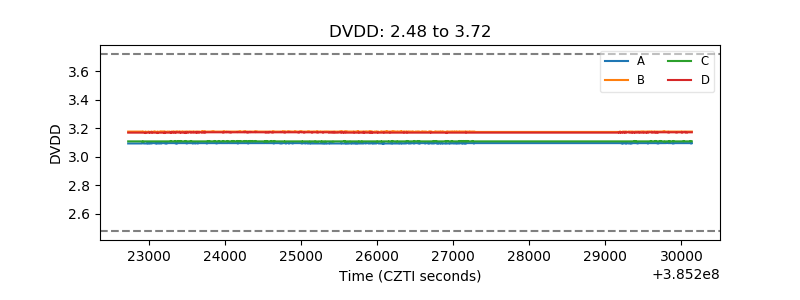 |
| Temperature 1 | 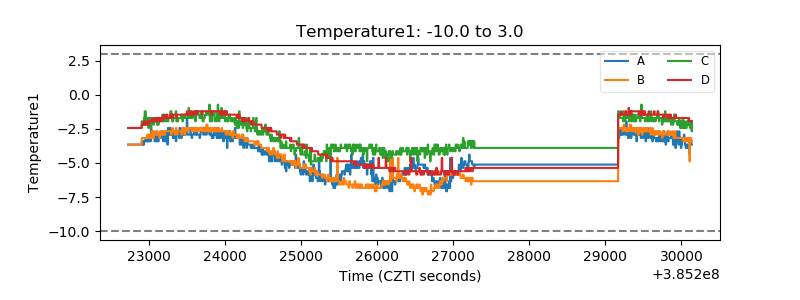 |
| Veto HV Monitor | 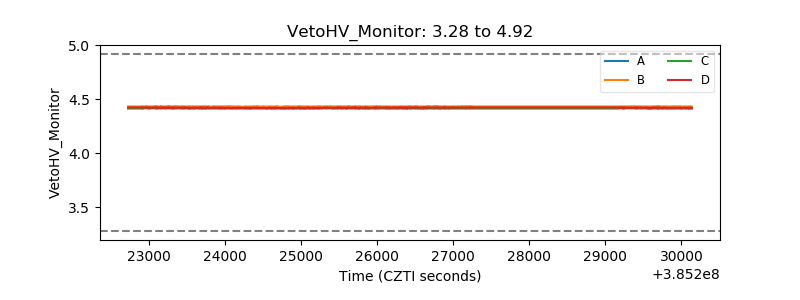 |
| Veto LLD | 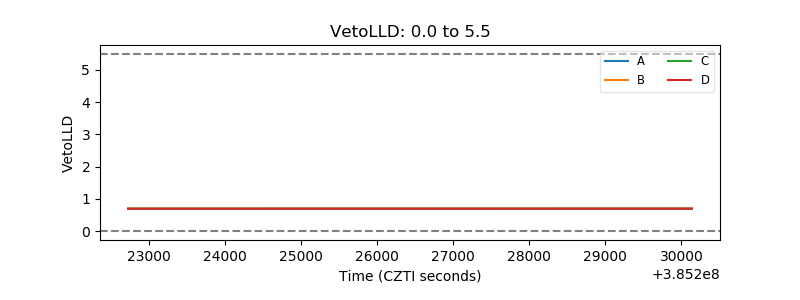 |
| Alpha Counter | 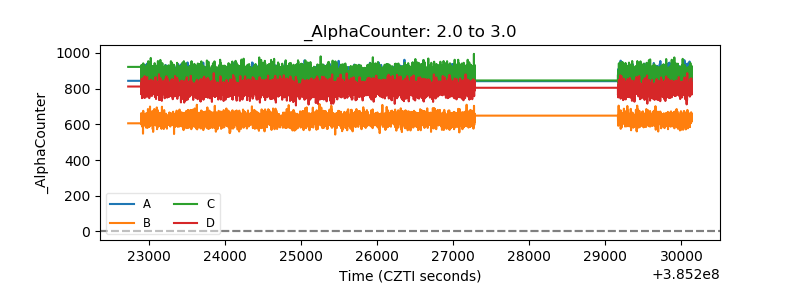 |
| _CPM_Rate | 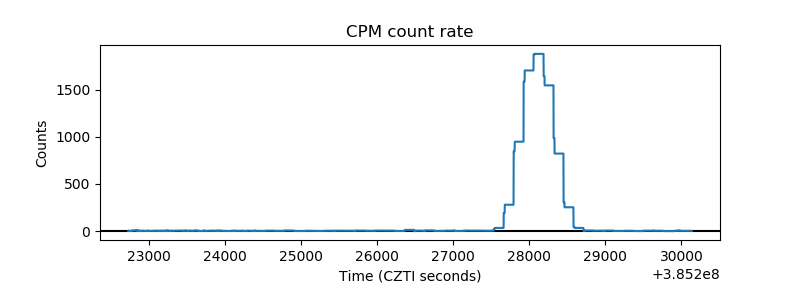 |
| CZT Counter | 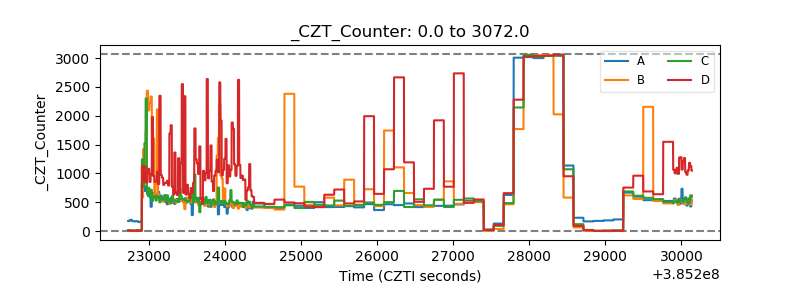 |
| +2.5 Volts monitor | 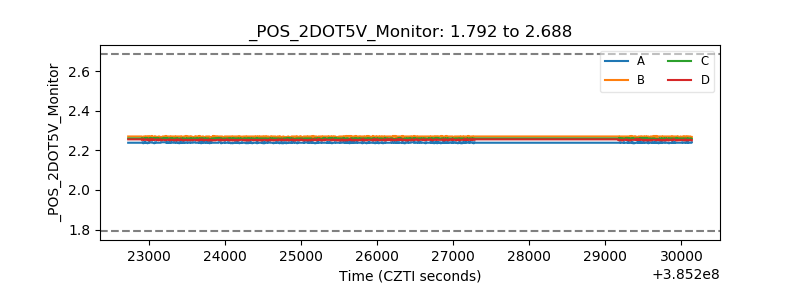 |
| +5 Volts monitor | 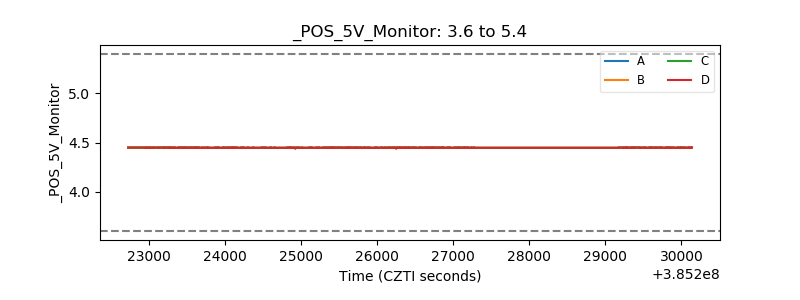 |
| _ROLL_ROT | 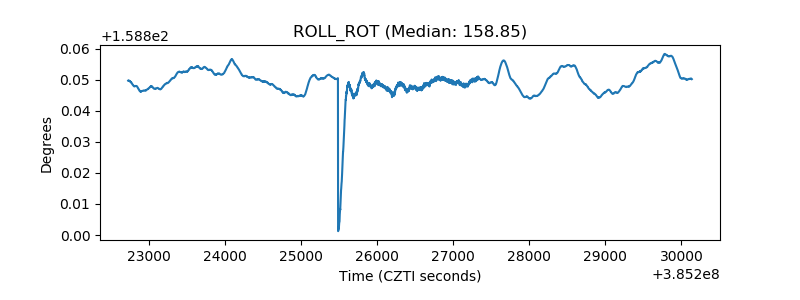 |
| _Roll_DEC | 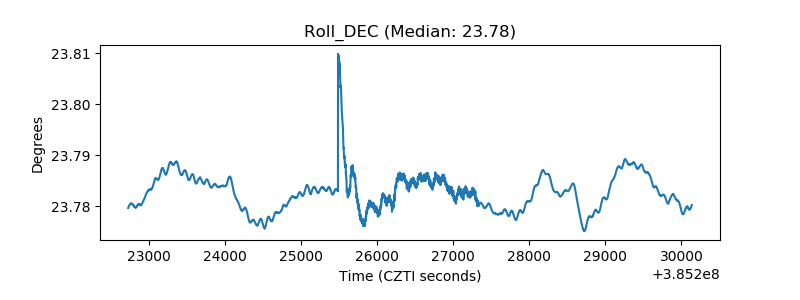 |
| _Roll_RA | 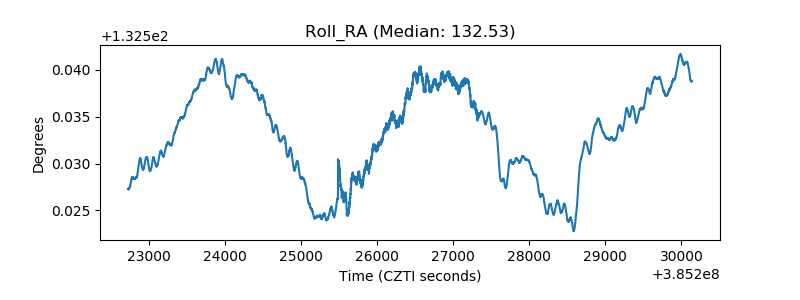 |
| Veto Counter |  |