| Param | Original file | Final file |
|---|---|---|
| Filename | modeM0/AS1A11_047T09_9000005010_34969cztM0_level2.evt | modeM0/AS1A11_047T09_9000005010_34969cztM0_level2_quad_clean.evt |
| Size (bytes) | 473,757,120 | 90,192,960 |
| Size | 451.8 MB | 86.0 MB |
| Events in quadrant A | 2,665,152 | 609,780 |
| Events in quadrant B | 4,044,631 | 578,829 |
| Events in quadrant C | 2,904,820 | 594,759 |
| Events in quadrant D | 4,357,143 | 560,224 |
| Mode SS | |||
|---|---|---|---|
| Quadrant | BADHDUFLAG | Total packets | Discarded packets |
| A | 0 | 114 | 0 |
| B | 0 | 114 | 0 |
| C | 0 | 114 | 0 |
| D | 0 | 114 | 0 |
| Mode M0 | |||
|---|---|---|---|
| Quadrant | BADHDUFLAG | Total packets | Discarded packets |
| A | 0 | 11560 | 3 |
| B | 0 | 15575 | 2 |
| C | 0 | 11948 | 2 |
| D | 0 | 16746 | 2 |
| Mode M9 | |||
|---|---|---|---|
| Quadrant | BADHDUFLAG | Total packets | Discarded packets |
| A | 0 | 34 | 0 |
| B | 0 | 34 | 0 |
| C | 0 | 34 | 0 |
| D | 0 | 34 | 0 |
| Quadrant | Total seconds | Saturated seconds | Saturation percentage |
|---|---|---|---|
| A | 5542 | 11 | 0.198484% |
| B | 5542 | 517 | 9.328762% |
| C | 5542 | 45 | 0.811981% |
| D | 5542 | 137 | 2.472032% |
Noise dominated data is calculated using 1-second bins in cleaned event files. If a bin has >2000 counts, and if more than 50% of those come from <1% of pixels, then it is considered to be noise-dominated and hence unusable.
| Quadrant | # 1 sec bins | Bins with >0 counts | Bins with >2000 counts | High rate bins dominated by noise | Noise dominated (total time) | Noise dominated (detector-on time) | Marked lightcurve |
|---|---|---|---|---|---|---|---|
| A | 8888 | 5544 | 0 | 0 | 0.00% | 0.00% | 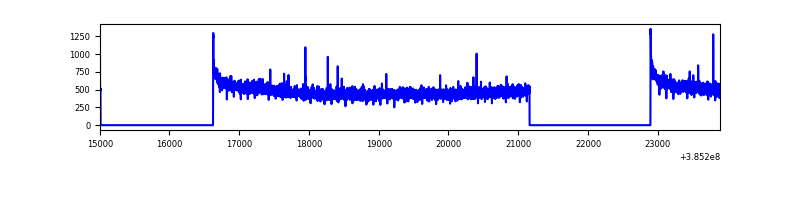 |
| B | 8888 | 5544 | 404 | 404 | 4.55% | 7.29% | 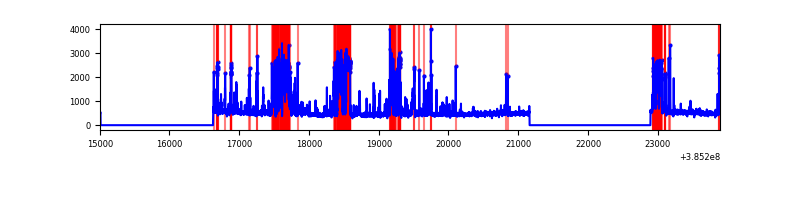 |
| C | 8888 | 5544 | 31 | 31 | 0.35% | 0.56% | 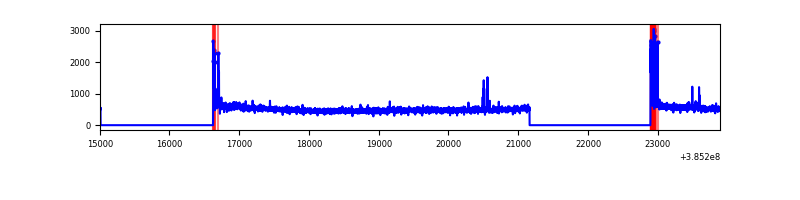 |
| D | 8888 | 5544 | 109 | 109 | 1.23% | 1.97% | 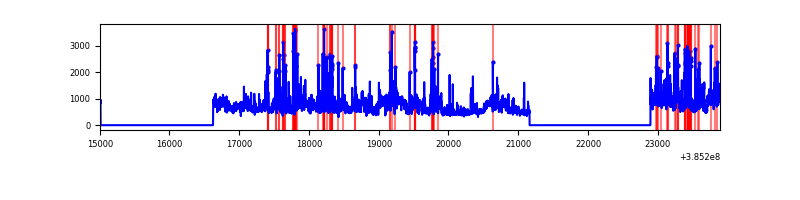 |
Top three noisy pixels from each quadrant. If the there are fewer than three noisy pixels in the level2.evt file, extra rows are filled as -1
| Pixel properties | Quadrant properties | ||||||
|---|---|---|---|---|---|---|---|
| Quadrant | DetID | PixID | Counts | Sigma | Mean | Median | Sigma |
| A | 10 | 83 | 71202 | 524.32 | 667 | 655 | 134.5 |
| A | 13 | 6 | 12435 | 87.55 | 667 | 655 | 134.5 |
| A | 13 | 254 | 9074 | 62.57 | 667 | 655 | 134.5 |
| B | 5 | 172 | 1414267 | 11640.49 | 630 | 614 | 121.4 |
| B | 0 | 190 | 67100 | 547.47 | 630 | 614 | 121.4 |
| B | 4 | 232 | 21071 | 168.45 | 630 | 614 | 121.4 |
| C | 15 | 214 | 231371 | 1540.14 | 642 | 647 | 149.8 |
| C | 0 | 10 | 135985 | 903.42 | 642 | 647 | 149.8 |
| C | 0 | 207 | 16151 | 103.49 | 642 | 647 | 149.8 |
| D | 8 | 195 | 1158025 | 7462.1 | 642 | 627 | 155.1 |
| D | 13 | 249 | 328625 | 2114.7 | 642 | 627 | 155.1 |
| D | 1 | 52 | 80274 | 513.51 | 642 | 627 | 155.1 |
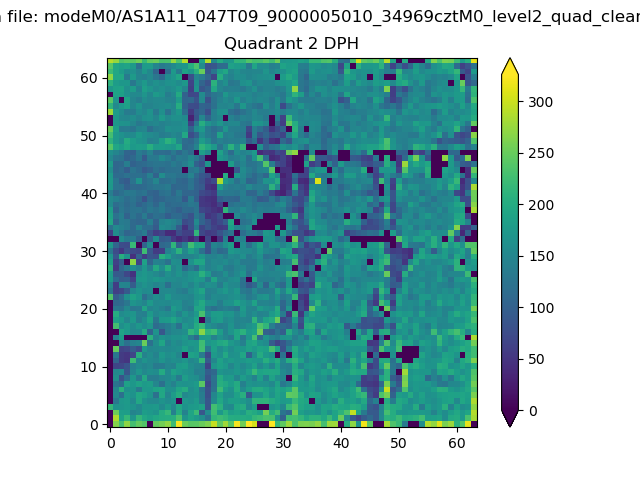
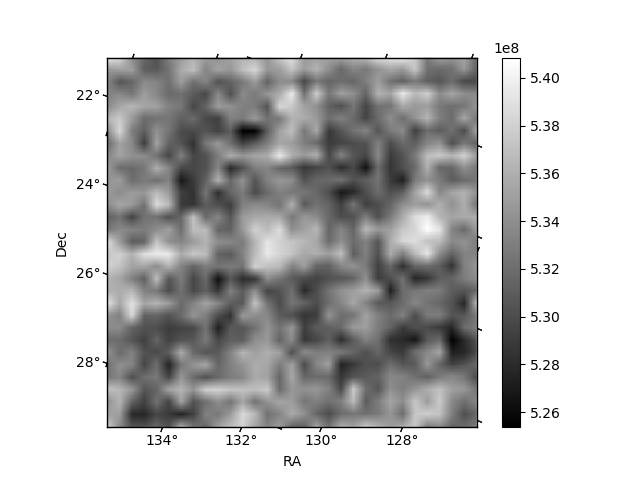
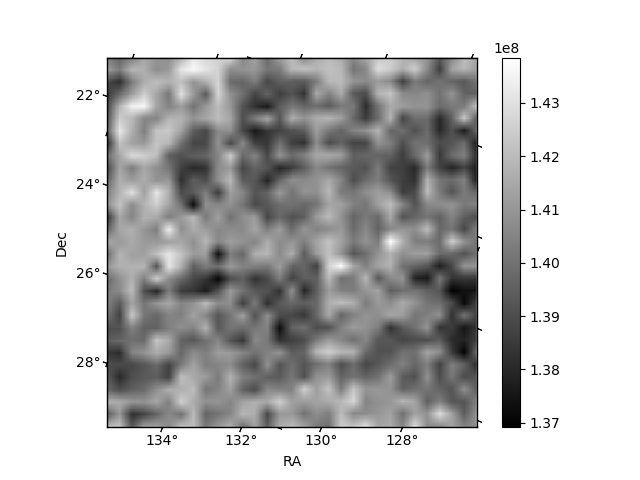
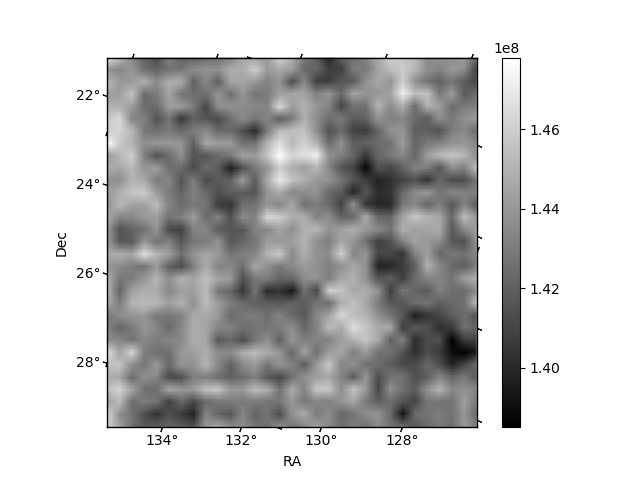
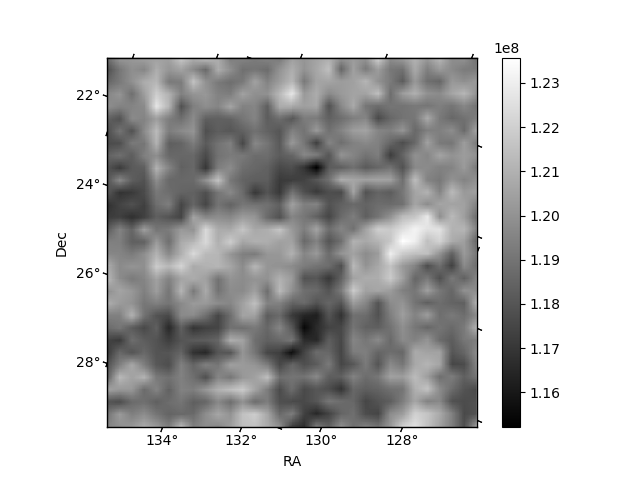
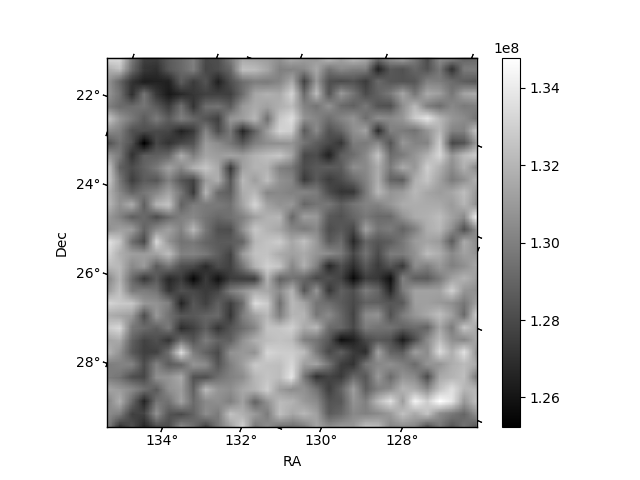
Histogram calculated using DETX and DETY for each event in the final _common_clean file
| Quadrant A | 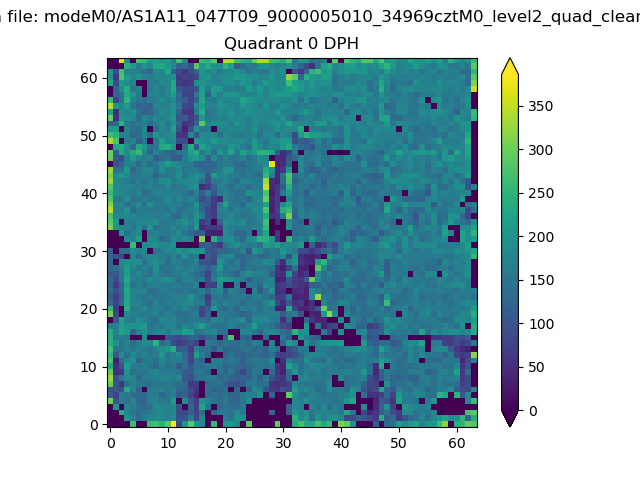 |
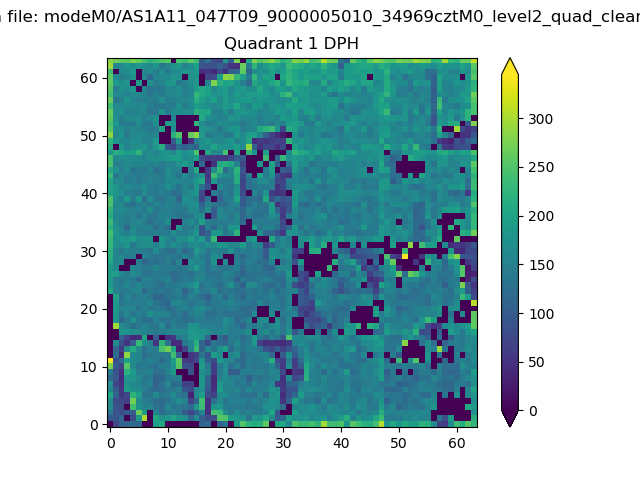 |
Quadrant B |
|---|---|---|---|
| Quadrant D | 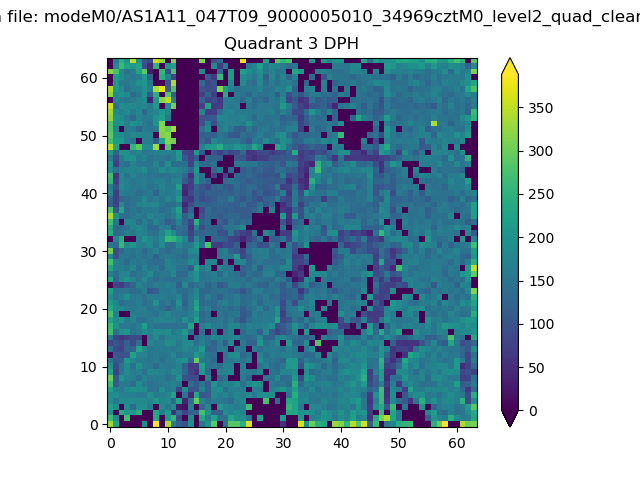 |
 |
Quadrant C |
| Plot type | Count rate plots | Images |
|---|---|---|
| Comparison with Poisson distribution Blue bars denote a histogram of data divided into 1 sec bins. Red curve is a Poisson curve with rate = median count rate of data. |
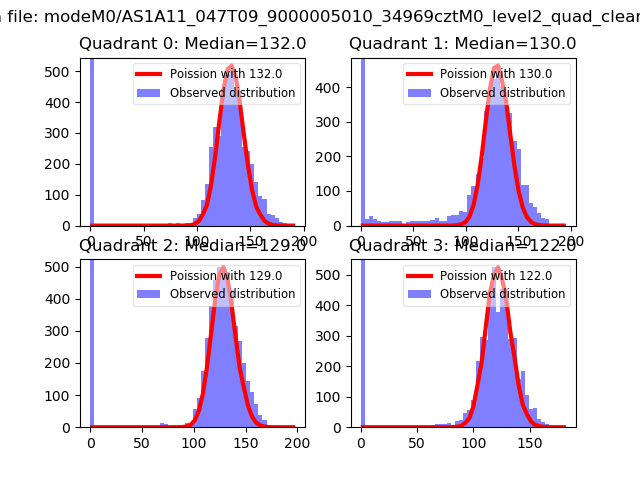 |
 |
| Quadrant-wise count rates Data is divided into 100 sec bins |
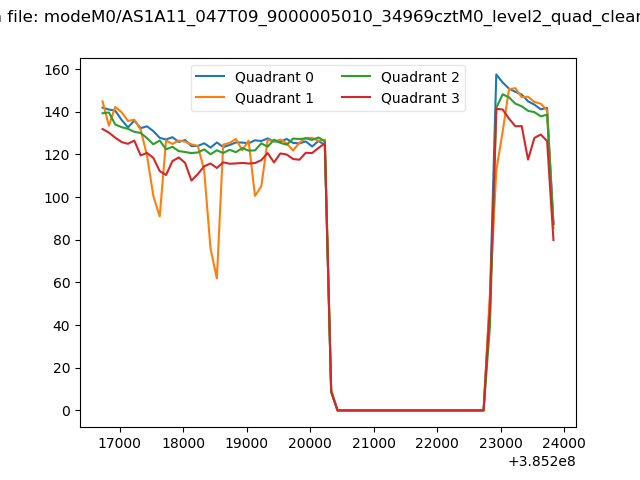 |
|
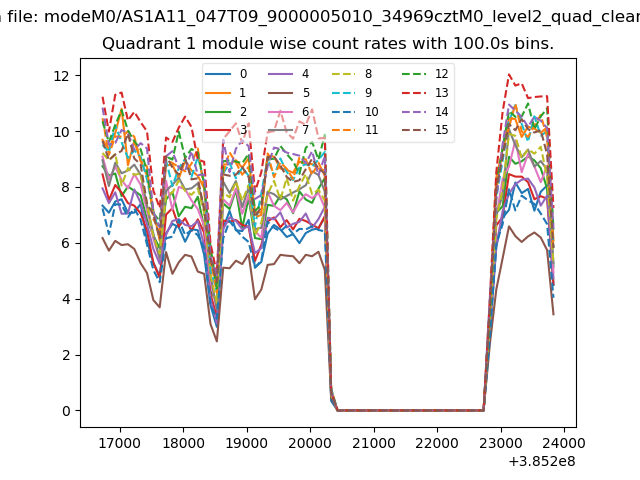
| Module-wise count rates for Quadrant A Data is divided into 100 sec bins |
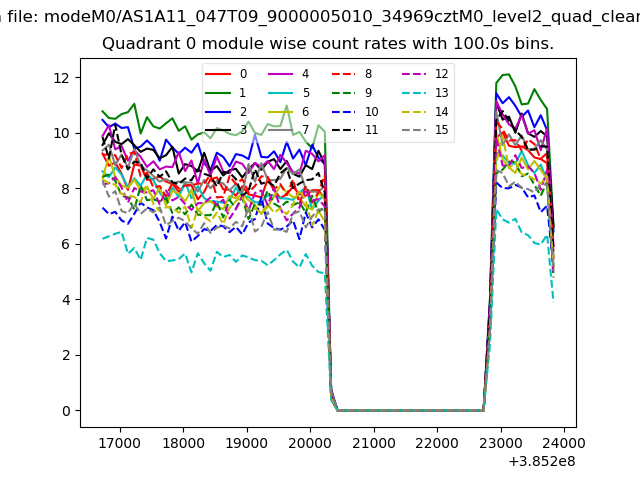 |
 |
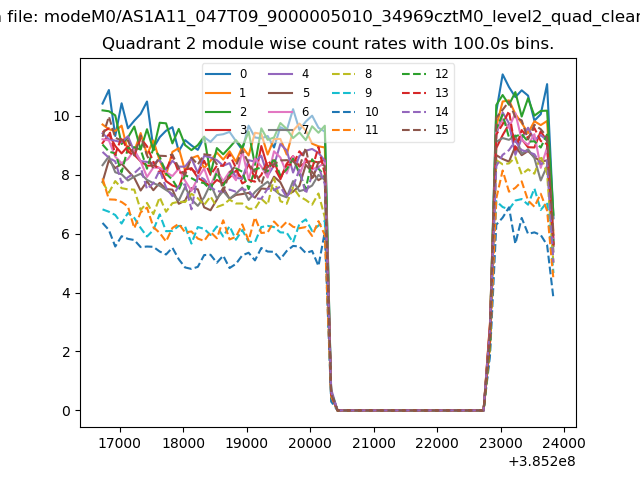
| Module-wise count rates for Quadrant B Data is divided into 100 sec bins |
 |
 |
| Module-wise count rates for Quadrant C Data is divided into 100 sec bins |
 |
 |
| Module-wise count rates for Quadrant D Data is divided into 100 sec bins |
 |
 |
| Parameter | Plot |
|---|---|
| CZT HV Monitor | 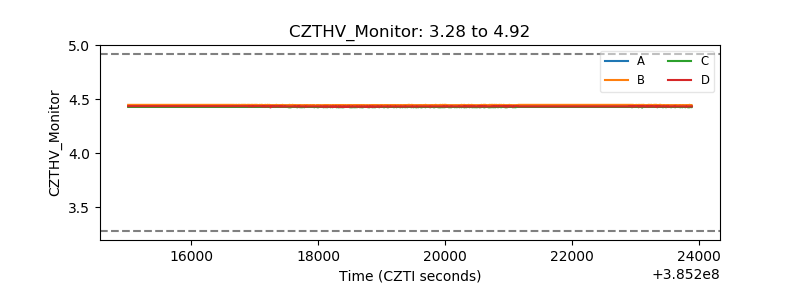 |
| D_VDD | 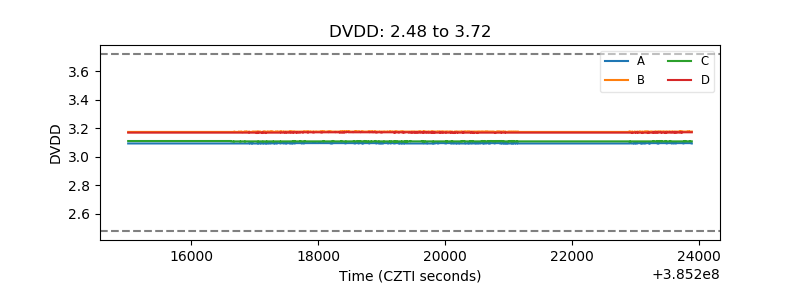 |
| Temperature 1 | 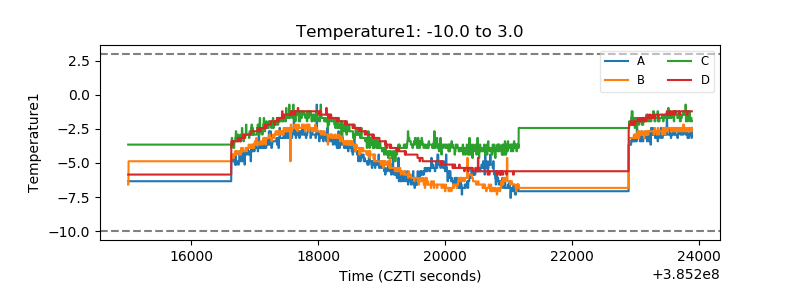 |
| Veto HV Monitor | 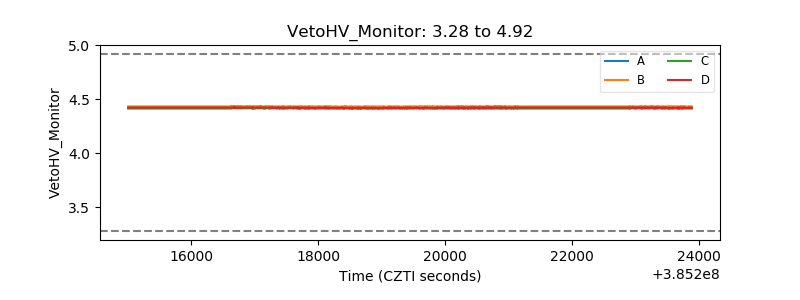 |
| Veto LLD | 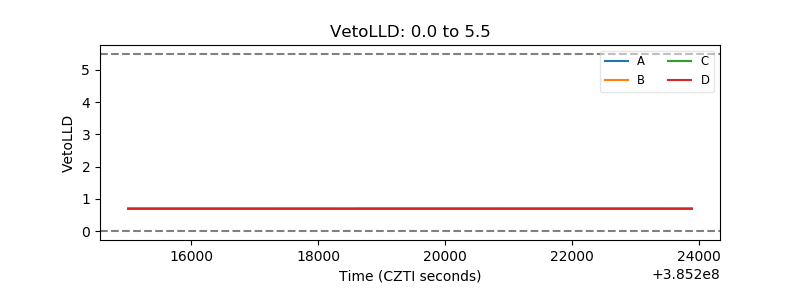 |
| Alpha Counter | 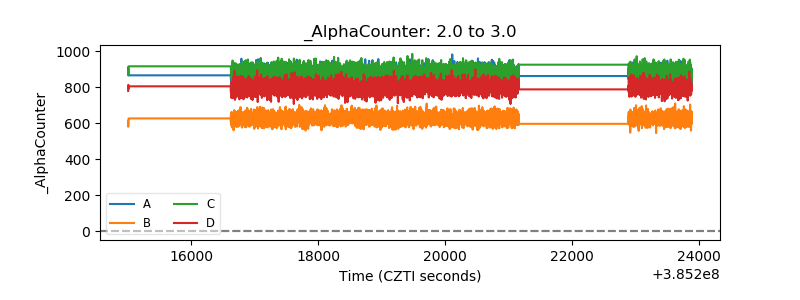 |
| _CPM_Rate | 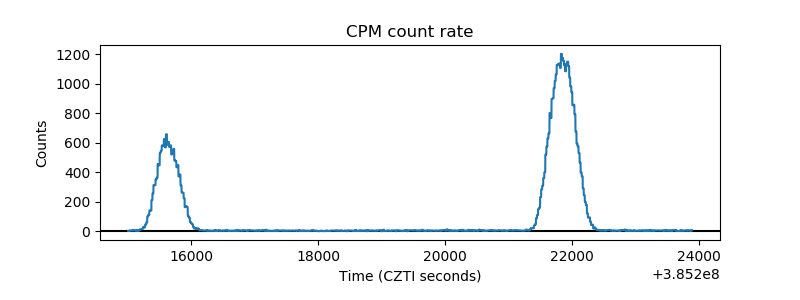 |
| CZT Counter | 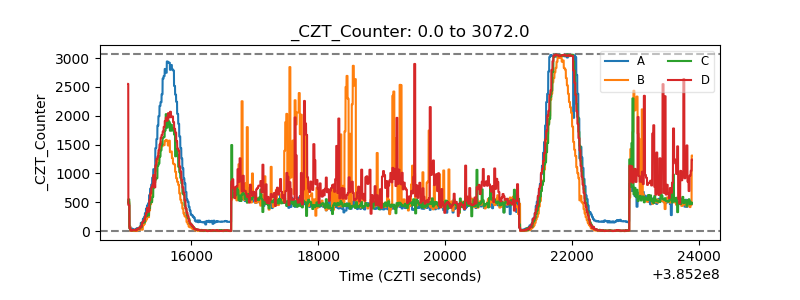 |
| +2.5 Volts monitor | 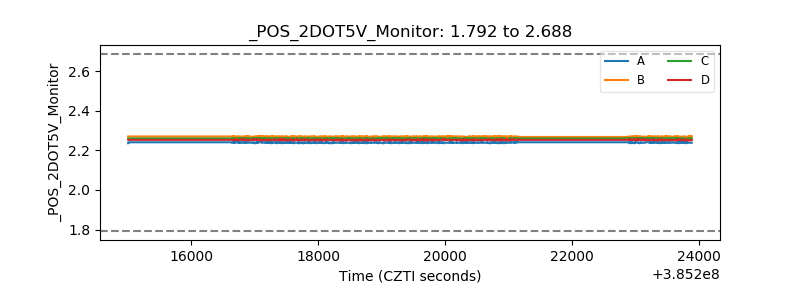 |
| +5 Volts monitor |  |
| _ROLL_ROT | 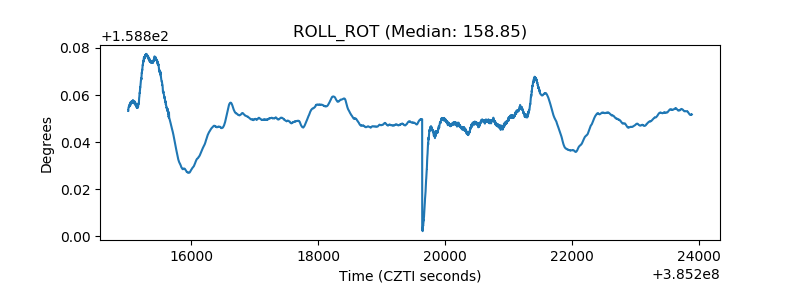 |
| _Roll_DEC | 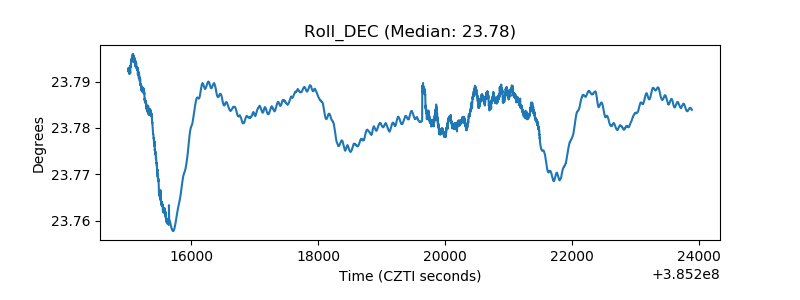 |
| _Roll_RA | 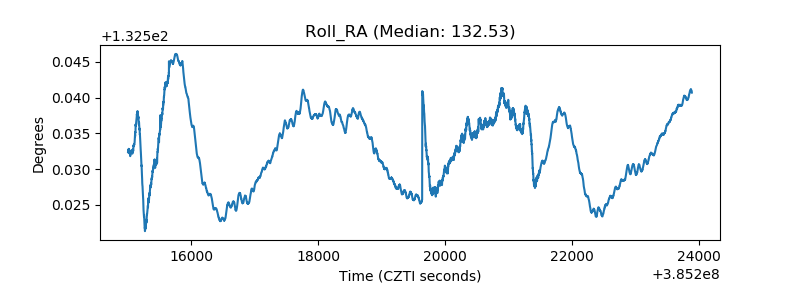 |
| Veto Counter | 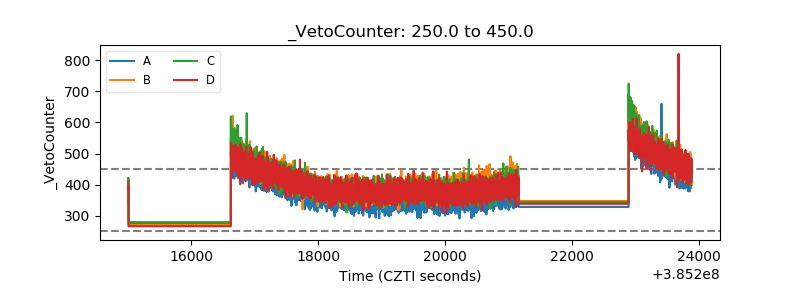 |