| Param | Original file | Final file |
|---|---|---|
| Filename | modeM0/AS1A11_047T09_9000005010_34967cztM0_level2.evt | modeM0/AS1A11_047T09_9000005010_34967cztM0_level2_quad_clean.evt |
| Size (bytes) | 440,582,400 | 86,155,200 |
| Size | 420.2 MB | 82.2 MB |
| Events in quadrant A | 2,599,134 | 568,707 |
| Events in quadrant B | 3,485,758 | 562,861 |
| Events in quadrant C | 2,827,913 | 562,055 |
| Events in quadrant D | 4,053,283 | 526,924 |
| Mode SS | |||
|---|---|---|---|
| Quadrant | BADHDUFLAG | Total packets | Discarded packets |
| A | 0 | 112 | 0 |
| B | 0 | 112 | 0 |
| C | 0 | 112 | 0 |
| D | 0 | 112 | 0 |
| Mode M0 | |||
|---|---|---|---|
| Quadrant | BADHDUFLAG | Total packets | Discarded packets |
| A | 0 | 11341 | 2 |
| B | 0 | 13937 | 1 |
| C | 0 | 11638 | 1 |
| D | 0 | 15933 | 1 |
| Mode M9 | |||
|---|---|---|---|
| Quadrant | BADHDUFLAG | Total packets | Discarded packets |
| A | 0 | 17 | 0 |
| B | 0 | 17 | 0 |
| C | 0 | 17 | 0 |
| D | 0 | 17 | 0 |
| Quadrant | Total seconds | Saturated seconds | Saturation percentage |
|---|---|---|---|
| A | 5555 | 7 | 0.126013% |
| B | 5555 | 235 | 4.230423% |
| C | 5555 | 18 | 0.324032% |
| D | 5555 | 111 | 1.998200% |
Noise dominated data is calculated using 1-second bins in cleaned event files. If a bin has >2000 counts, and if more than 50% of those come from <1% of pixels, then it is considered to be noise-dominated and hence unusable.
| Quadrant | # 1 sec bins | Bins with >0 counts | Bins with >2000 counts | High rate bins dominated by noise | Noise dominated (total time) | Noise dominated (detector-on time) | Marked lightcurve |
|---|---|---|---|---|---|---|---|
| A | 7168 | 5556 | 0 | 0 | 0.00% | 0.00% | 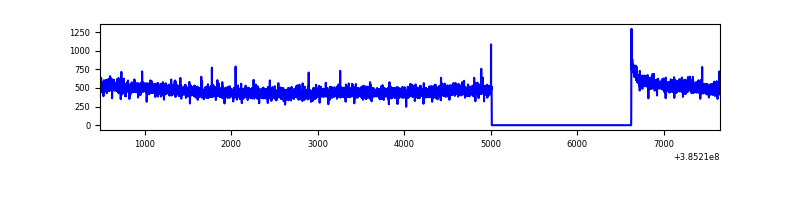 |
| B | 7168 | 5556 | 165 | 165 | 2.30% | 2.97% | 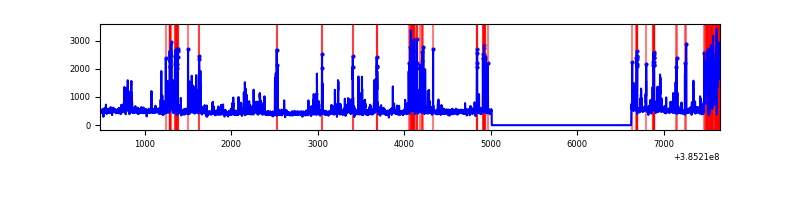 |
| C | 7168 | 5556 | 13 | 13 | 0.18% | 0.23% | 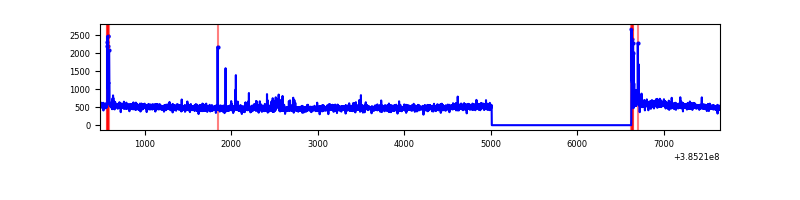 |
| D | 7168 | 5556 | 89 | 89 | 1.24% | 1.60% | 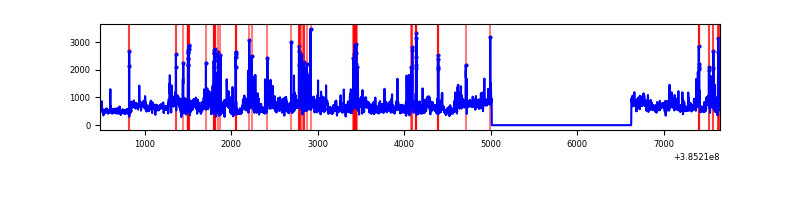 |
Top three noisy pixels from each quadrant. If the there are fewer than three noisy pixels in the level2.evt file, extra rows are filled as -1
| Pixel properties | Quadrant properties | ||||||
|---|---|---|---|---|---|---|---|
| Quadrant | DetID | PixID | Counts | Sigma | Mean | Median | Sigma |
| A | 10 | 83 | 52444 | 387.92 | 656 | 644 | 133.5 |
| A | 13 | 6 | 9642 | 67.38 | 656 | 644 | 133.5 |
| A | 13 | 254 | 9195 | 64.04 | 656 | 644 | 133.5 |
| B | 5 | 172 | 704546 | 5661.84 | 638 | 621 | 124.3 |
| B | 0 | 190 | 147752 | 1183.41 | 638 | 621 | 124.3 |
| B | 0 | 155 | 59355 | 472.41 | 638 | 621 | 124.3 |
| C | 15 | 214 | 232239 | 1562.84 | 635 | 640 | 148.2 |
| C | 12 | 250 | 47746 | 317.87 | 635 | 640 | 148.2 |
| C | 0 | 10 | 41181 | 273.57 | 635 | 640 | 148.2 |
| D | 8 | 195 | 945476 | 6109.77 | 635 | 617 | 154.6 |
| D | 13 | 249 | 227946 | 1469.98 | 635 | 617 | 154.6 |
| D | 2 | 207 | 84839 | 544.6 | 635 | 617 | 154.6 |
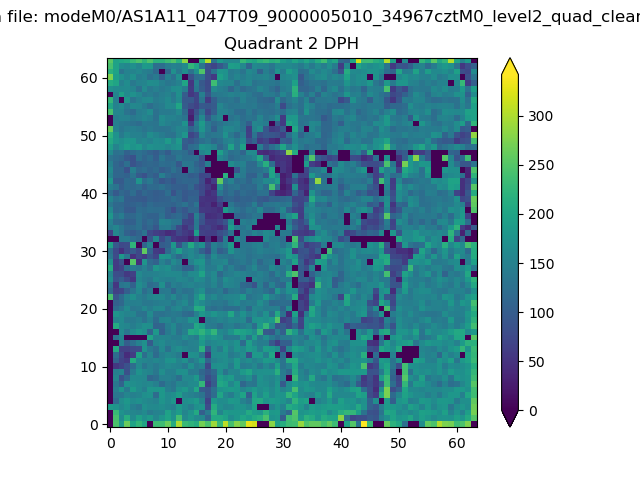
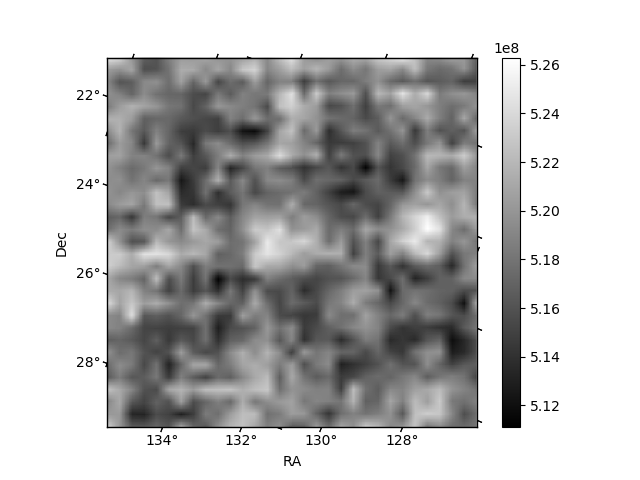
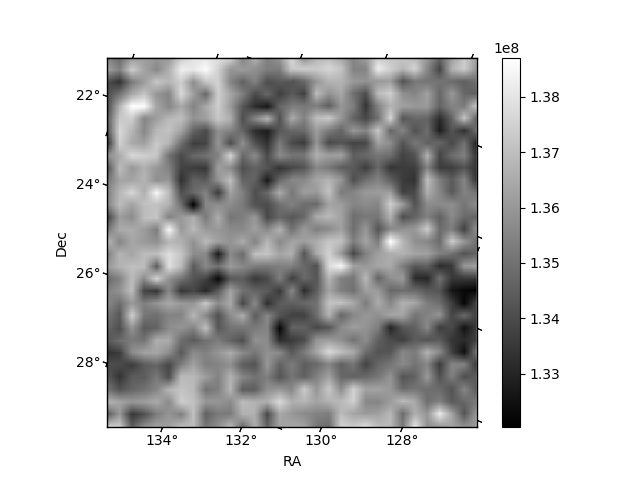
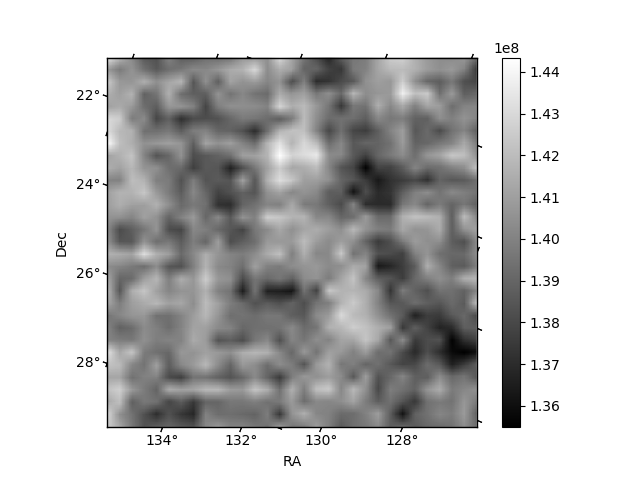
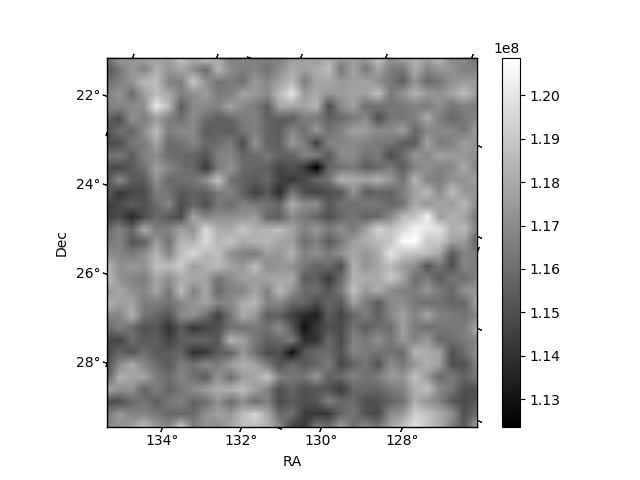
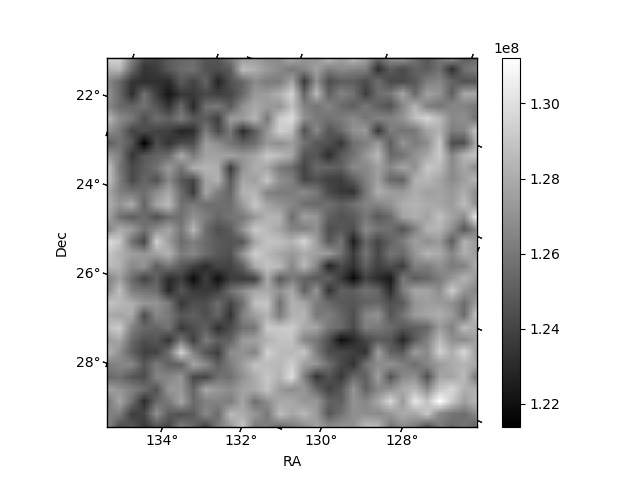
Histogram calculated using DETX and DETY for each event in the final _common_clean file
| Quadrant A | 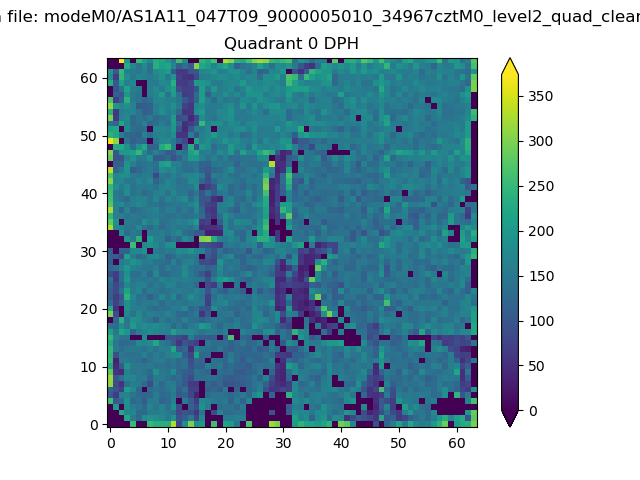 |
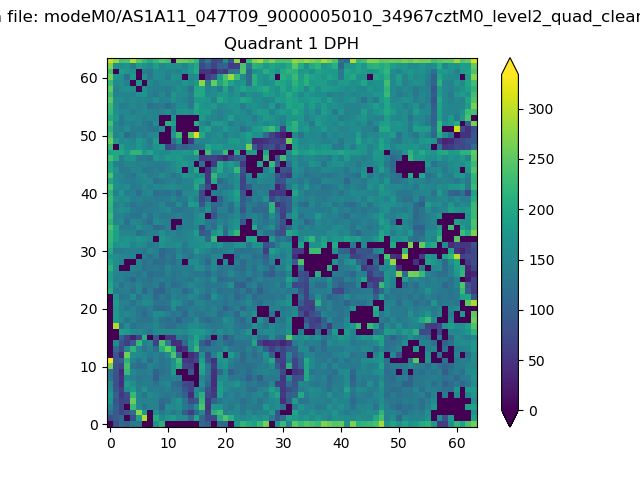 |
Quadrant B |
|---|---|---|---|
| Quadrant D | 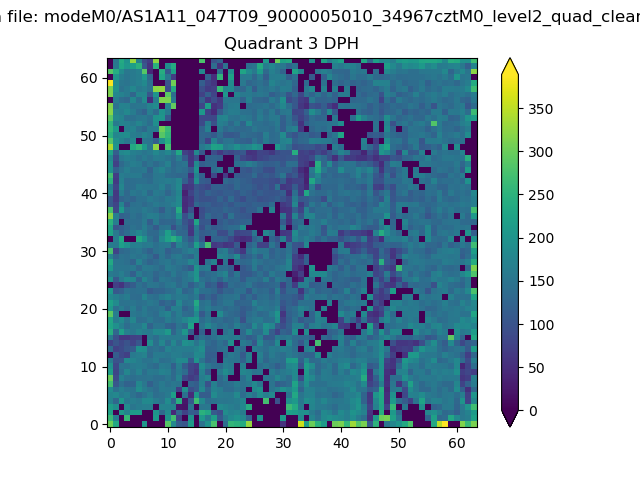 |
 |
Quadrant C |
| Plot type | Count rate plots | Images |
|---|---|---|
| Comparison with Poisson distribution Blue bars denote a histogram of data divided into 1 sec bins. Red curve is a Poisson curve with rate = median count rate of data. |
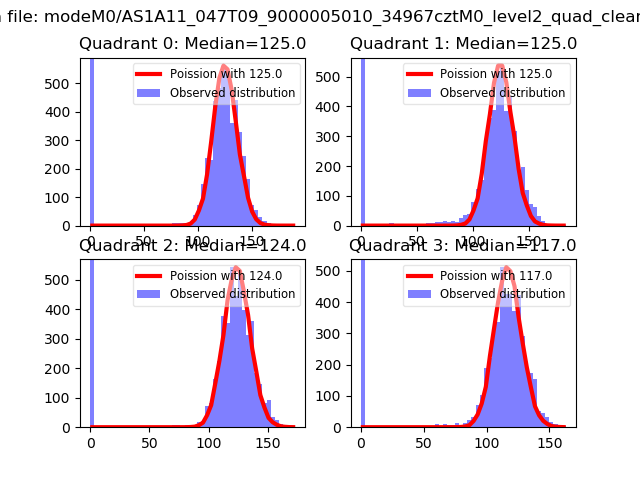 |
 |
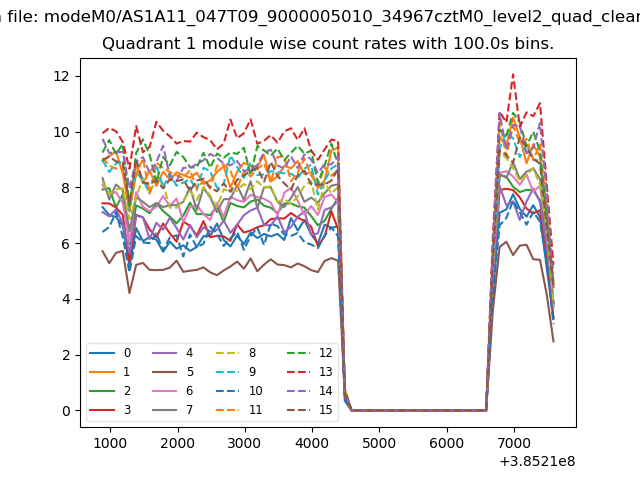
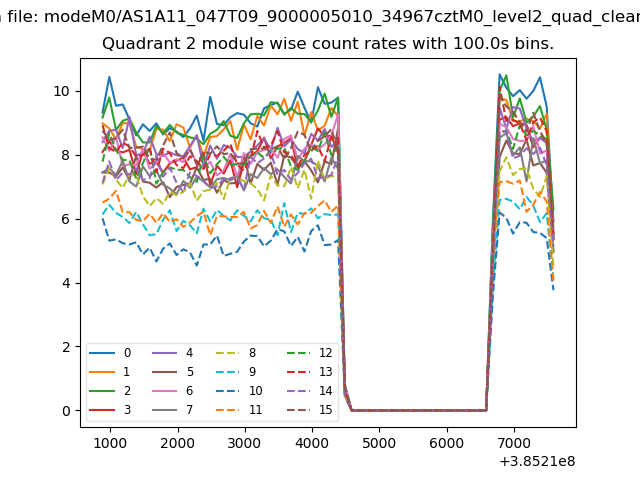
| Quadrant-wise count rates Data is divided into 100 sec bins |
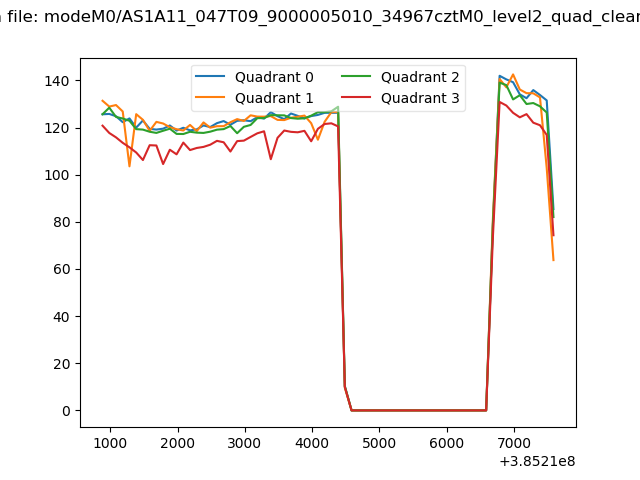 |
|
| Module-wise count rates for Quadrant A Data is divided into 100 sec bins |
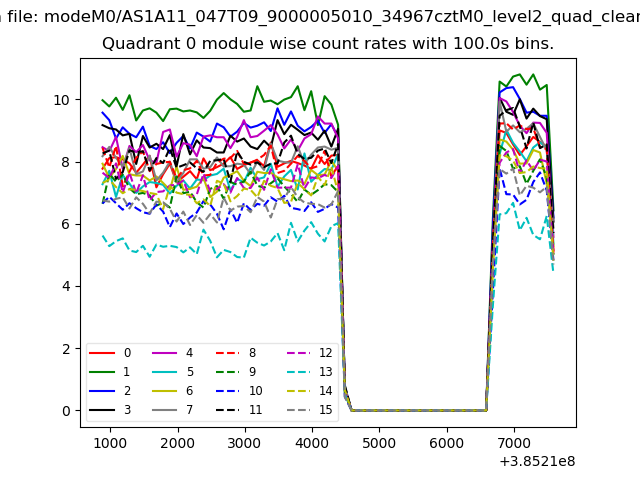 |
 |
| Module-wise count rates for Quadrant B Data is divided into 100 sec bins |
 |
 |
| Module-wise count rates for Quadrant C Data is divided into 100 sec bins |
 |
 |
| Module-wise count rates for Quadrant D Data is divided into 100 sec bins |
 |
 |
| Parameter | Plot |
|---|---|
| CZT HV Monitor | 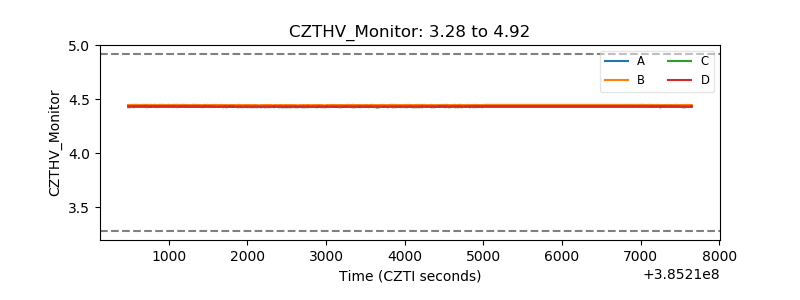 |
| D_VDD | 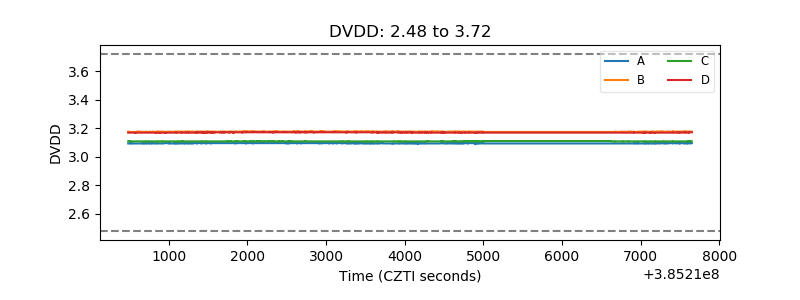 |
| Temperature 1 | 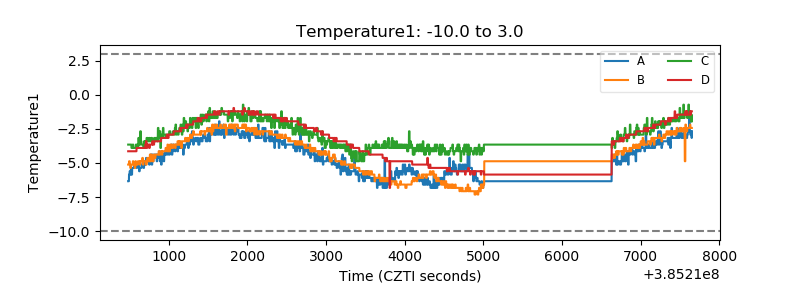 |
| Veto HV Monitor | 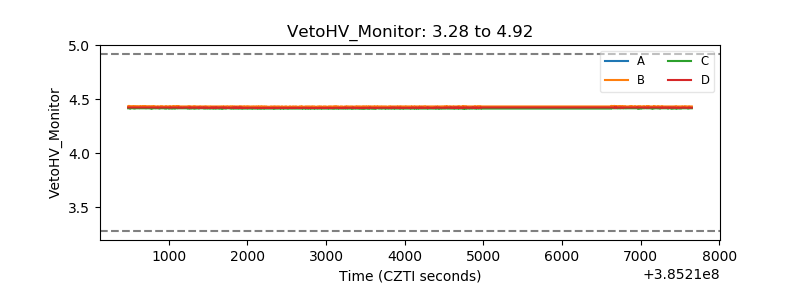 |
| Veto LLD | 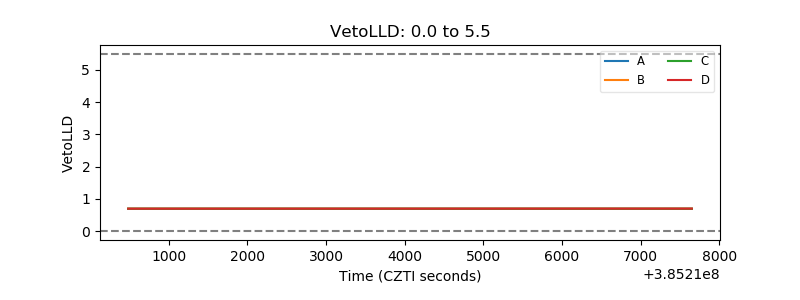 |
| Alpha Counter | 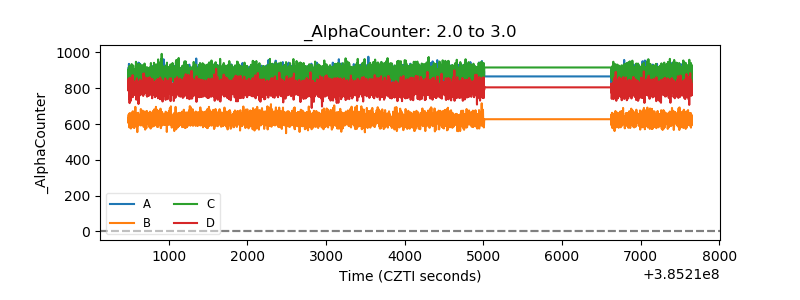 |
| _CPM_Rate | 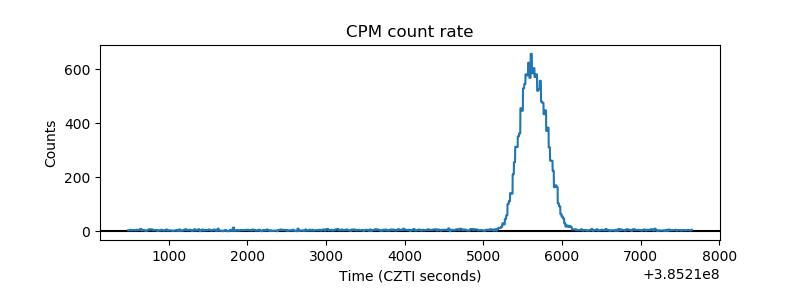 |
| CZT Counter | 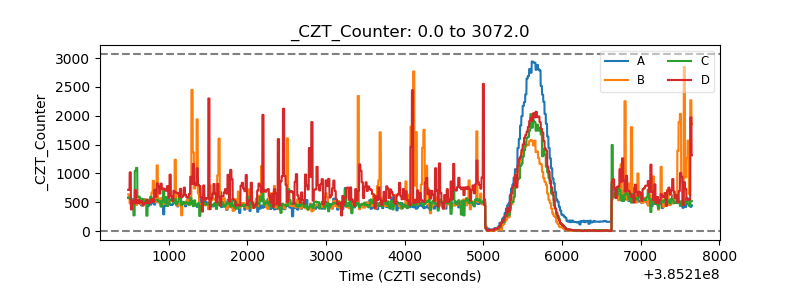 |
| +2.5 Volts monitor | 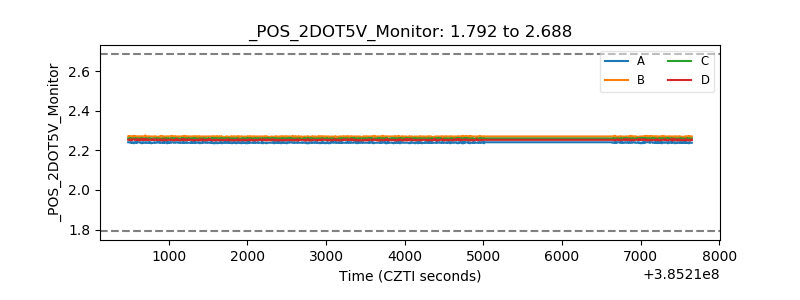 |
| +5 Volts monitor | 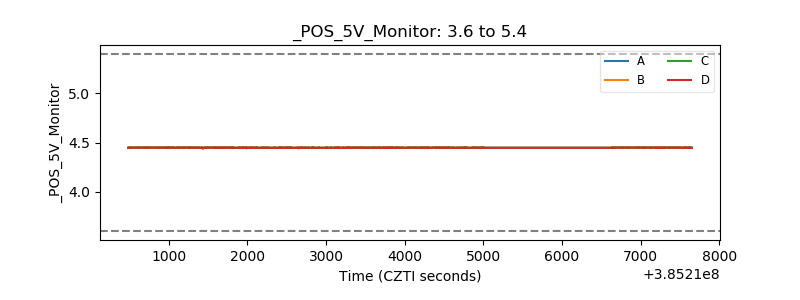 |
| _ROLL_ROT | 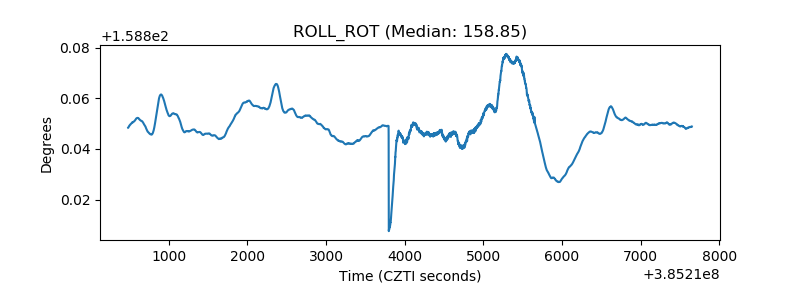 |
| _Roll_DEC | 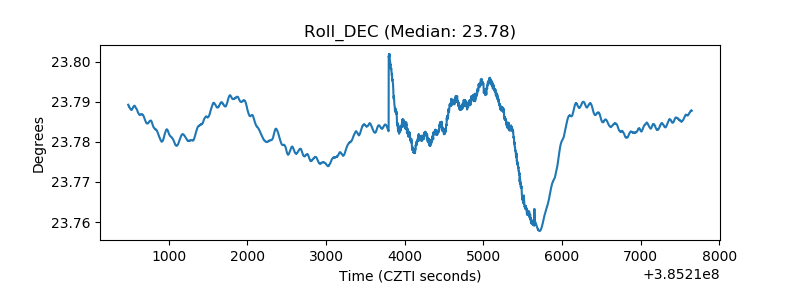 |
| _Roll_RA | 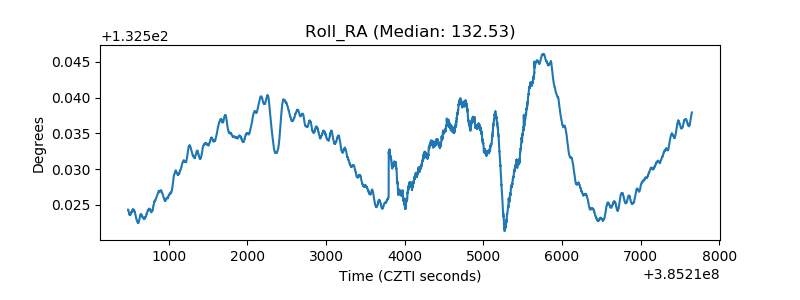 |
| Veto Counter | 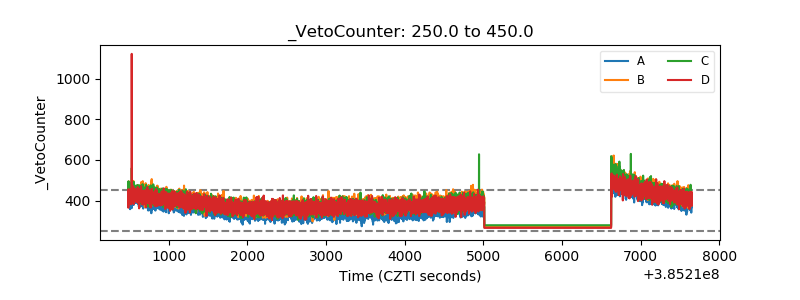 |