| Param | Original file | Final file |
|---|---|---|
| Filename | modeM0/AS1A11_047T09_9000005010_34961cztM0_level2.evt | modeM0/AS1A11_047T09_9000005010_34961cztM0_level2_quad_clean.evt |
| Size (bytes) | 430,084,800 | 56,819,520 |
| Size | 410.2 MB | 54.2 MB |
| Events in quadrant A | 2,495,148 | 347,458 |
| Events in quadrant B | 3,794,090 | 328,312 |
| Events in quadrant C | 2,815,249 | 344,735 |
| Events in quadrant D | 3,556,570 | 324,452 |
| Mode SS | |||
|---|---|---|---|
| Quadrant | BADHDUFLAG | Total packets | Discarded packets |
| A | 0 | 110 | 0 |
| B | 0 | 110 | 0 |
| C | 0 | 110 | 0 |
| D | 0 | 110 | 0 |
| Mode M0 | |||
|---|---|---|---|
| Quadrant | BADHDUFLAG | Total packets | Discarded packets |
| A | 0 | 10959 | 3 |
| B | 0 | 14851 | 2 |
| C | 0 | 11557 | 2 |
| D | 0 | 14126 | 2 |
| Mode M9 | |||
|---|---|---|---|
| Quadrant | BADHDUFLAG | Total packets | Discarded packets |
| A | 0 | 37 | 0 |
| B | 0 | 37 | 0 |
| C | 0 | 37 | 0 |
| D | 0 | 37 | 0 |
| Quadrant | Total seconds | Saturated seconds | Saturation percentage |
|---|---|---|---|
| A | 5353 | 7 | 0.130768% |
| B | 5353 | 486 | 9.079021% |
| C | 5353 | 55 | 1.027461% |
| D | 5353 | 135 | 2.521950% |
Noise dominated data is calculated using 1-second bins in cleaned event files. If a bin has >2000 counts, and if more than 50% of those come from <1% of pixels, then it is considered to be noise-dominated and hence unusable.
| Quadrant | # 1 sec bins | Bins with >0 counts | Bins with >2000 counts | High rate bins dominated by noise | Noise dominated (total time) | Noise dominated (detector-on time) | Marked lightcurve |
|---|---|---|---|---|---|---|---|
| A | 7116 | 5354 | 0 | 0 | 0.00% | 0.00% | 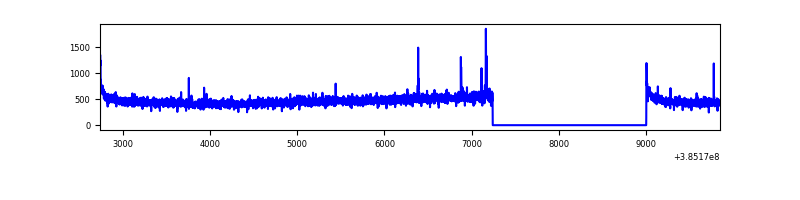 |
| B | 7116 | 5354 | 387 | 387 | 5.44% | 7.23% | 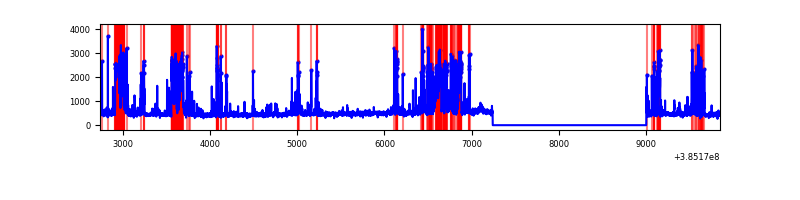 |
| C | 7116 | 5354 | 47 | 47 | 0.66% | 0.88% | 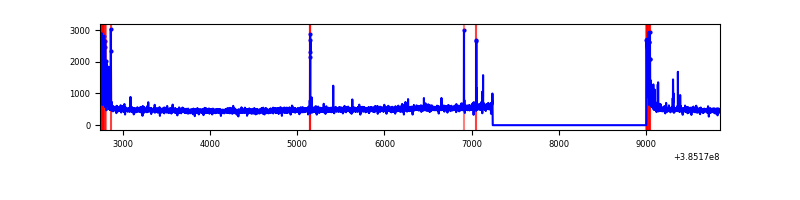 |
| D | 7116 | 5354 | 117 | 117 | 1.64% | 2.19% | 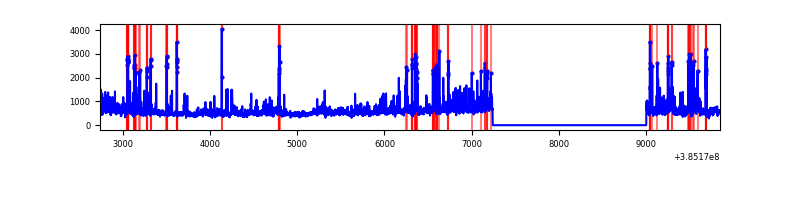 |
Top three noisy pixels from each quadrant. If the there are fewer than three noisy pixels in the level2.evt file, extra rows are filled as -1
| Pixel properties | Quadrant properties | ||||||
|---|---|---|---|---|---|---|---|
| Quadrant | DetID | PixID | Counts | Sigma | Mean | Median | Sigma |
| A | 10 | 83 | 69255 | 552.02 | 616 | 605 | 124.4 |
| A | 15 | 223 | 17381 | 134.9 | 616 | 605 | 124.4 |
| A | 13 | 6 | 13804 | 106.13 | 616 | 605 | 124.4 |
| B | 5 | 172 | 1355774 | 11927.34 | 589 | 573 | 113.6 |
| B | 0 | 190 | 50819 | 442.22 | 589 | 573 | 113.6 |
| B | 0 | 219 | 21165 | 181.23 | 589 | 573 | 113.6 |
| C | 15 | 214 | 224175 | 1586.56 | 600 | 605 | 140.9 |
| C | 0 | 10 | 181524 | 1283.89 | 600 | 605 | 140.9 |
| C | 12 | 250 | 57674 | 404.99 | 600 | 605 | 140.9 |
| D | 8 | 195 | 560374 | 3844.51 | 591 | 573 | 145.6 |
| D | 13 | 249 | 336012 | 2303.67 | 591 | 573 | 145.6 |
| D | 1 | 47 | 71141 | 484.64 | 591 | 573 | 145.6 |
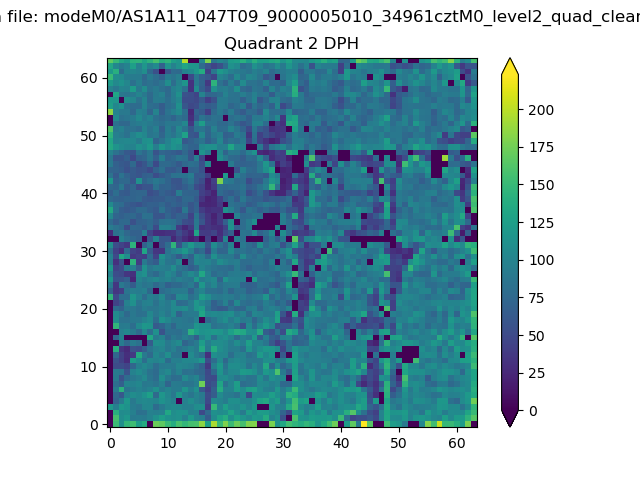
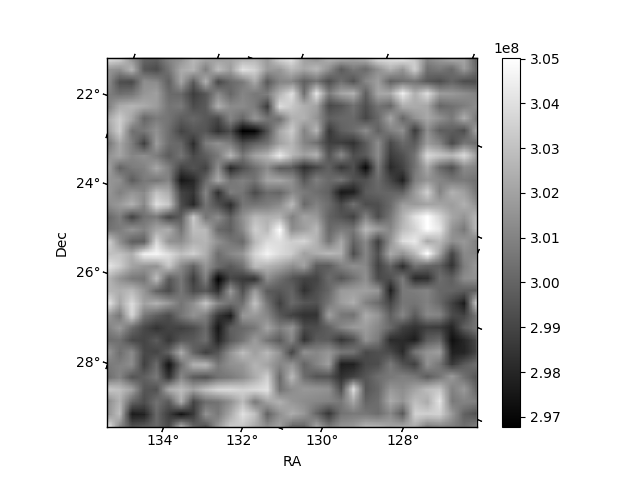
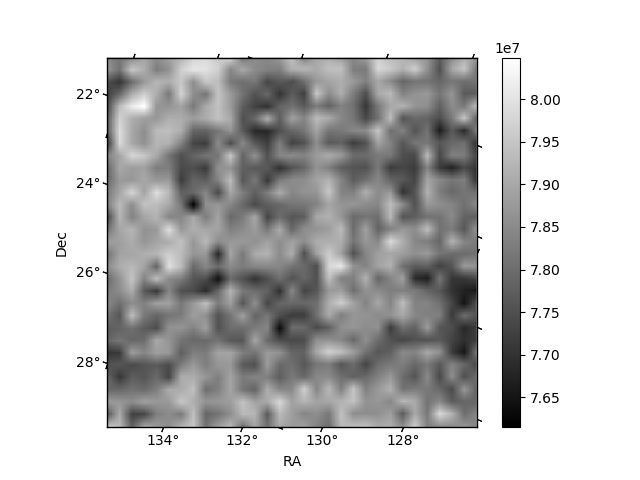
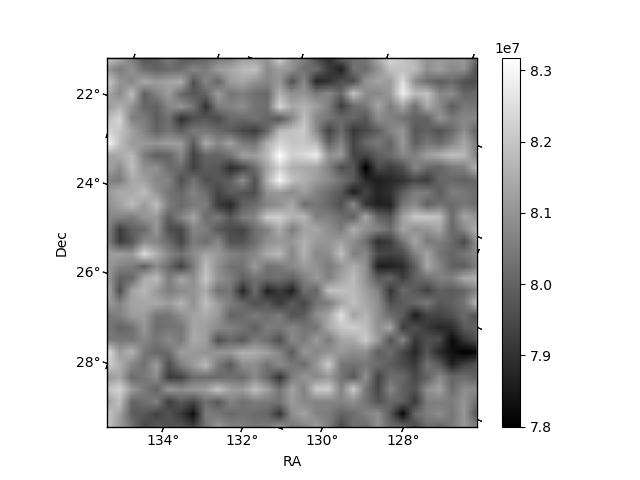
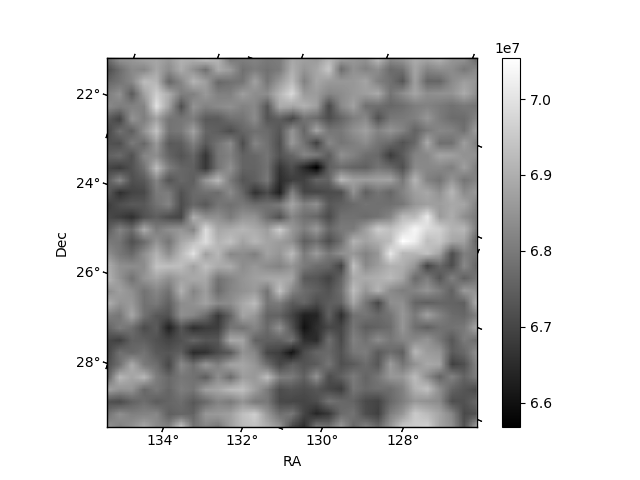
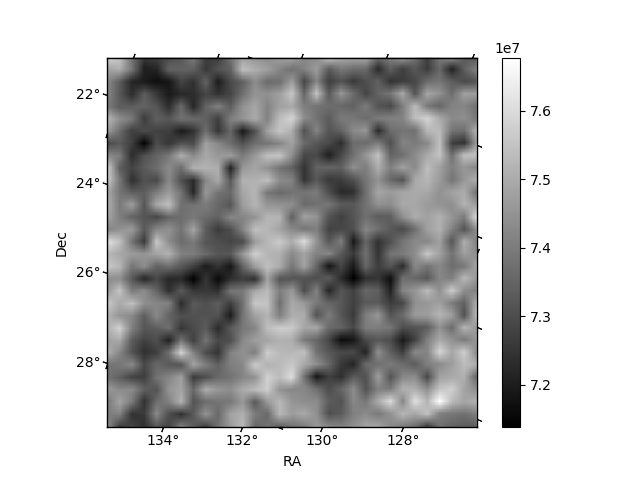
Histogram calculated using DETX and DETY for each event in the final _common_clean file
| Quadrant A | 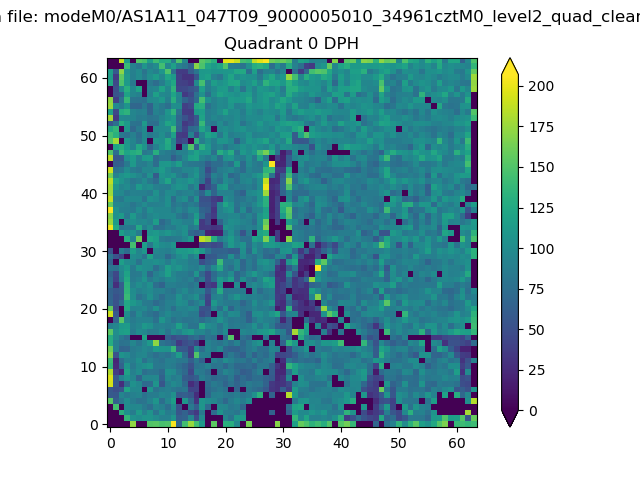 |
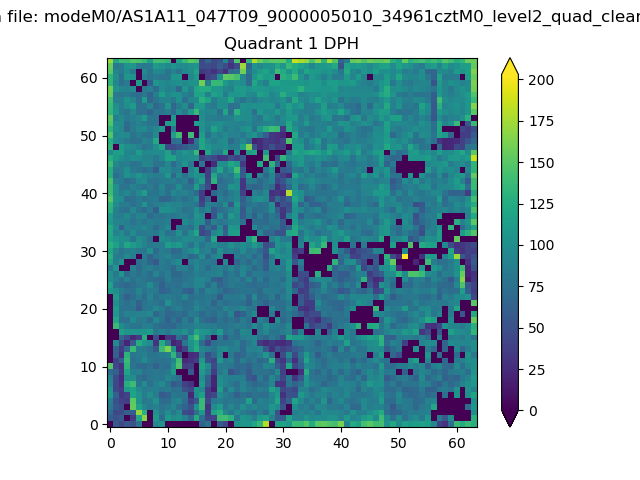 |
Quadrant B |
|---|---|---|---|
| Quadrant D | 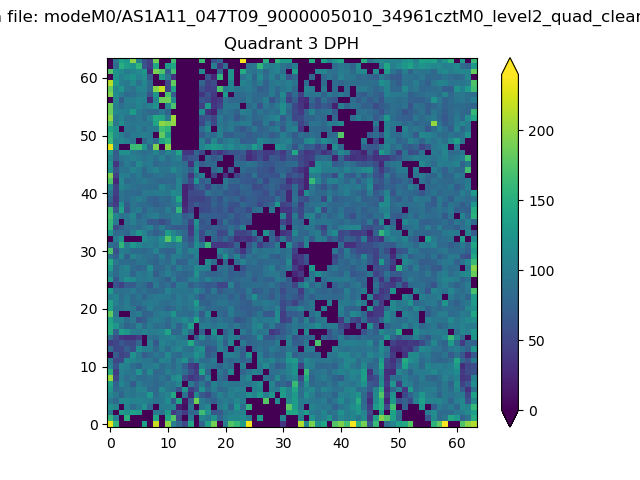 |
 |
Quadrant C |
| Plot type | Count rate plots | Images |
|---|---|---|
| Comparison with Poisson distribution Blue bars denote a histogram of data divided into 1 sec bins. Red curve is a Poisson curve with rate = median count rate of data. |
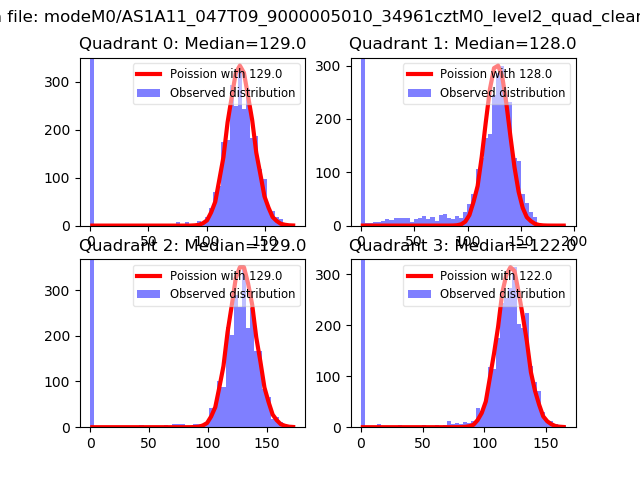 |
 |
| Quadrant-wise count rates Data is divided into 100 sec bins |
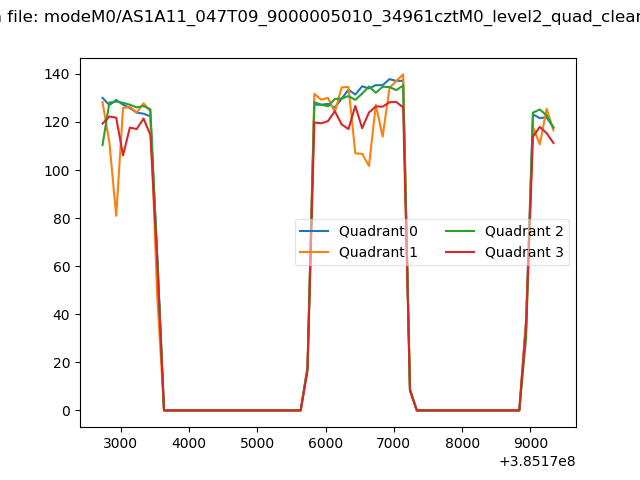 |
|
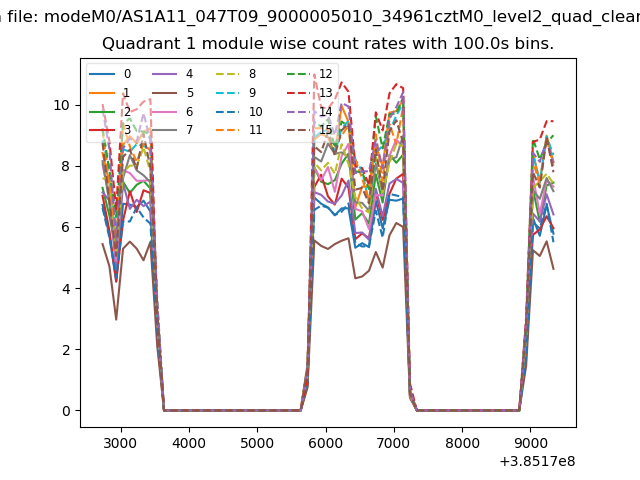
| Module-wise count rates for Quadrant A Data is divided into 100 sec bins |
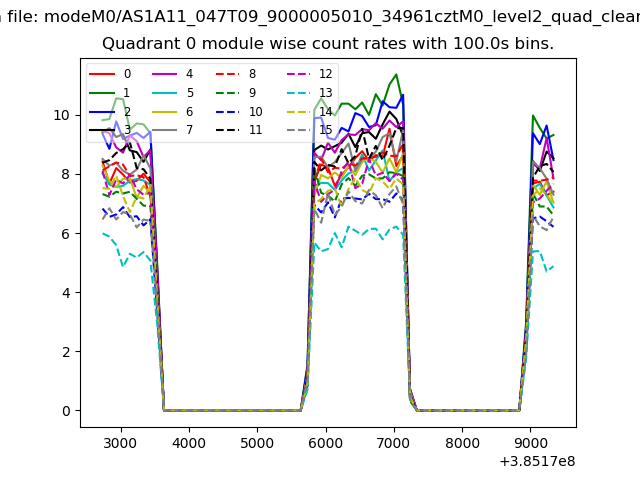 |
 |
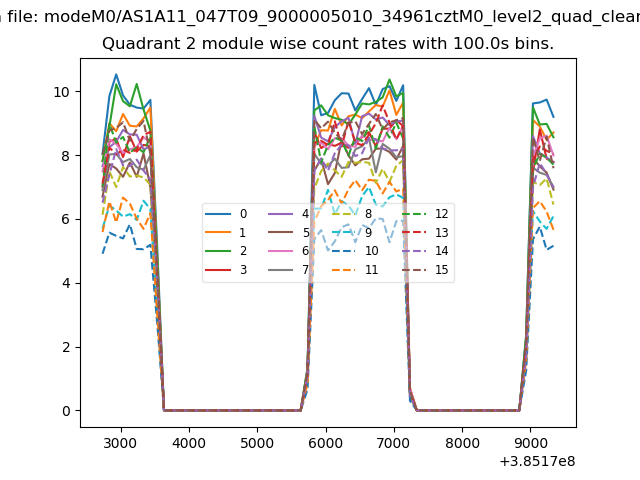
| Module-wise count rates for Quadrant B Data is divided into 100 sec bins |
 |
 |
| Module-wise count rates for Quadrant C Data is divided into 100 sec bins |
 |
 |
| Module-wise count rates for Quadrant D Data is divided into 100 sec bins |
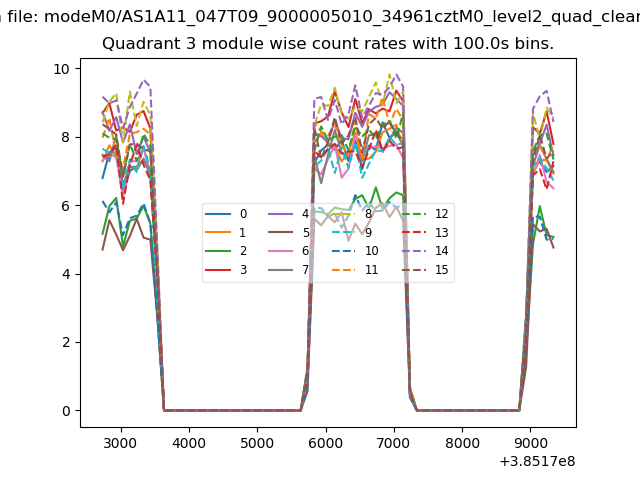 |
 |
| Parameter | Plot |
|---|---|
| CZT HV Monitor | 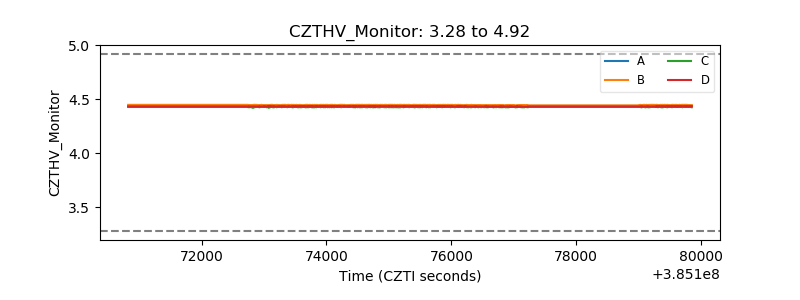 |
| D_VDD | 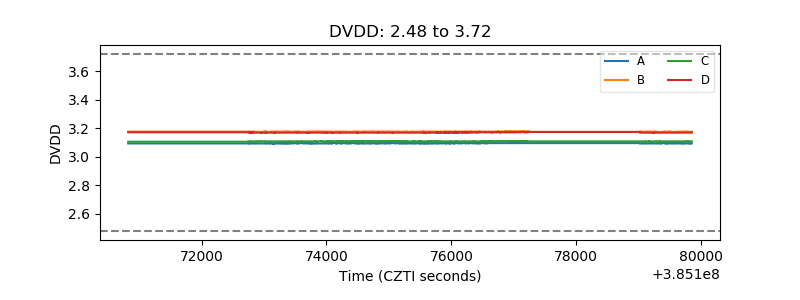 |
| Temperature 1 | 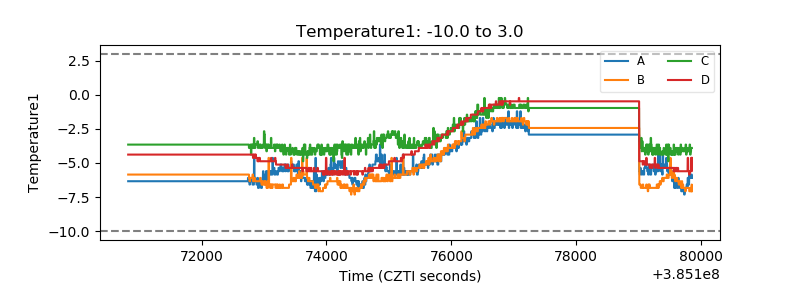 |
| Veto HV Monitor | 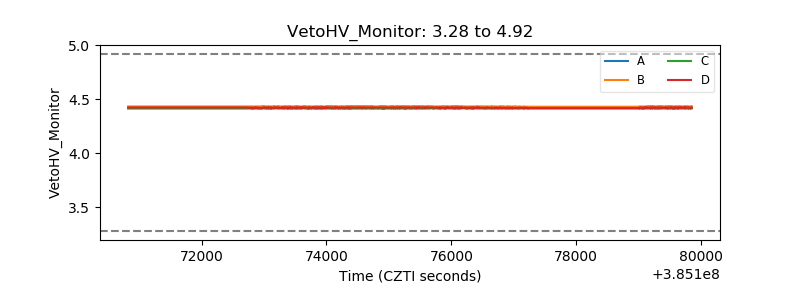 |
| Veto LLD | 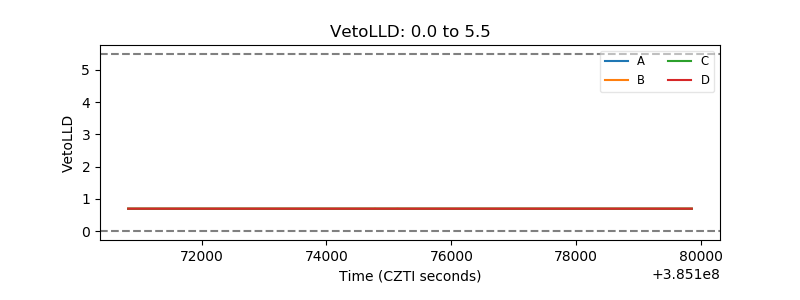 |
| Alpha Counter | 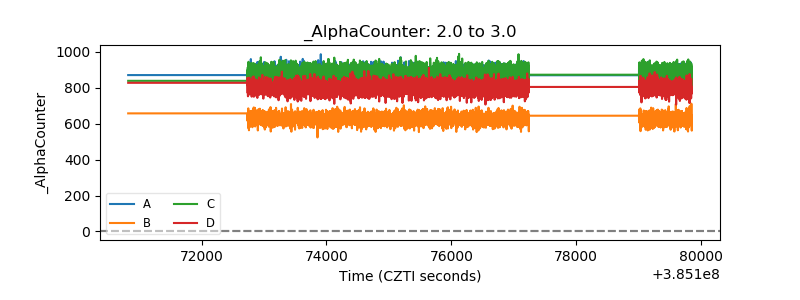 |
| _CPM_Rate | 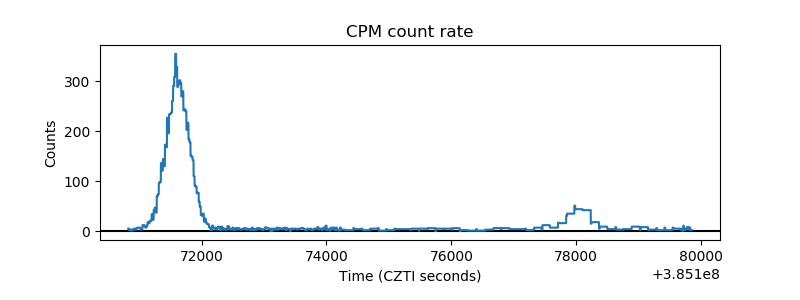 |
| CZT Counter | 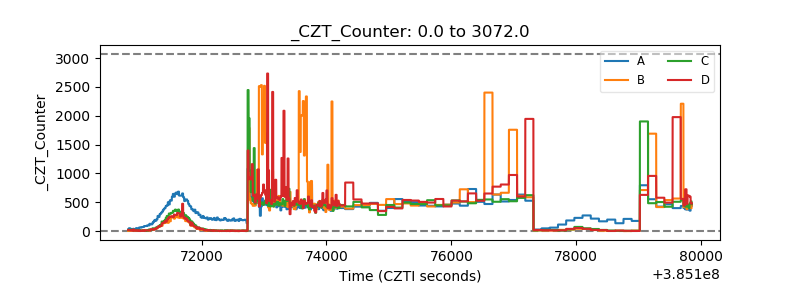 |
| +2.5 Volts monitor | 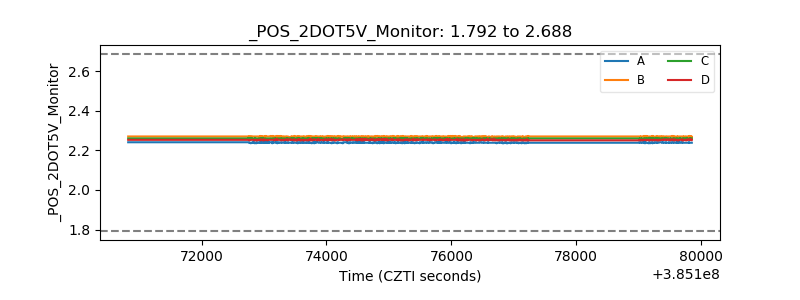 |
| +5 Volts monitor | 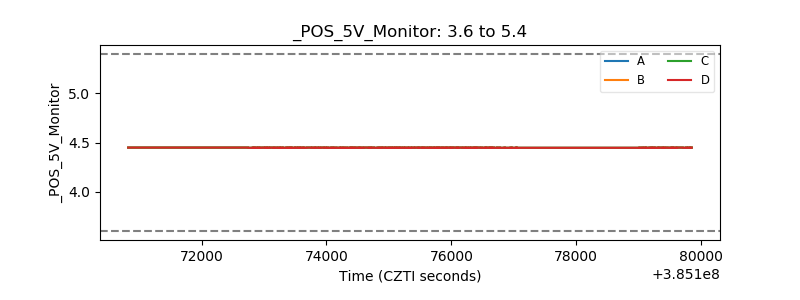 |
| _ROLL_ROT | 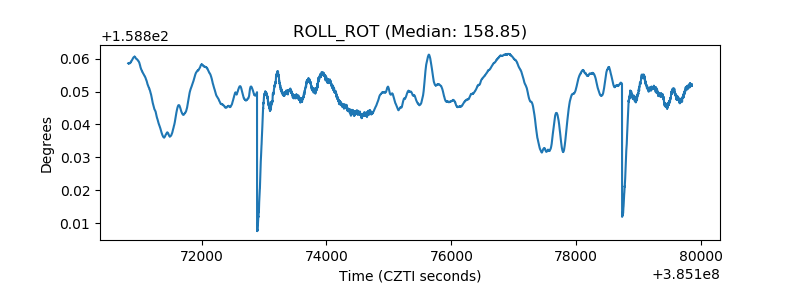 |
| _Roll_DEC | 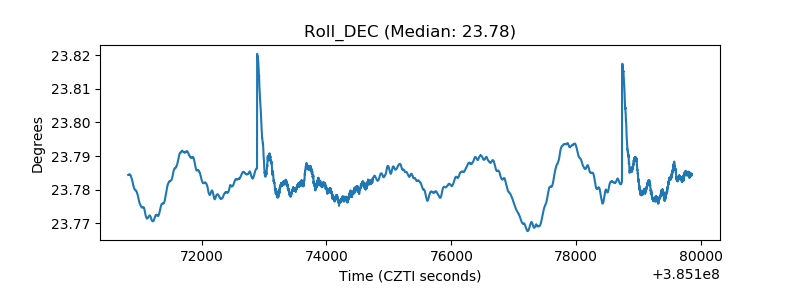 |
| _Roll_RA | 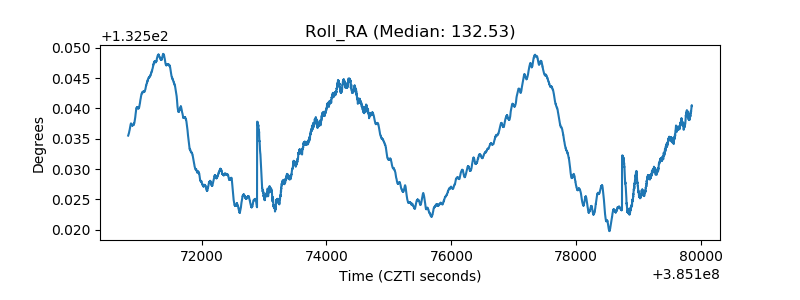 |
| Veto Counter | 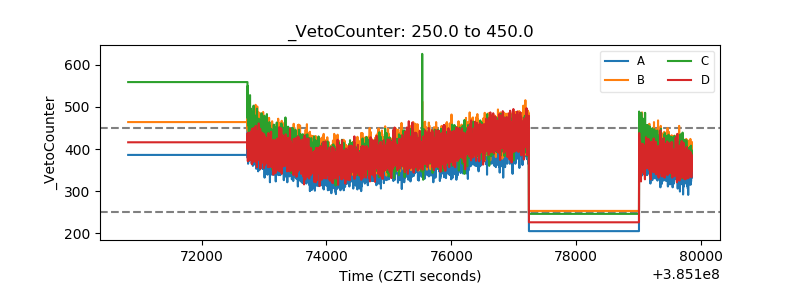 |