| Param | Original file | Final file |
|---|---|---|
| Filename | modeM0/AS1A11_047T09_9000005010_34960cztM0_level2.evt | modeM0/AS1A11_047T09_9000005010_34960cztM0_level2_quad_clean.evt |
| Size (bytes) | 415,972,800 | 59,094,720 |
| Size | 396.7 MB | 56.4 MB |
| Events in quadrant A | 2,375,018 | 373,082 |
| Events in quadrant B | 3,836,715 | 349,453 |
| Events in quadrant C | 2,799,423 | 368,159 |
| Events in quadrant D | 3,243,509 | 344,584 |
| Mode SS | |||
|---|---|---|---|
| Quadrant | BADHDUFLAG | Total packets | Discarded packets |
| A | 0 | 102 | 0 |
| B | 0 | 102 | 0 |
| C | 0 | 102 | 0 |
| D | 0 | 102 | 0 |
| Mode M0 | |||
|---|---|---|---|
| Quadrant | BADHDUFLAG | Total packets | Discarded packets |
| A | 0 | 10363 | 3 |
| B | 0 | 14693 | 2 |
| C | 0 | 11276 | 2 |
| D | 0 | 12901 | 2 |
| Mode M9 | |||
|---|---|---|---|
| Quadrant | BADHDUFLAG | Total packets | Discarded packets |
| A | 0 | 30 | 0 |
| B | 0 | 30 | 0 |
| C | 0 | 30 | 0 |
| D | 0 | 31 | 0 |
| Quadrant | Total seconds | Saturated seconds | Saturation percentage |
|---|---|---|---|
| A | 5048 | 8 | 0.158479% |
| B | 5048 | 506 | 10.023772% |
| C | 5048 | 81 | 1.604596% |
| D | 5048 | 151 | 2.991284% |
Noise dominated data is calculated using 1-second bins in cleaned event files. If a bin has >2000 counts, and if more than 50% of those come from <1% of pixels, then it is considered to be noise-dominated and hence unusable.
| Quadrant | # 1 sec bins | Bins with >0 counts | Bins with >2000 counts | High rate bins dominated by noise | Noise dominated (total time) | Noise dominated (detector-on time) | Marked lightcurve |
|---|---|---|---|---|---|---|---|
| A | 7081 | 5049 | 0 | 0 | 0.00% | 0.00% | 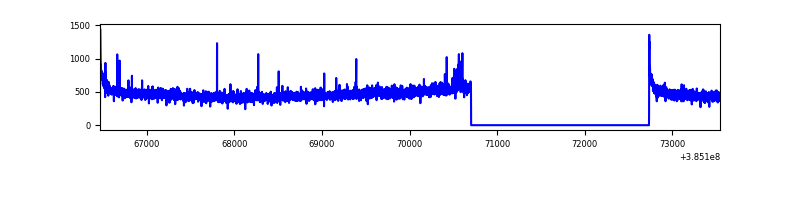 |
| B | 7081 | 5049 | 425 | 425 | 6.00% | 8.42% |  |
| C | 7081 | 5049 | 69 | 69 | 0.97% | 1.37% | 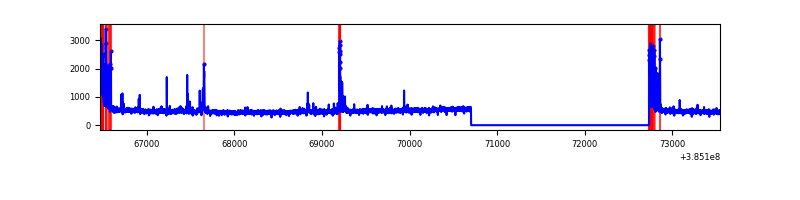 |
| D | 7081 | 5049 | 141 | 141 | 1.99% | 2.79% | 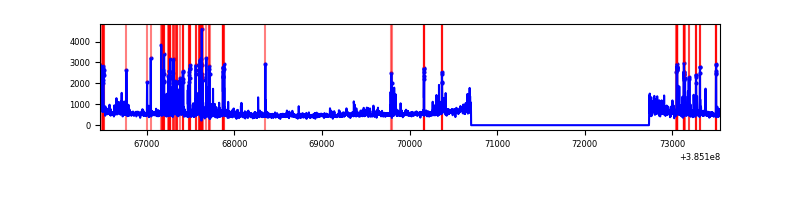 |
Top three noisy pixels from each quadrant. If the there are fewer than three noisy pixels in the level2.evt file, extra rows are filled as -1
| Pixel properties | Quadrant properties | ||||||
|---|---|---|---|---|---|---|---|
| Quadrant | DetID | PixID | Counts | Sigma | Mean | Median | Sigma |
| A | 10 | 83 | 67585 | 564.05 | 587 | 577 | 118.8 |
| A | 15 | 223 | 18829 | 153.64 | 587 | 577 | 118.8 |
| A | 13 | 6 | 12640 | 101.54 | 587 | 577 | 118.8 |
| B | 5 | 172 | 1548429 | 14329.13 | 562 | 548 | 108.0 |
| B | 0 | 190 | 27905 | 253.25 | 562 | 548 | 108.0 |
| B | 4 | 232 | 20867 | 188.1 | 562 | 548 | 108.0 |
| C | 0 | 10 | 242555 | 1813.2 | 573 | 577 | 133.5 |
| C | 15 | 214 | 211815 | 1582.85 | 573 | 577 | 133.5 |
| C | 0 | 207 | 53249 | 394.68 | 573 | 577 | 133.5 |
| D | 8 | 195 | 483393 | 3504.21 | 561 | 546 | 137.8 |
| D | 13 | 249 | 331065 | 2398.71 | 561 | 546 | 137.8 |
| D | 1 | 47 | 75533 | 544.21 | 561 | 546 | 137.8 |
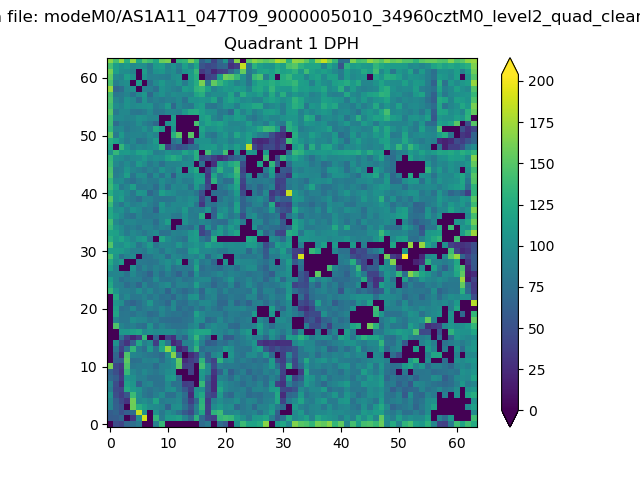
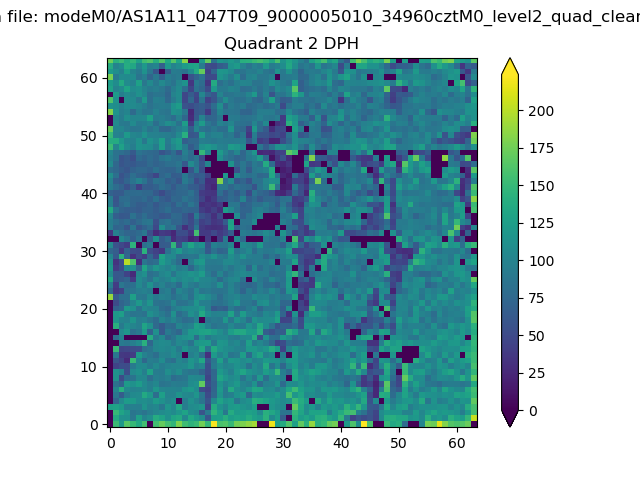
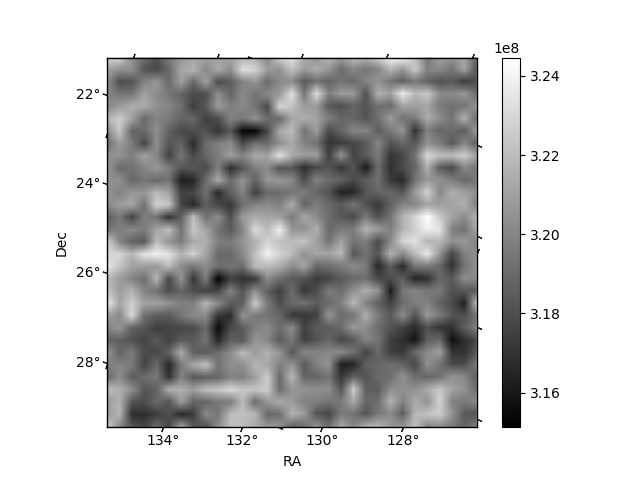
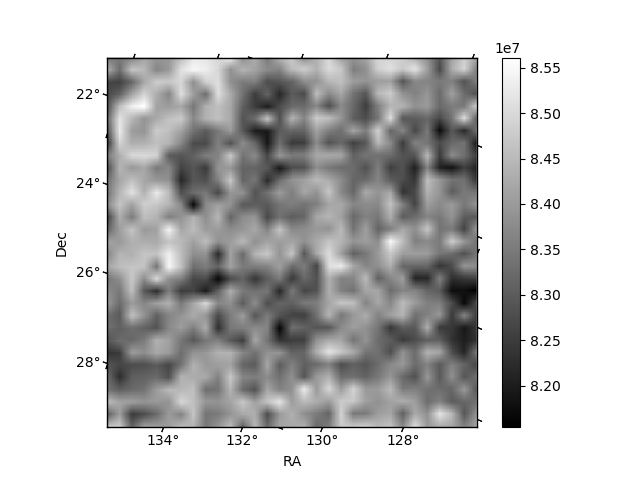
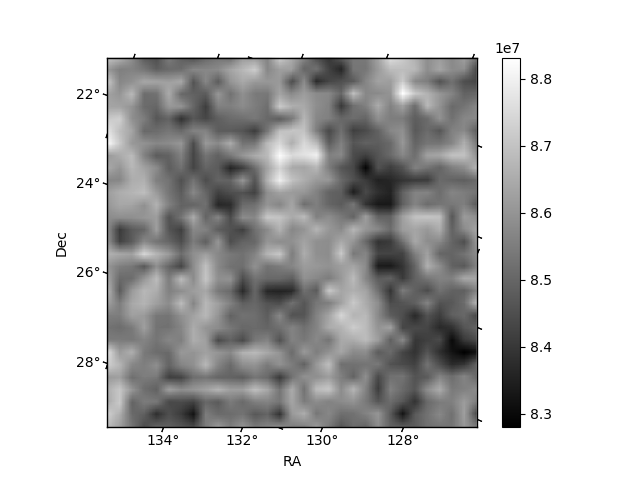
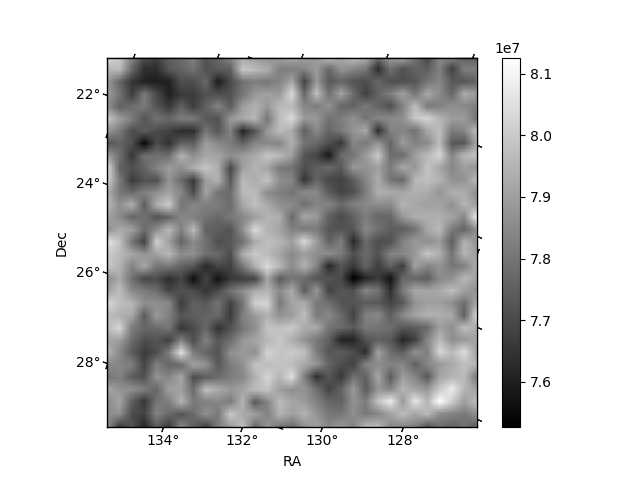
Histogram calculated using DETX and DETY for each event in the final _common_clean file
| Quadrant A | 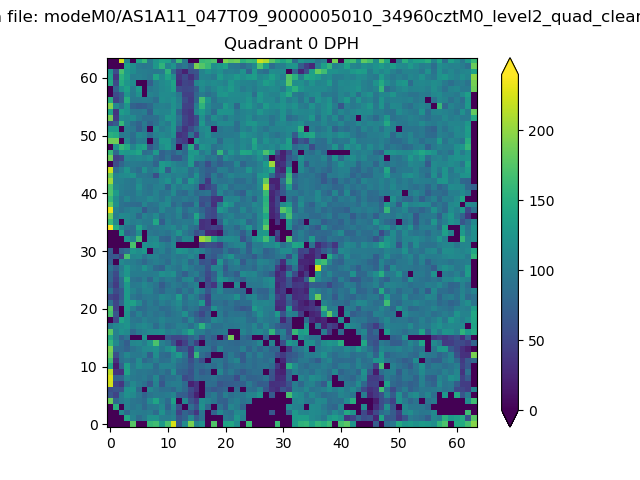 |
 |
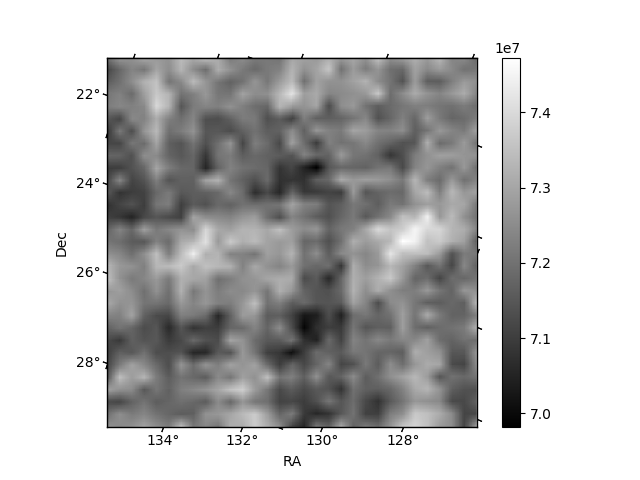
Quadrant B |
|---|---|---|---|
| Quadrant D | 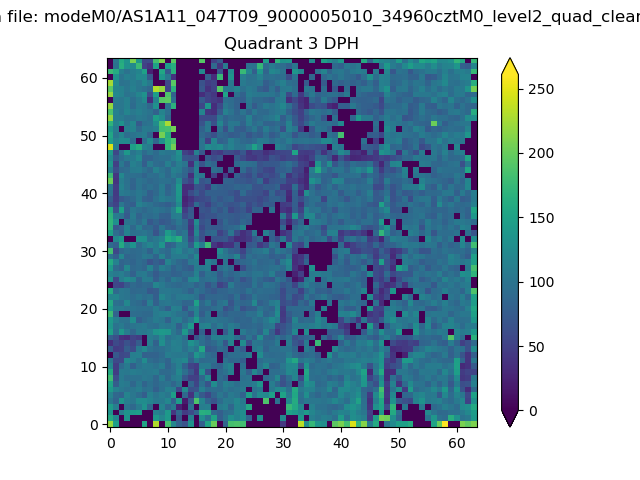 |
 |
Quadrant C |
| Plot type | Count rate plots | Images |
|---|---|---|
| Comparison with Poisson distribution Blue bars denote a histogram of data divided into 1 sec bins. Red curve is a Poisson curve with rate = median count rate of data. |
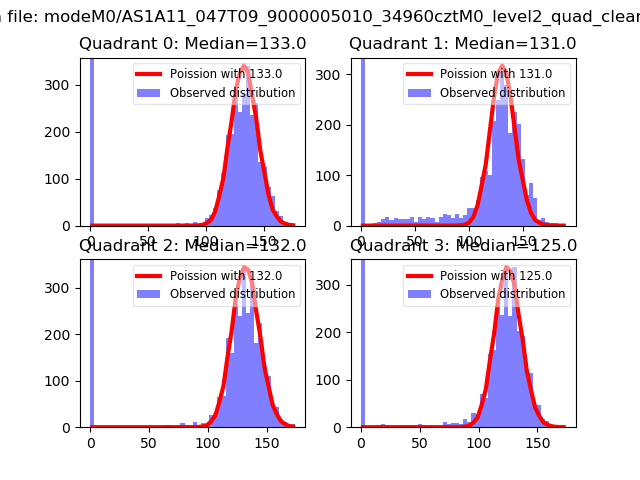 |
 |
| Quadrant-wise count rates Data is divided into 100 sec bins |
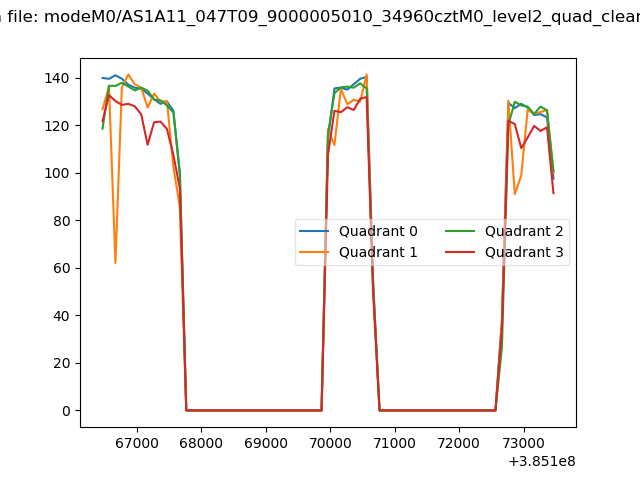 |
|
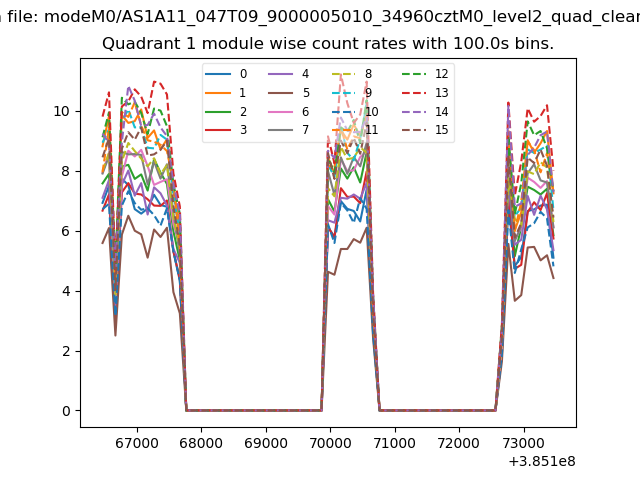
| Module-wise count rates for Quadrant A Data is divided into 100 sec bins |
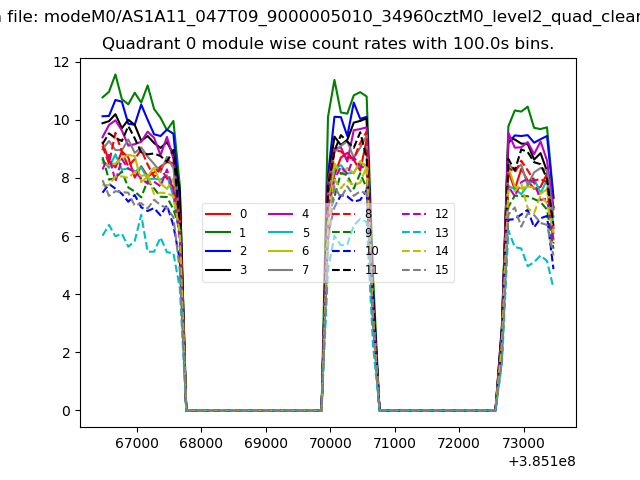 |
 |
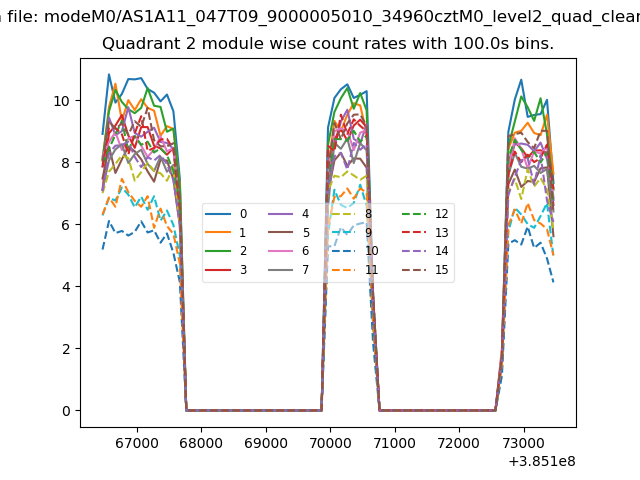
| Module-wise count rates for Quadrant B Data is divided into 100 sec bins |
 |
 |
| Module-wise count rates for Quadrant C Data is divided into 100 sec bins |
 |
 |
| Module-wise count rates for Quadrant D Data is divided into 100 sec bins |
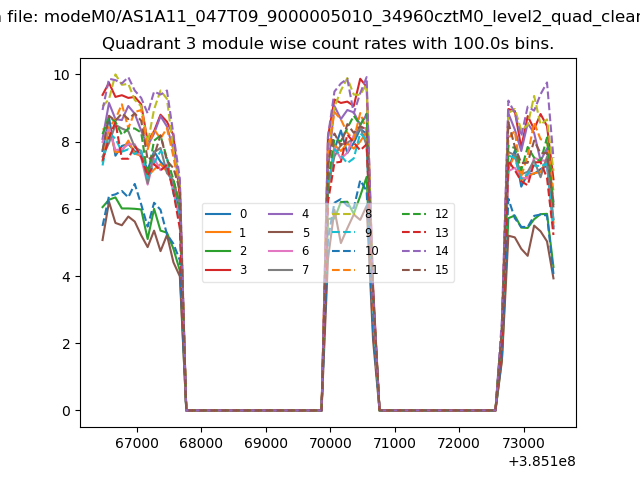 |
 |
| Parameter | Plot |
|---|---|
| CZT HV Monitor | 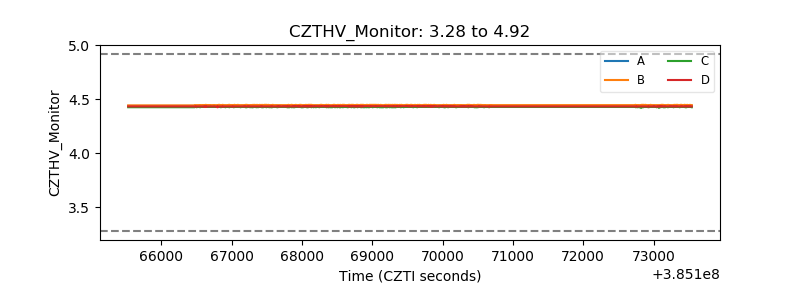 |
| D_VDD | 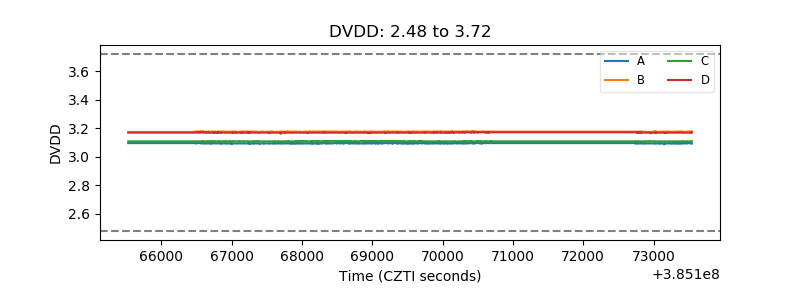 |
| Temperature 1 | 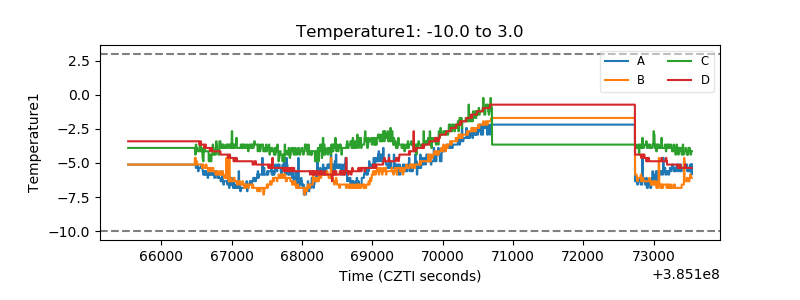 |
| Veto HV Monitor | 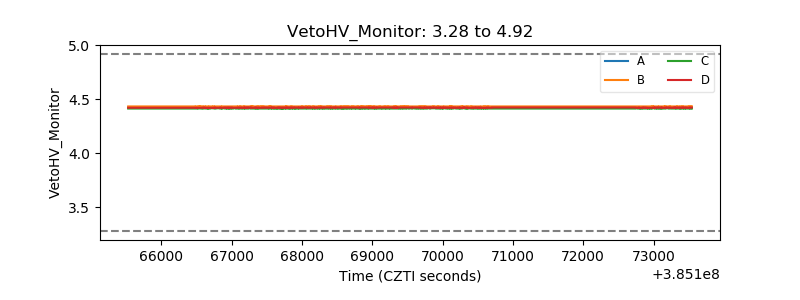 |
| Veto LLD | 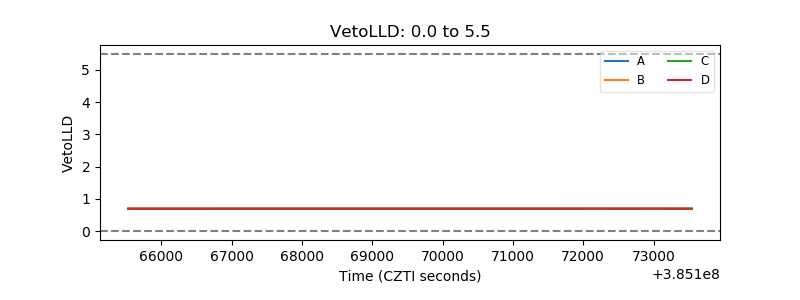 |
| Alpha Counter | 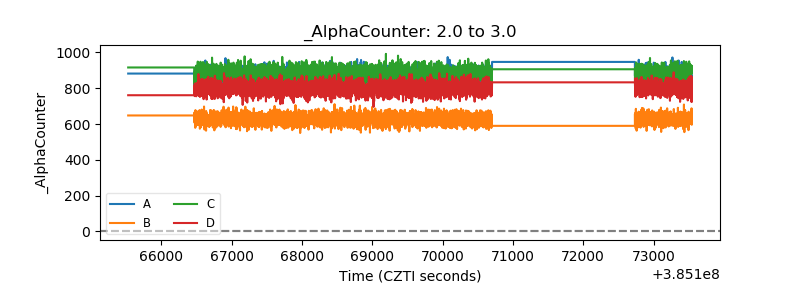 |
| _CPM_Rate | 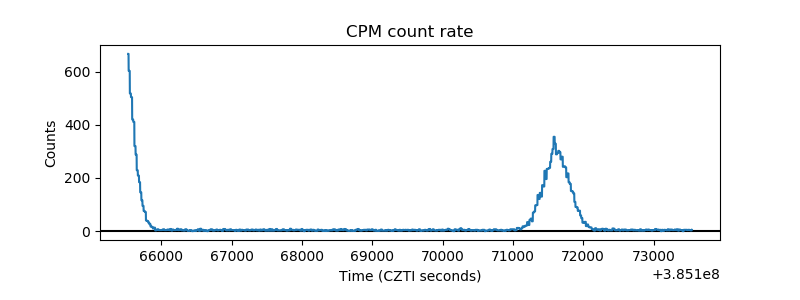 |
| CZT Counter |  |
| +2.5 Volts monitor | 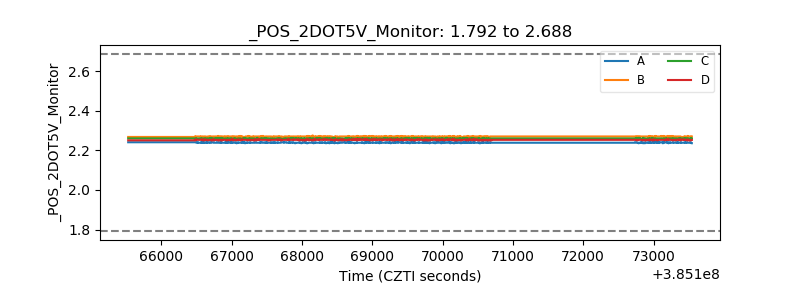 |
| +5 Volts monitor | 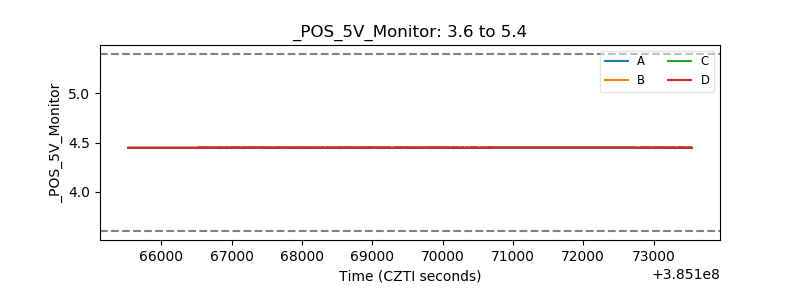 |
| _ROLL_ROT | 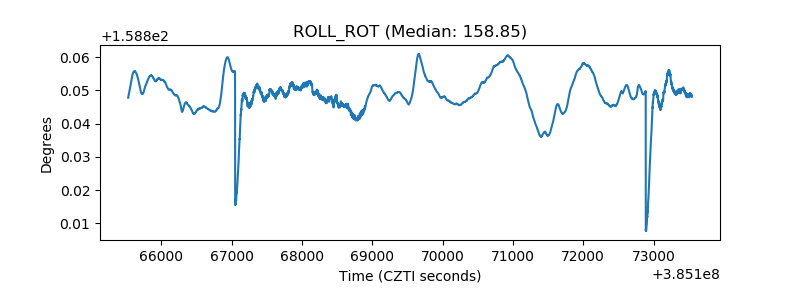 |
| _Roll_DEC | 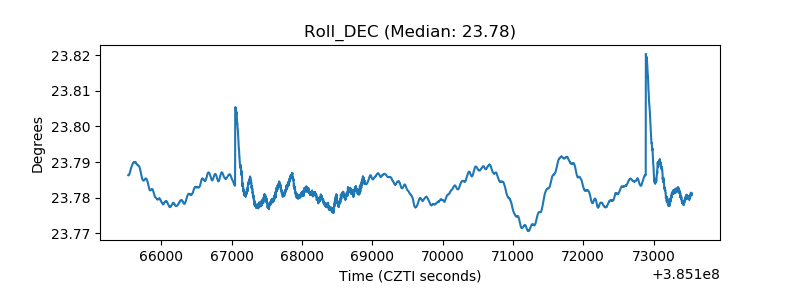 |
| _Roll_RA | 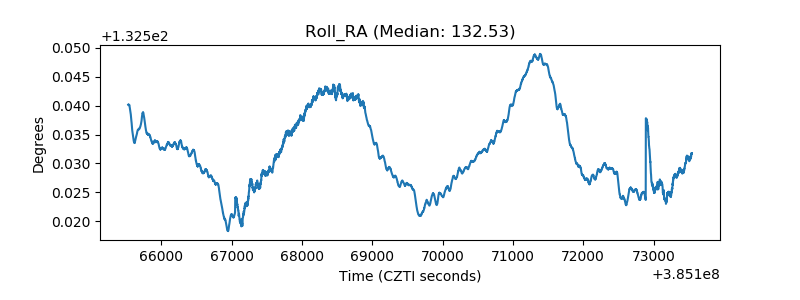 |
| Veto Counter | 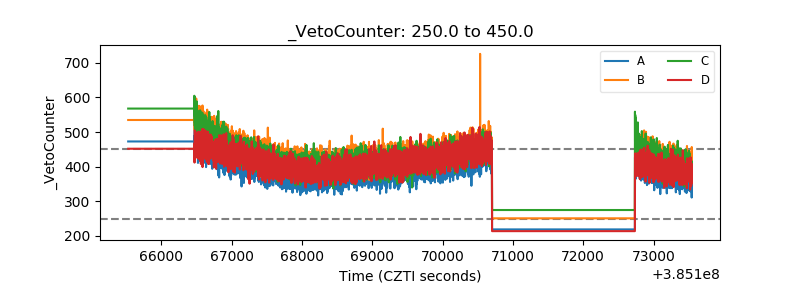 |