| Param | Original file | Final file |
|---|---|---|
| Filename | modeM0/AS1A11_047T09_9000005010_34959cztM0_level2.evt | modeM0/AS1A11_047T09_9000005010_34959cztM0_level2_quad_clean.evt |
| Size (bytes) | 404,881,920 | 60,554,880 |
| Size | 386.1 MB | 57.7 MB |
| Events in quadrant A | 2,375,618 | 384,156 |
| Events in quadrant B | 3,216,159 | 375,062 |
| Events in quadrant C | 2,758,949 | 375,394 |
| Events in quadrant D | 3,573,907 | 350,627 |
| Mode SS | |||
|---|---|---|---|
| Quadrant | BADHDUFLAG | Total packets | Discarded packets |
| A | 0 | 102 | 0 |
| B | 0 | 102 | 0 |
| C | 0 | 102 | 0 |
| D | 0 | 102 | 0 |
| Mode M0 | |||
|---|---|---|---|
| Quadrant | BADHDUFLAG | Total packets | Discarded packets |
| A | 0 | 10194 | 3 |
| B | 0 | 12686 | 2 |
| C | 0 | 11042 | 2 |
| D | 0 | 13852 | 2 |
| Mode M9 | |||
|---|---|---|---|
| Quadrant | BADHDUFLAG | Total packets | Discarded packets |
| A | 0 | 32 | 0 |
| B | 0 | 32 | 0 |
| C | 0 | 32 | 0 |
| D | 0 | 33 | 0 |
| Quadrant | Total seconds | Saturated seconds | Saturation percentage |
|---|---|---|---|
| A | 4961 | 3 | 0.060472% |
| B | 4961 | 251 | 5.059464% |
| C | 4961 | 80 | 1.612578% |
| D | 4961 | 103 | 2.076194% |
Noise dominated data is calculated using 1-second bins in cleaned event files. If a bin has >2000 counts, and if more than 50% of those come from <1% of pixels, then it is considered to be noise-dominated and hence unusable.
| Quadrant | # 1 sec bins | Bins with >0 counts | Bins with >2000 counts | High rate bins dominated by noise | Noise dominated (total time) | Noise dominated (detector-on time) | Marked lightcurve |
|---|---|---|---|---|---|---|---|
| A | 7083 | 4962 | 0 | 0 | 0.00% | 0.00% | 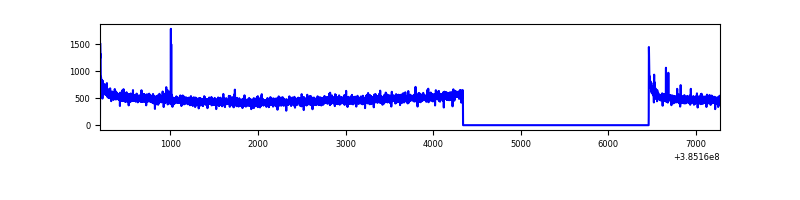 |
| B | 7083 | 4962 | 208 | 208 | 2.94% | 4.19% | 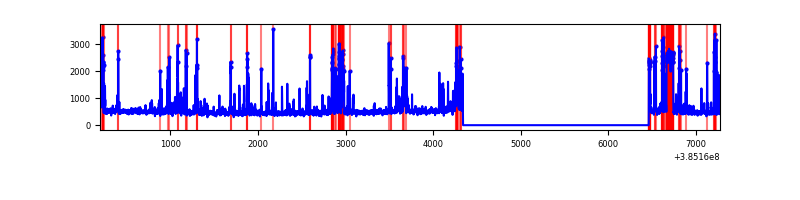 |
| C | 7083 | 4962 | 69 | 69 | 0.97% | 1.39% | 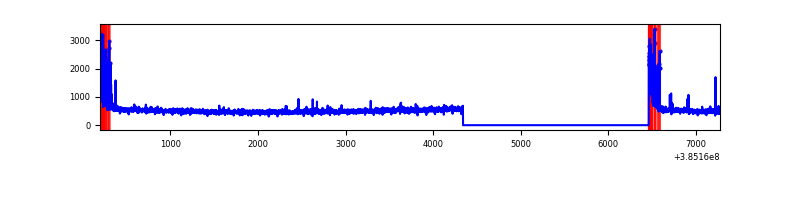 |
| D | 7083 | 4962 | 99 | 99 | 1.40% | 2.00% | 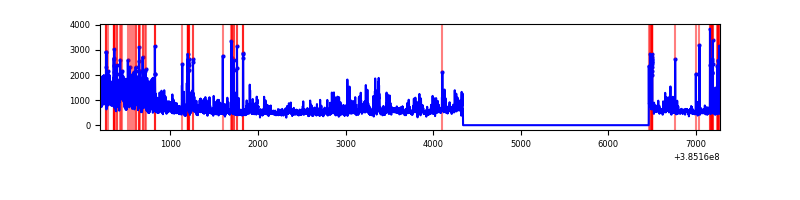 |
Top three noisy pixels from each quadrant. If the there are fewer than three noisy pixels in the level2.evt file, extra rows are filled as -1
| Pixel properties | Quadrant properties | ||||||
|---|---|---|---|---|---|---|---|
| Quadrant | DetID | PixID | Counts | Sigma | Mean | Median | Sigma |
| A | 10 | 83 | 68817 | 573.54 | 591 | 582 | 119.0 |
| A | 13 | 254 | 9122 | 71.78 | 591 | 582 | 119.0 |
| A | 13 | 6 | 8648 | 67.8 | 591 | 582 | 119.0 |
| B | 5 | 172 | 890159 | 8063.28 | 578 | 563 | 110.3 |
| B | 4 | 232 | 37831 | 337.8 | 578 | 563 | 110.3 |
| B | 12 | 111 | 13355 | 115.95 | 578 | 563 | 110.3 |
| C | 0 | 10 | 267496 | 1992.33 | 575 | 579 | 134.0 |
| C | 15 | 214 | 210603 | 1567.67 | 575 | 579 | 134.0 |
| C | 14 | 67 | 17236 | 124.33 | 575 | 579 | 134.0 |
| D | 8 | 195 | 944026 | 6813.95 | 568 | 554 | 138.5 |
| D | 13 | 249 | 194965 | 1404.07 | 568 | 554 | 138.5 |
| D | 10 | 118 | 63494 | 454.56 | 568 | 554 | 138.5 |
Histogram calculated using DETX and DETY for each event in the final _common_clean file
| Quadrant A | 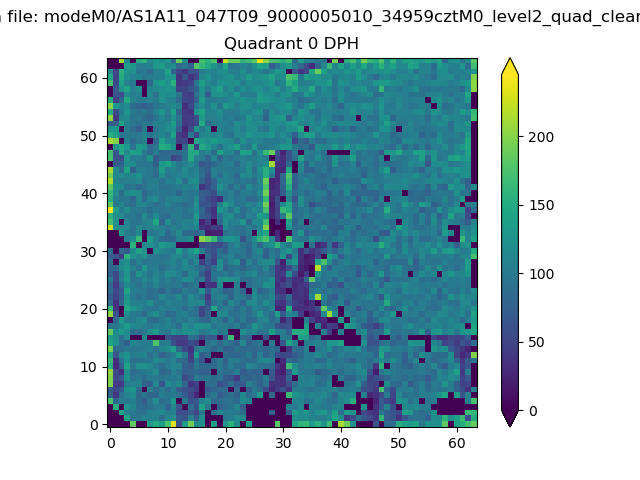 |
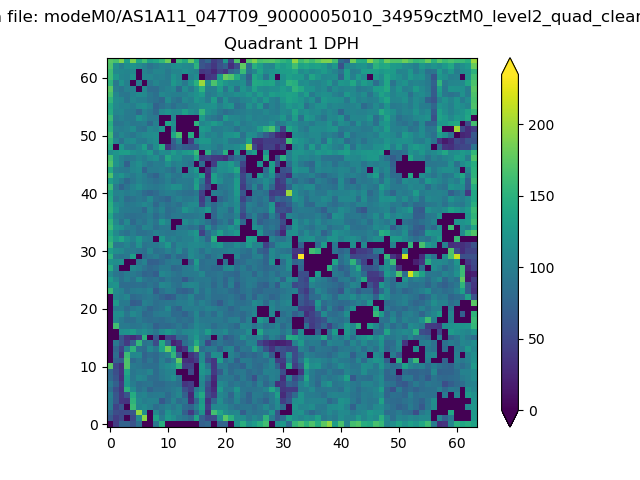 |
Quadrant B |
|---|---|---|---|
| Quadrant D | 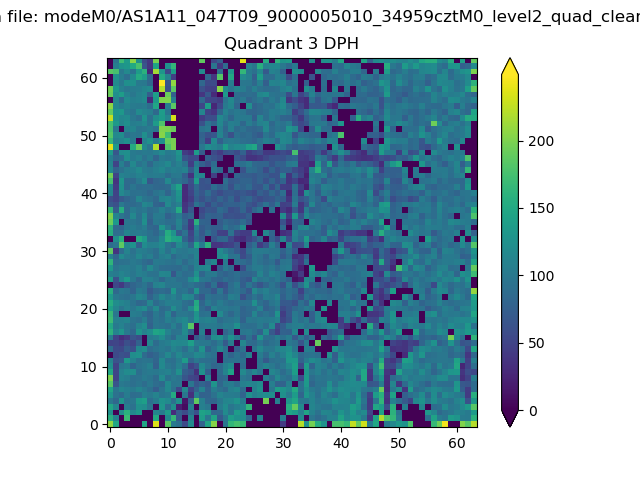 |
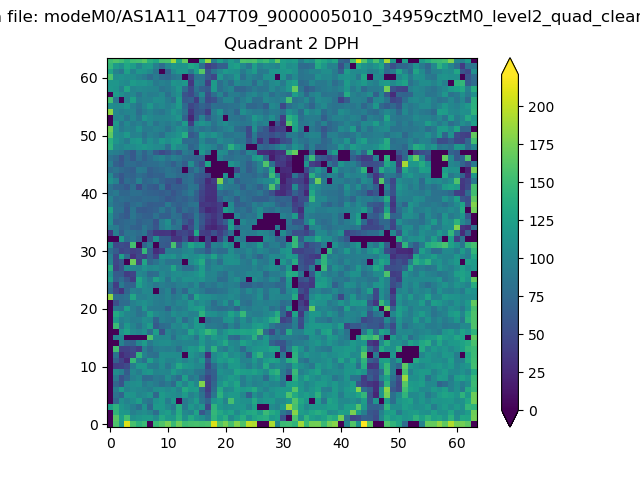 |
Quadrant C |
| Plot type | Count rate plots | Images |
|---|---|---|
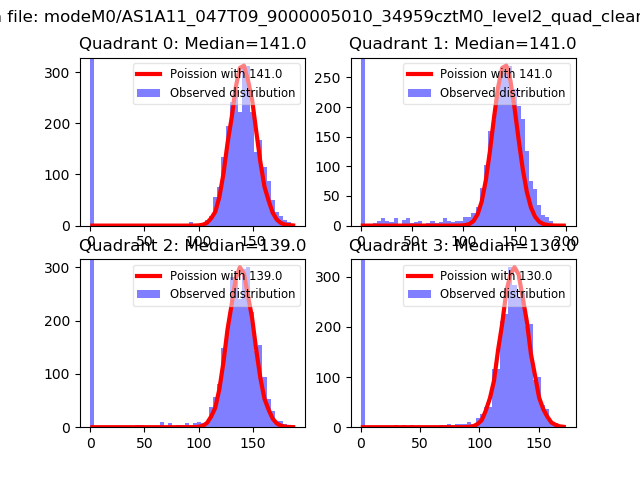
| Comparison with Poisson distribution Blue bars denote a histogram of data divided into 1 sec bins. Red curve is a Poisson curve with rate = median count rate of data. |
 |
 |
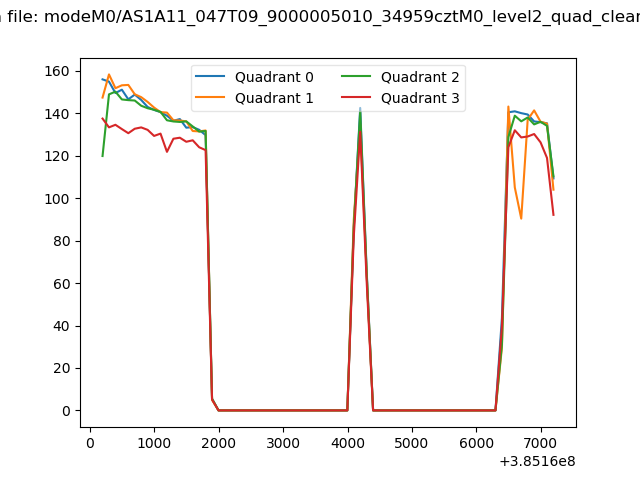
| Quadrant-wise count rates Data is divided into 100 sec bins |
 |
|
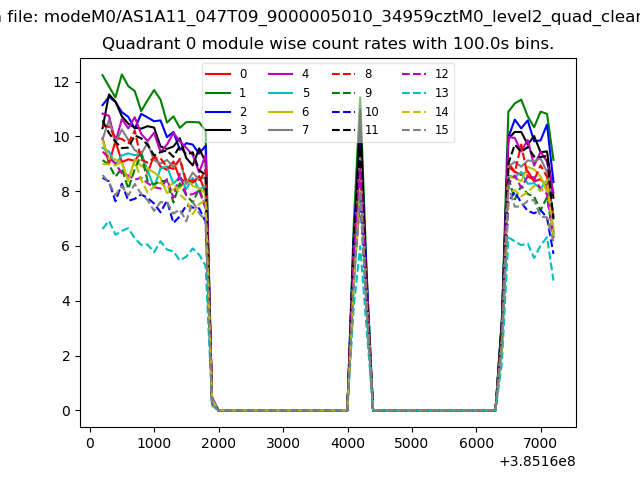
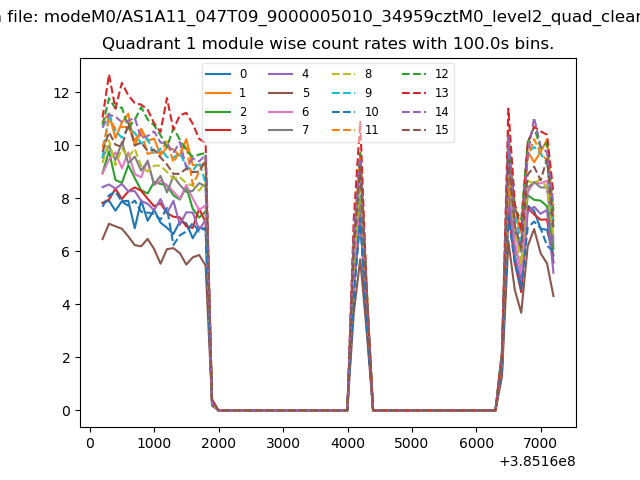
| Module-wise count rates for Quadrant A Data is divided into 100 sec bins |
 |
 |
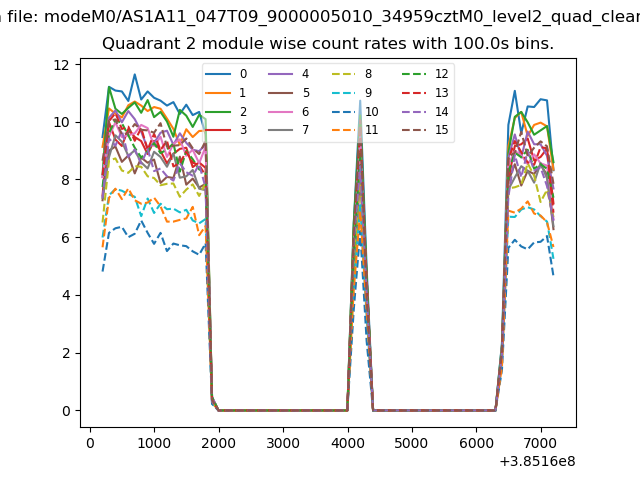
| Module-wise count rates for Quadrant B Data is divided into 100 sec bins |
 |
 |
| Module-wise count rates for Quadrant C Data is divided into 100 sec bins |
 |
 |
| Module-wise count rates for Quadrant D Data is divided into 100 sec bins |
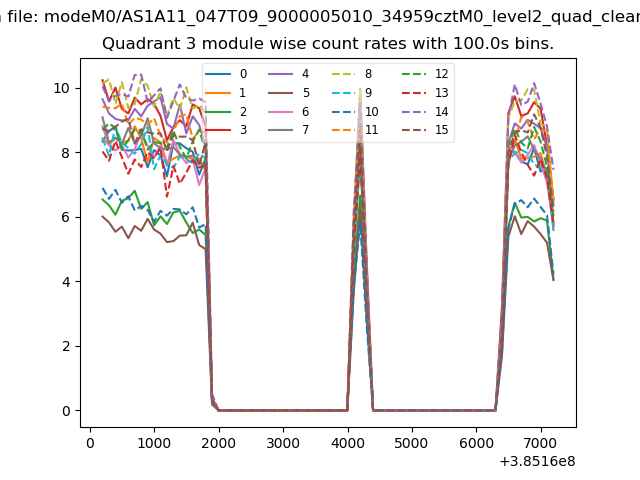 |
 |
| Parameter | Plot |
|---|---|
| CZT HV Monitor | 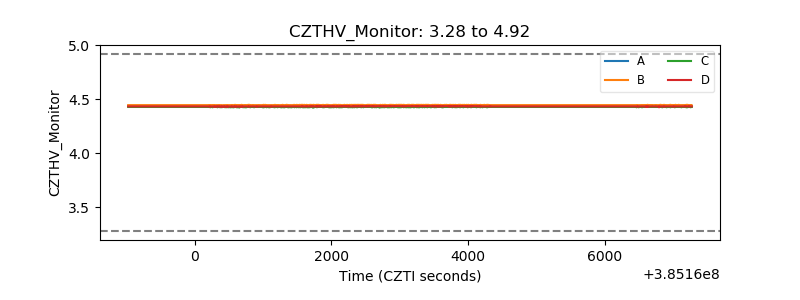 |
| D_VDD | 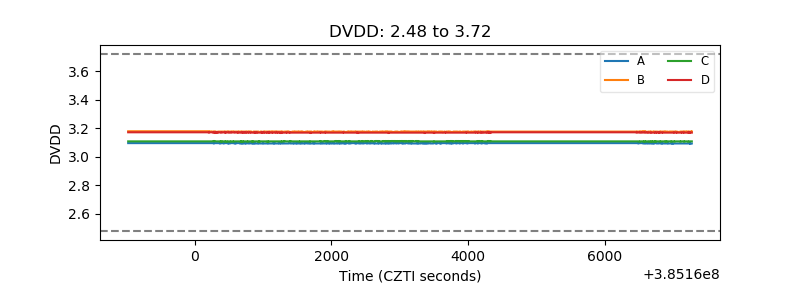 |
| Temperature 1 | 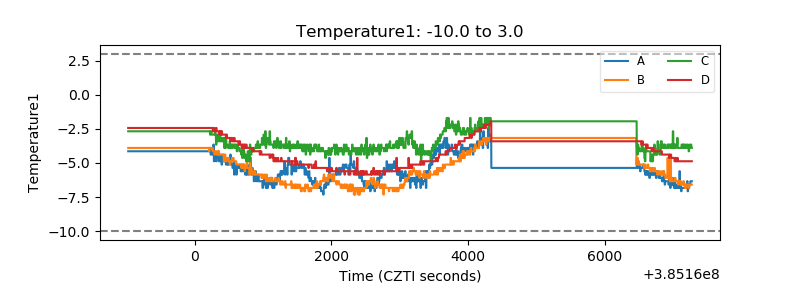 |
| Veto HV Monitor | 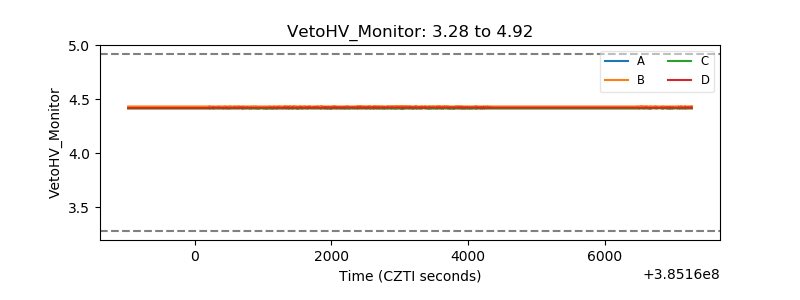 |
| Veto LLD | 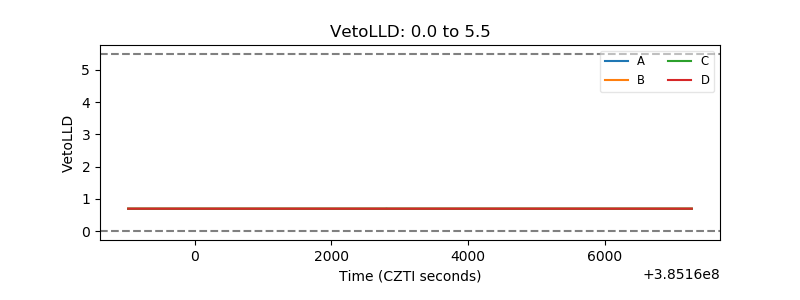 |
| Alpha Counter | 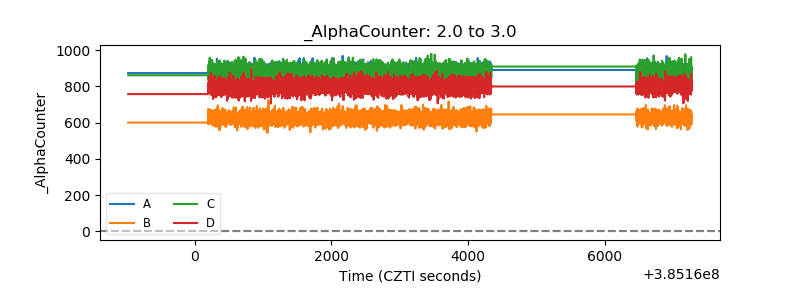 |
| _CPM_Rate | 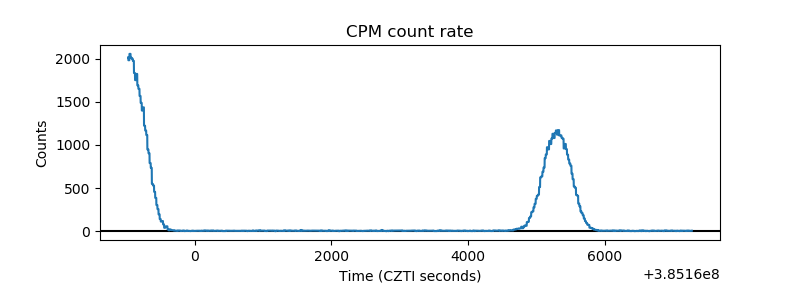 |
| CZT Counter | 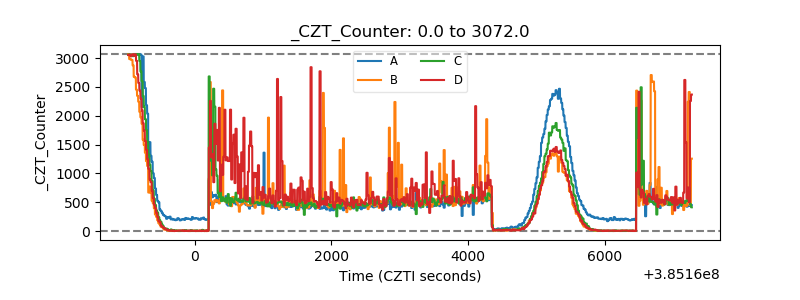 |
| +2.5 Volts monitor | 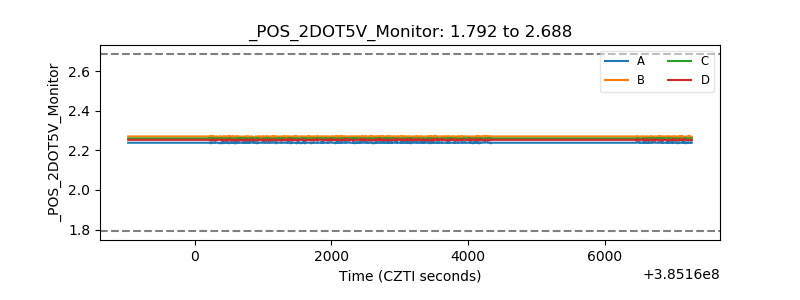 |
| +5 Volts monitor | 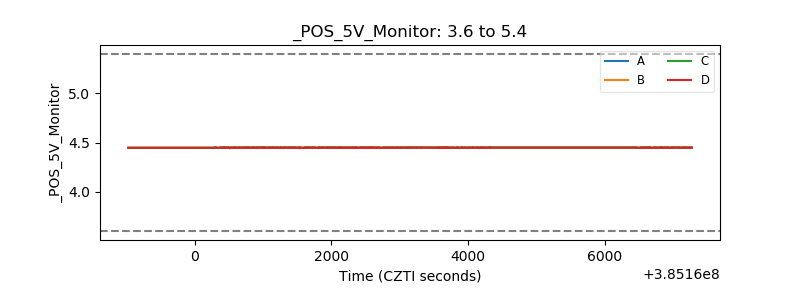 |
| _ROLL_ROT |  |
| _Roll_DEC | 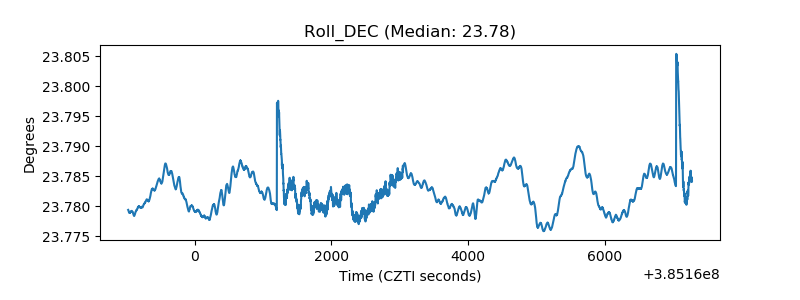 |
| _Roll_RA | 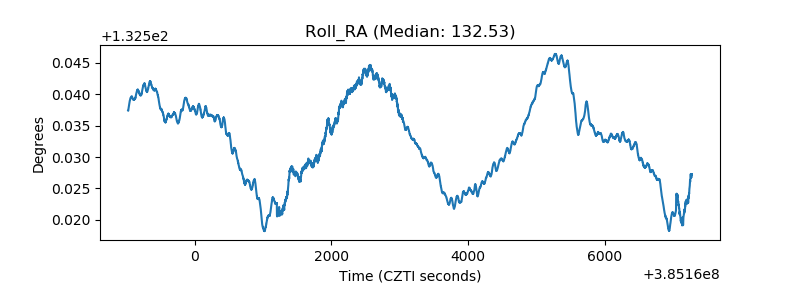 |
| Veto Counter | 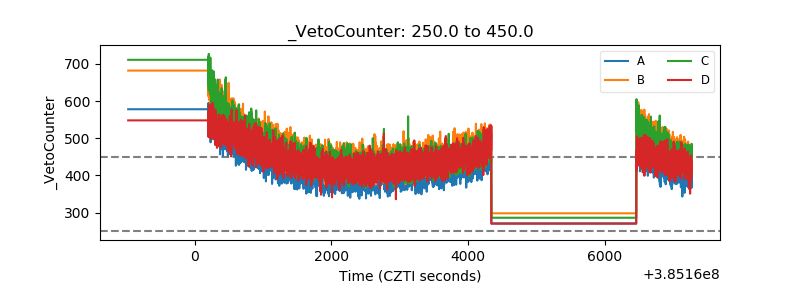 |