| Param | Original file | Final file |
|---|---|---|
| Filename | modeM0/AS1A11_047T09_9000005010_34953cztM0_level2.evt | modeM0/AS1A11_047T09_9000005010_34953cztM0_level2_quad_clean.evt |
| Size (bytes) | 496,632,960 | 88,655,040 |
| Size | 473.6 MB | 84.5 MB |
| Events in quadrant A | 2,669,924 | 593,802 |
| Events in quadrant B | 4,073,016 | 576,685 |
| Events in quadrant C | 3,006,562 | 584,135 |
| Events in quadrant D | 4,906,847 | 533,718 |
| Mode SS | |||
|---|---|---|---|
| Quadrant | BADHDUFLAG | Total packets | Discarded packets |
| A | 0 | 116 | 0 |
| B | 0 | 116 | 0 |
| C | 0 | 116 | 0 |
| D | 0 | 116 | 0 |
| Mode M0 | |||
|---|---|---|---|
| Quadrant | BADHDUFLAG | Total packets | Discarded packets |
| A | 0 | 11675 | 3 |
| B | 0 | 15814 | 2 |
| C | 0 | 12308 | 2 |
| D | 0 | 18583 | 2 |
| Mode M9 | |||
|---|---|---|---|
| Quadrant | BADHDUFLAG | Total packets | Discarded packets |
| A | 0 | 24 | 0 |
| B | 0 | 24 | 0 |
| C | 0 | 24 | 0 |
| D | 0 | 25 | 0 |
| Quadrant | Total seconds | Saturated seconds | Saturation percentage |
|---|---|---|---|
| A | 5663 | 6 | 0.105951% |
| B | 5663 | 411 | 7.257637% |
| C | 5663 | 67 | 1.183118% |
| D | 5663 | 359 | 6.339396% |
Noise dominated data is calculated using 1-second bins in cleaned event files. If a bin has >2000 counts, and if more than 50% of those come from <1% of pixels, then it is considered to be noise-dominated and hence unusable.
| Quadrant | # 1 sec bins | Bins with >0 counts | Bins with >2000 counts | High rate bins dominated by noise | Noise dominated (total time) | Noise dominated (detector-on time) | Marked lightcurve |
|---|---|---|---|---|---|---|---|
| A | 7305 | 5664 | 0 | 0 | 0.00% | 0.00% | 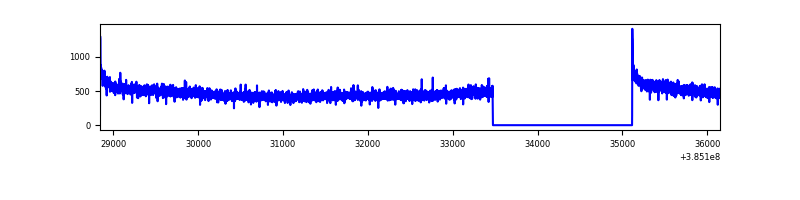 |
| B | 7305 | 5664 | 303 | 303 | 4.15% | 5.35% | 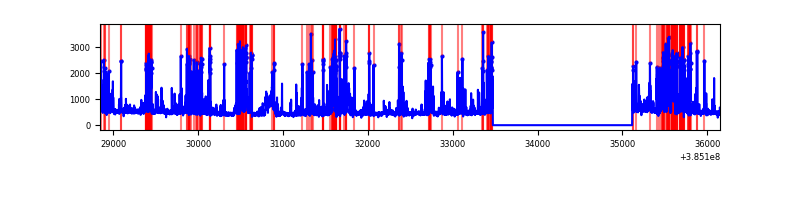 |
| C | 7305 | 5664 | 46 | 46 | 0.63% | 0.81% | 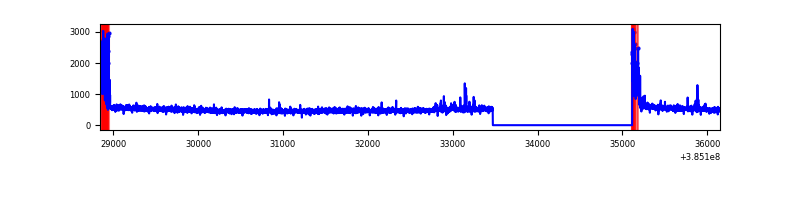 |
| D | 7305 | 5664 | 321 | 321 | 4.39% | 5.67% | 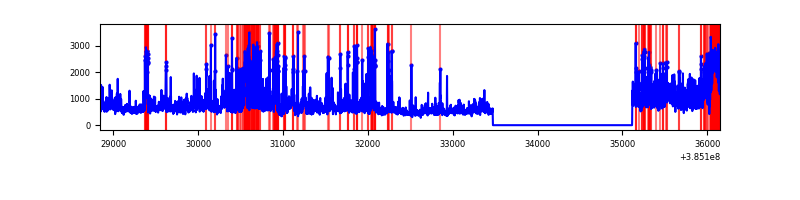 |
Top three noisy pixels from each quadrant. If the there are fewer than three noisy pixels in the level2.evt file, extra rows are filled as -1
| Pixel properties | Quadrant properties | ||||||
|---|---|---|---|---|---|---|---|
| Quadrant | DetID | PixID | Counts | Sigma | Mean | Median | Sigma |
| A | 10 | 83 | 69786 | 514.18 | 670 | 658 | 134.4 |
| A | 13 | 254 | 9762 | 67.72 | 670 | 658 | 134.4 |
| A | 13 | 6 | 8991 | 61.98 | 670 | 658 | 134.4 |
| B | 5 | 172 | 1173033 | 9287.95 | 644 | 627 | 126.2 |
| B | 4 | 232 | 170672 | 1347.12 | 644 | 627 | 126.2 |
| B | 0 | 190 | 139897 | 1103.32 | 644 | 627 | 126.2 |
| C | 15 | 214 | 237822 | 1580.9 | 643 | 647 | 150.0 |
| C | 0 | 10 | 219615 | 1459.54 | 643 | 647 | 150.0 |
| C | 5 | 4 | 19685 | 126.9 | 643 | 647 | 150.0 |
| D | 8 | 195 | 1007377 | 6408.38 | 636 | 618 | 157.1 |
| D | 10 | 118 | 298580 | 1896.63 | 636 | 618 | 157.1 |
| D | 13 | 249 | 254427 | 1615.58 | 636 | 618 | 157.1 |
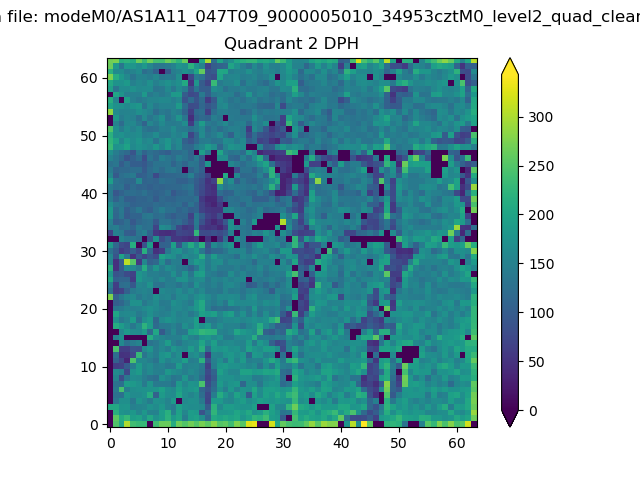
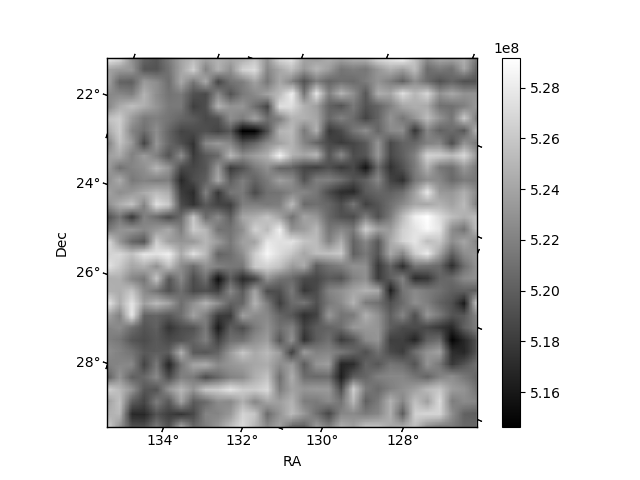
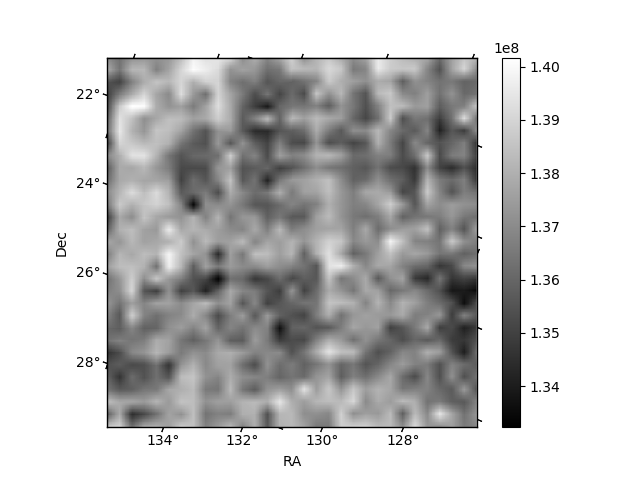
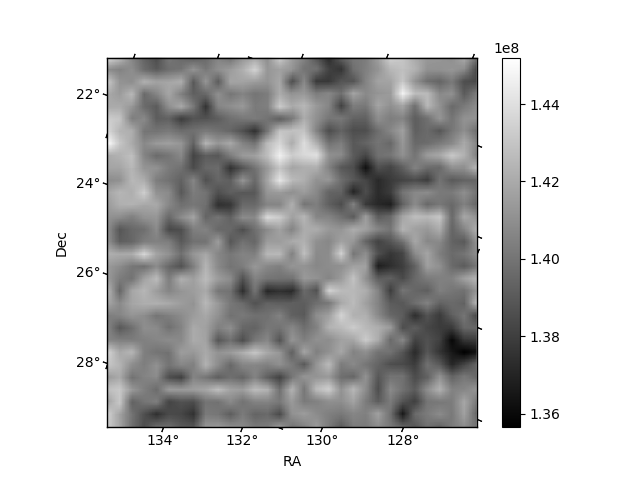
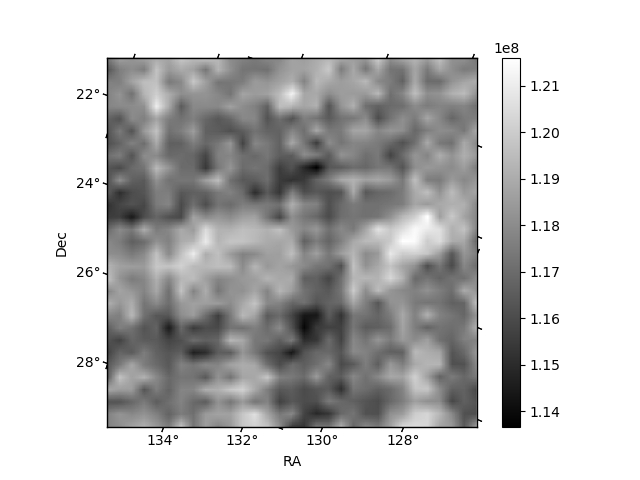
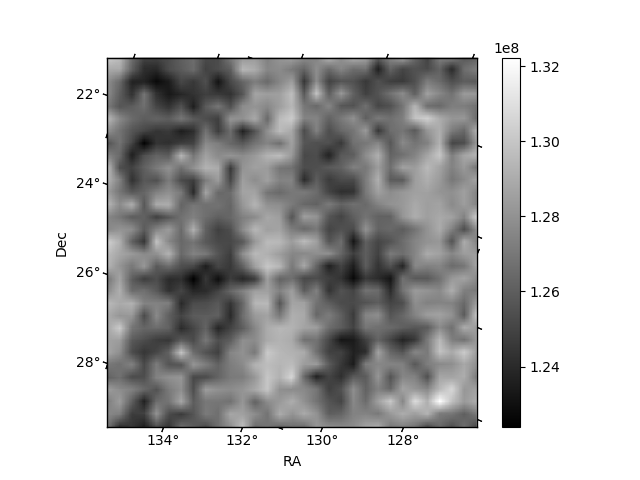
Histogram calculated using DETX and DETY for each event in the final _common_clean file
| Quadrant A | 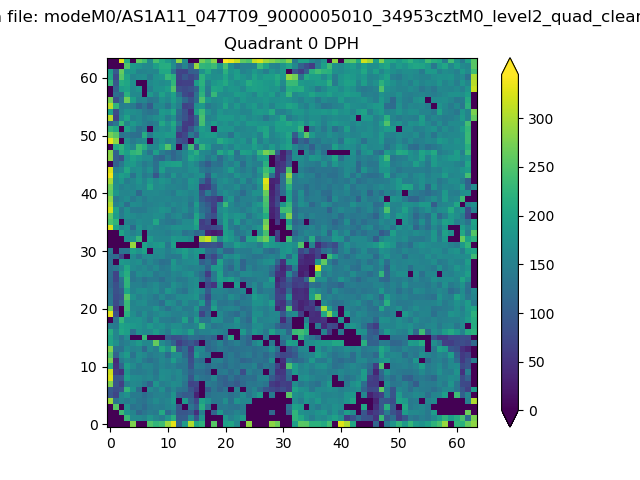 |
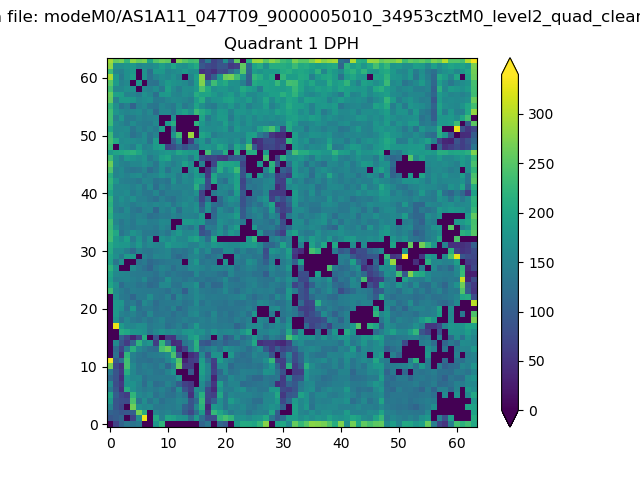 |
Quadrant B |
|---|---|---|---|
| Quadrant D | 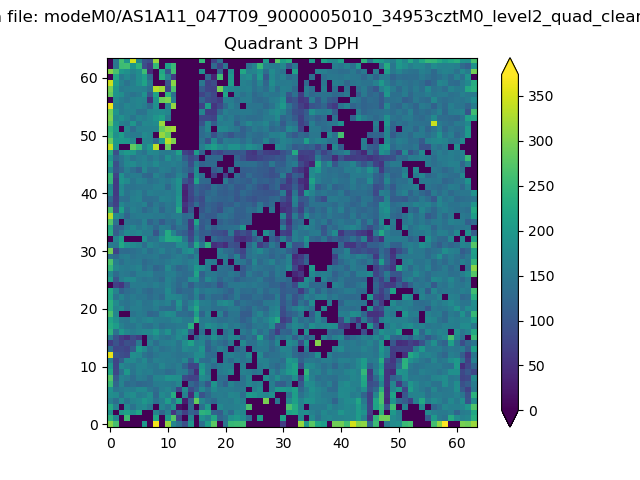 |
 |
Quadrant C |
| Plot type | Count rate plots | Images |
|---|---|---|
| Comparison with Poisson distribution Blue bars denote a histogram of data divided into 1 sec bins. Red curve is a Poisson curve with rate = median count rate of data. |
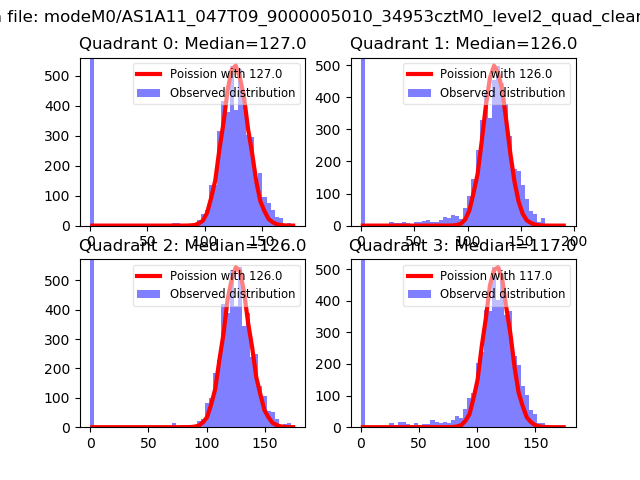 |
 |
| Quadrant-wise count rates Data is divided into 100 sec bins |
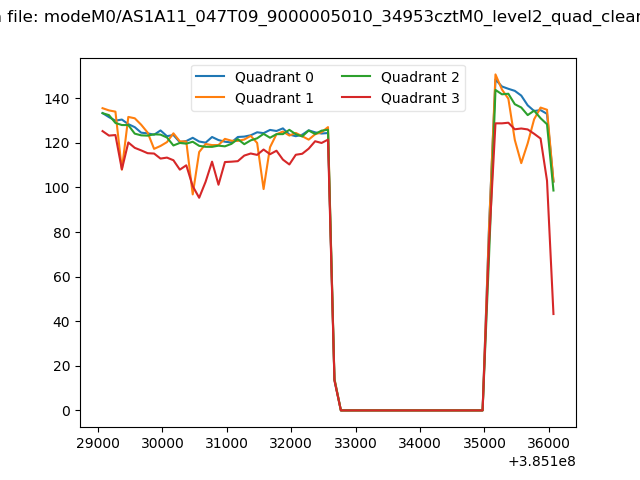 |
|
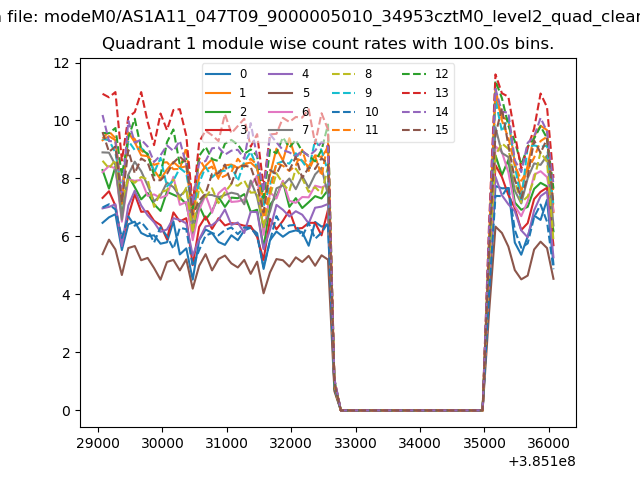
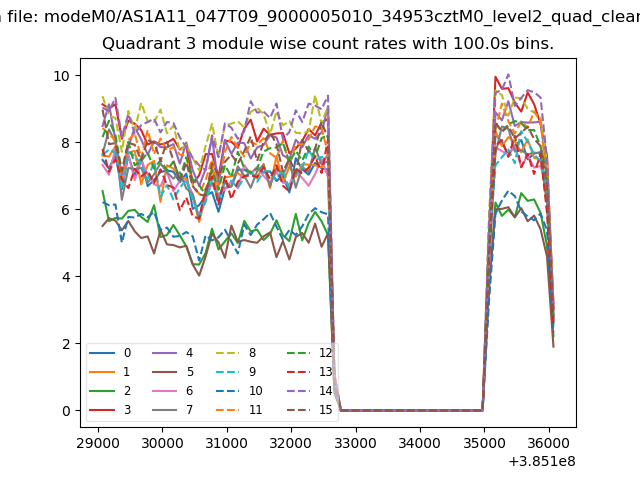
| Module-wise count rates for Quadrant A Data is divided into 100 sec bins |
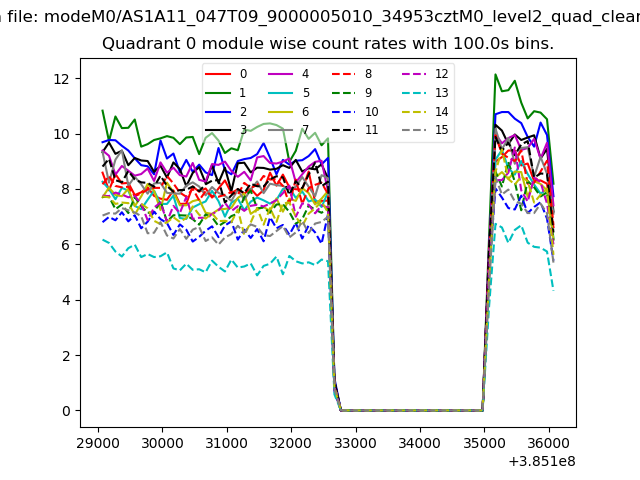 |
 |
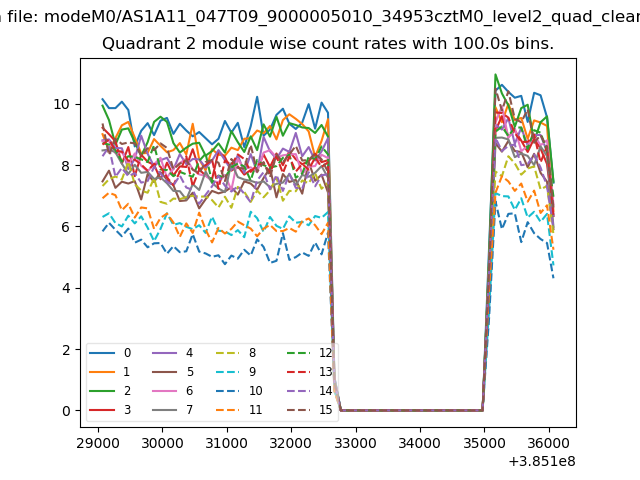
| Module-wise count rates for Quadrant B Data is divided into 100 sec bins |
 |
 |
| Module-wise count rates for Quadrant C Data is divided into 100 sec bins |
 |
 |
| Module-wise count rates for Quadrant D Data is divided into 100 sec bins |
 |
 |
| Parameter | Plot |
|---|---|
| CZT HV Monitor | 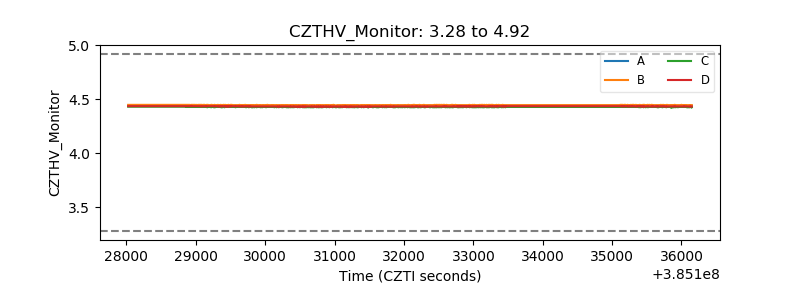 |
| D_VDD | 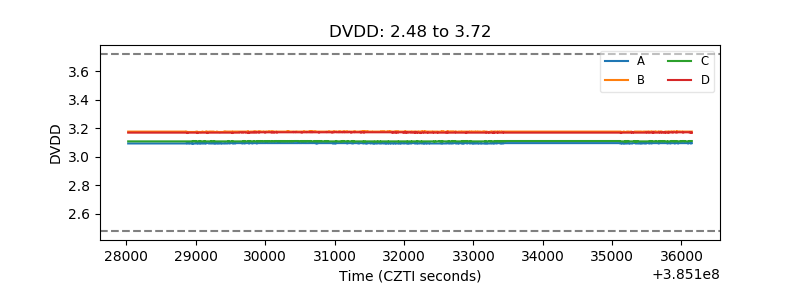 |
| Temperature 1 | 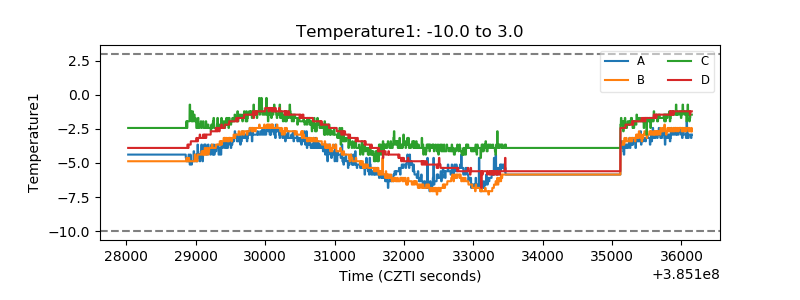 |
| Veto HV Monitor | 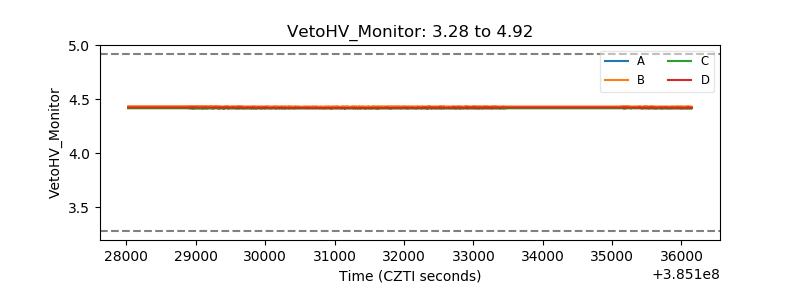 |
| Veto LLD | 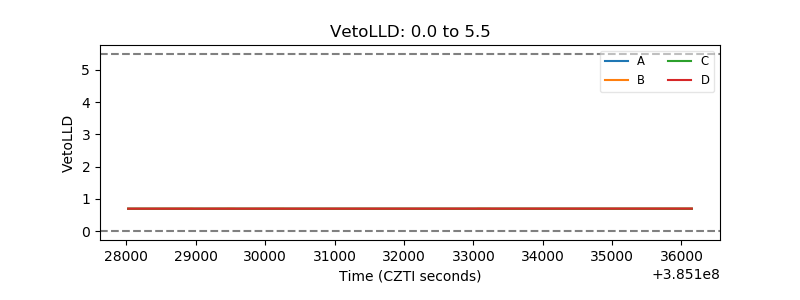 |
| Alpha Counter | 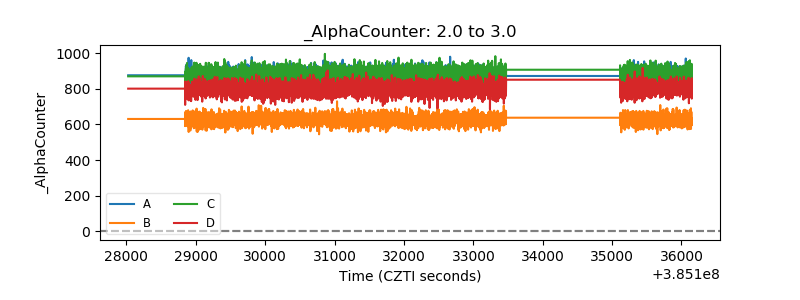 |
| _CPM_Rate | 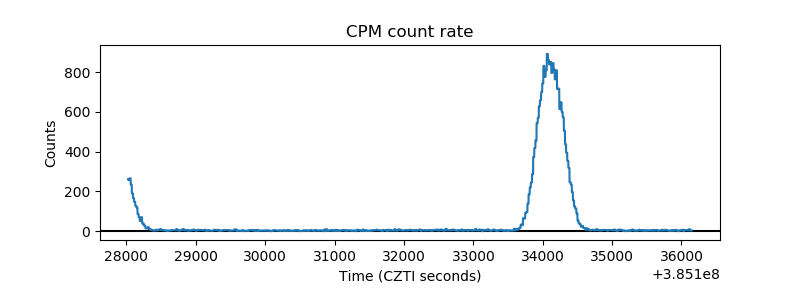 |
| CZT Counter | 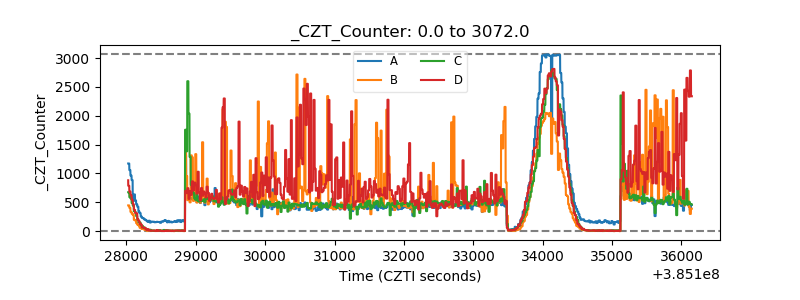 |
| +2.5 Volts monitor | 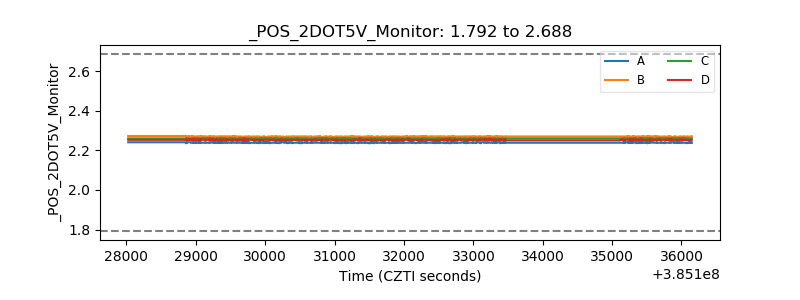 |
| +5 Volts monitor | 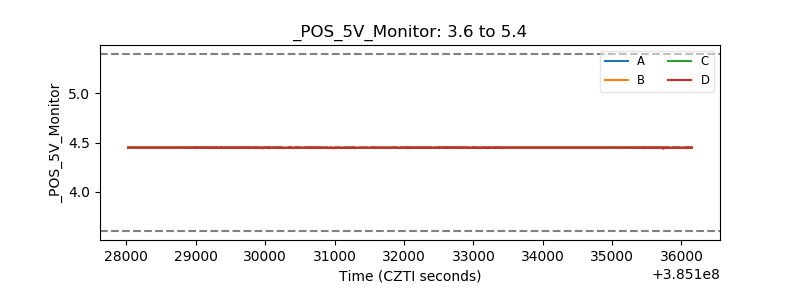 |
| _ROLL_ROT | 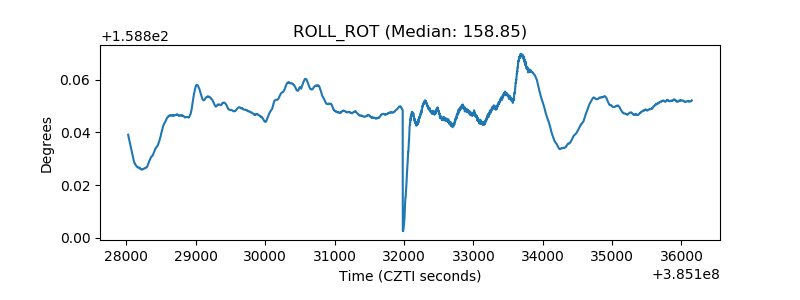 |
| _Roll_DEC | 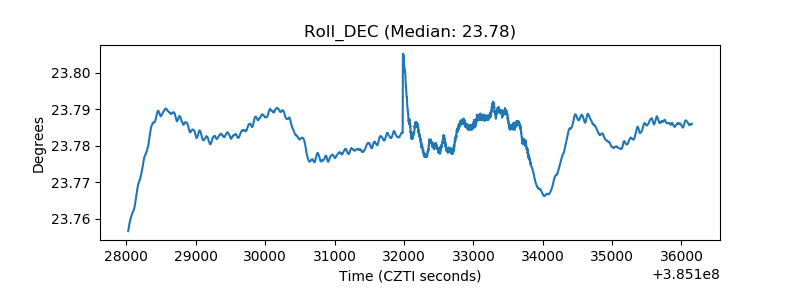 |
| _Roll_RA | 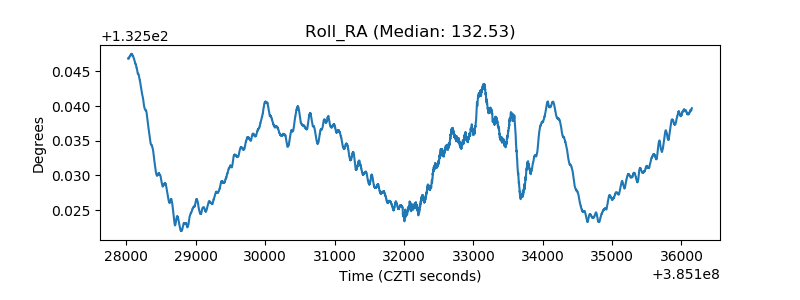 |
| Veto Counter | 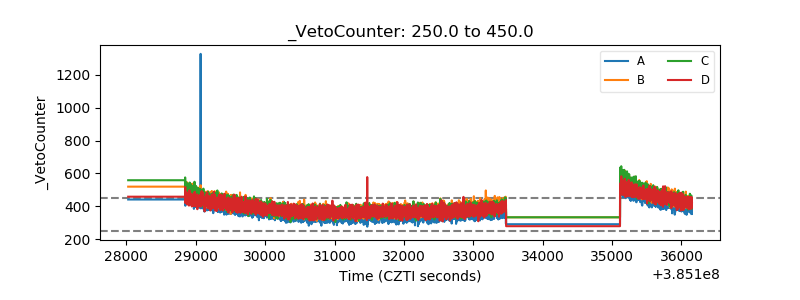 |