| Param | Original file | Final file |
|---|---|---|
| Filename | modeM0/AS1A11_047T09_9000005010_34949cztM0_level2.evt | modeM0/AS1A11_047T09_9000005010_34949cztM0_level2_quad_clean.evt |
| Size (bytes) | 794,200,320 | 57,962,880 |
| Size | 757.4 MB | 55.3 MB |
| Events in quadrant A | 10,002,348 | 173,185 |
| Events in quadrant B | 5,836,555 | 380,094 |
| Events in quadrant C | 3,182,650 | 404,412 |
| Events in quadrant D | 4,613,057 | 363,961 |
| Mode SS | |||
|---|---|---|---|
| Quadrant | BADHDUFLAG | Total packets | Discarded packets |
| A | 0 | 126 | 0 |
| B | 0 | 126 | 0 |
| C | 0 | 126 | 0 |
| D | 0 | 126 | 0 |
| Mode M0 | |||
|---|---|---|---|
| Quadrant | BADHDUFLAG | Total packets | Discarded packets |
| A | 0 | 33742 | 3 |
| B | 0 | 21527 | 2 |
| C | 0 | 13021 | 2 |
| D | 0 | 17898 | 2 |
| Mode M9 | |||
|---|---|---|---|
| Quadrant | BADHDUFLAG | Total packets | Discarded packets |
| A | 0 | 27 | 0 |
| B | 0 | 27 | 0 |
| C | 0 | 27 | 0 |
| D | 0 | 27 | 0 |
| Quadrant | Total seconds | Saturated seconds | Saturation percentage |
|---|---|---|---|
| A | 6188 | 3492 | 56.431803% |
| B | 6188 | 984 | 15.901745% |
| C | 6188 | 49 | 0.791855% |
| D | 6188 | 300 | 4.848093% |
Noise dominated data is calculated using 1-second bins in cleaned event files. If a bin has >2000 counts, and if more than 50% of those come from <1% of pixels, then it is considered to be noise-dominated and hence unusable.
| Quadrant | # 1 sec bins | Bins with >0 counts | Bins with >2000 counts | High rate bins dominated by noise | Noise dominated (total time) | Noise dominated (detector-on time) | Marked lightcurve |
|---|---|---|---|---|---|---|---|
| A | 8814 | 6188 | 3351 | 3351 | 38.02% | 54.15% | 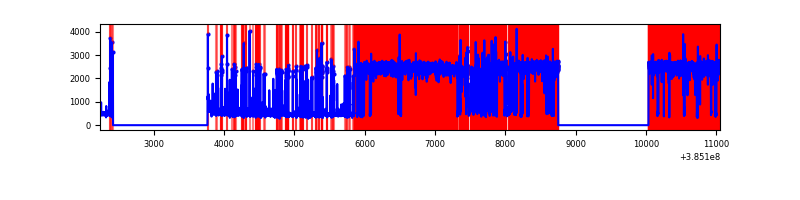 |
| B | 8815 | 6190 | 734 | 734 | 8.33% | 11.86% | 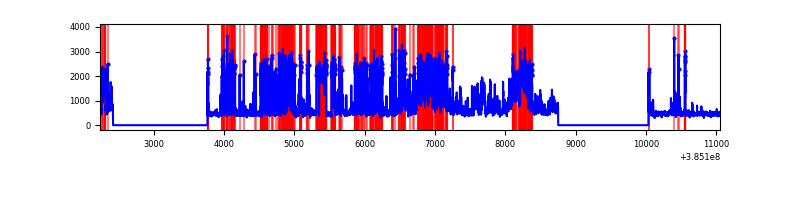 |
| C | 8815 | 6190 | 40 | 40 | 0.45% | 0.65% | 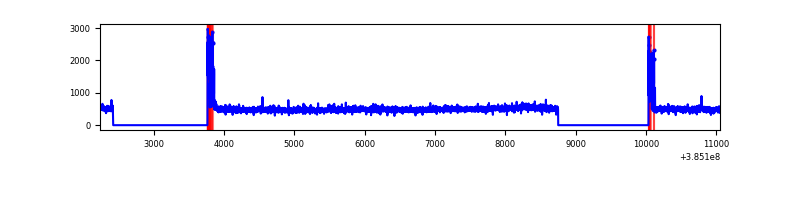 |
| D | 8815 | 6189 | 281 | 281 | 3.19% | 4.54% | 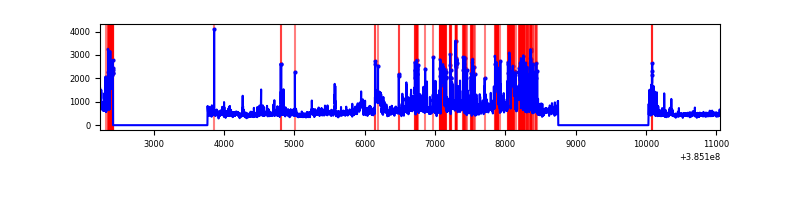 |
Top three noisy pixels from each quadrant. If the there are fewer than three noisy pixels in the level2.evt file, extra rows are filled as -1
| Pixel properties | Quadrant properties | ||||||
|---|---|---|---|---|---|---|---|
| Quadrant | DetID | PixID | Counts | Sigma | Mean | Median | Sigma |
| A | 15 | 169 | 8246680 | 93518.82 | 436 | 428 | 88.2 |
| A | 10 | 83 | 48442 | 544.52 | 436 | 428 | 88.2 |
| A | 13 | 254 | 6311 | 66.72 | 436 | 428 | 88.2 |
| B | 5 | 172 | 1959995 | 15349.17 | 661 | 644 | 127.7 |
| B | 5 | 31 | 603580 | 4723.28 | 661 | 644 | 127.7 |
| B | 5 | 15 | 386927 | 3026.06 | 661 | 644 | 127.7 |
| C | 15 | 214 | 259684 | 1609.69 | 693 | 698 | 160.9 |
| C | 0 | 10 | 176565 | 1093.07 | 693 | 698 | 160.9 |
| C | 14 | 67 | 32317 | 196.52 | 693 | 698 | 160.9 |
| D | 8 | 195 | 766456 | 4590.67 | 679 | 661 | 166.8 |
| D | 10 | 118 | 319091 | 1908.87 | 679 | 661 | 166.8 |
| D | 2 | 31 | 276861 | 1655.72 | 679 | 661 | 166.8 |
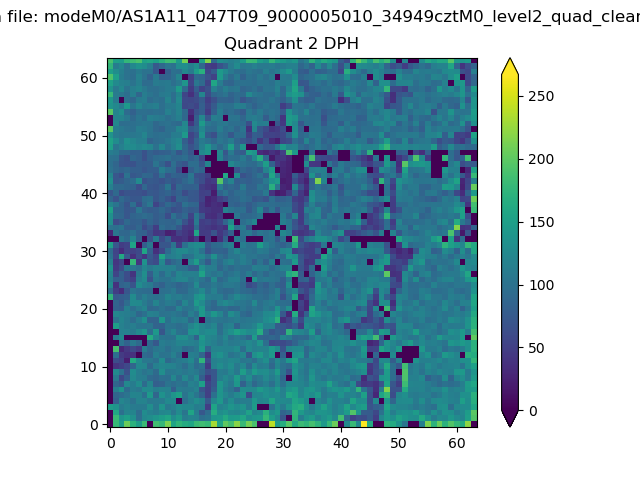
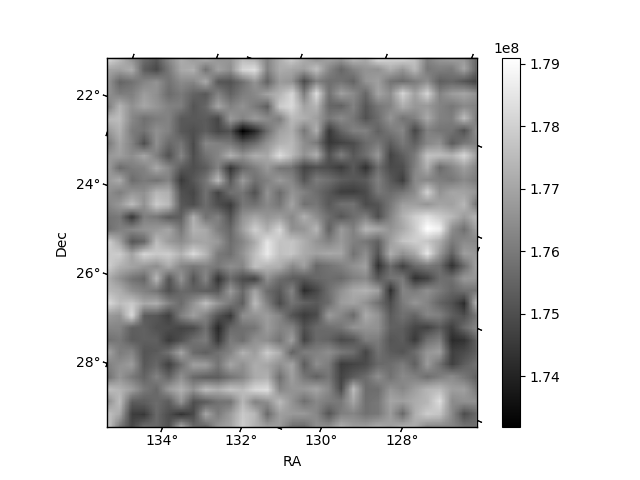
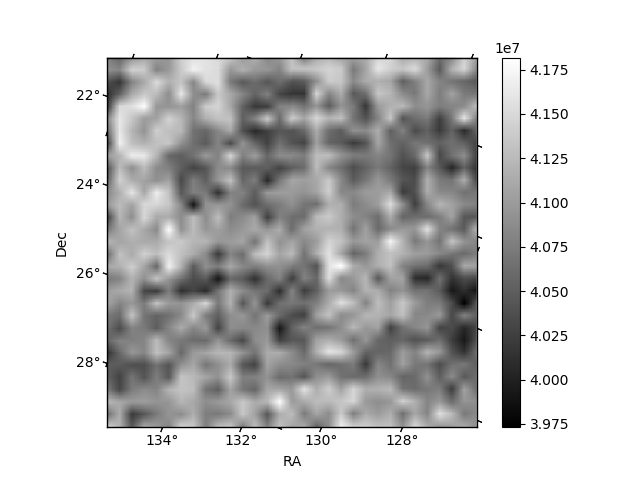
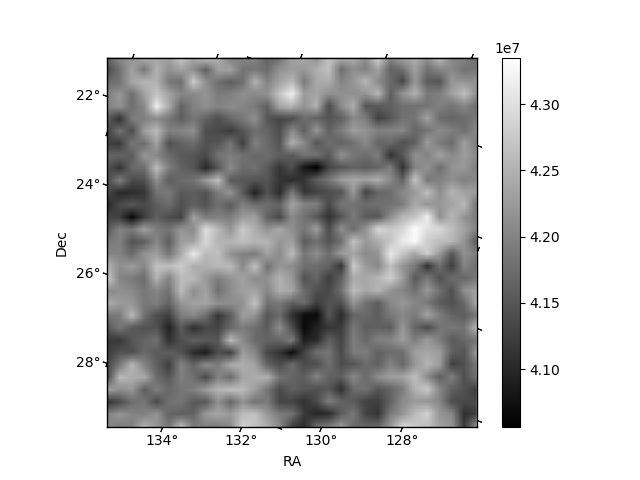
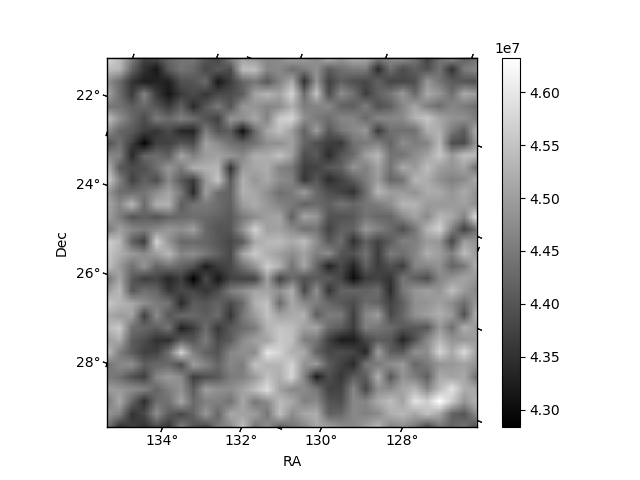
Histogram calculated using DETX and DETY for each event in the final _common_clean file
| Quadrant A | 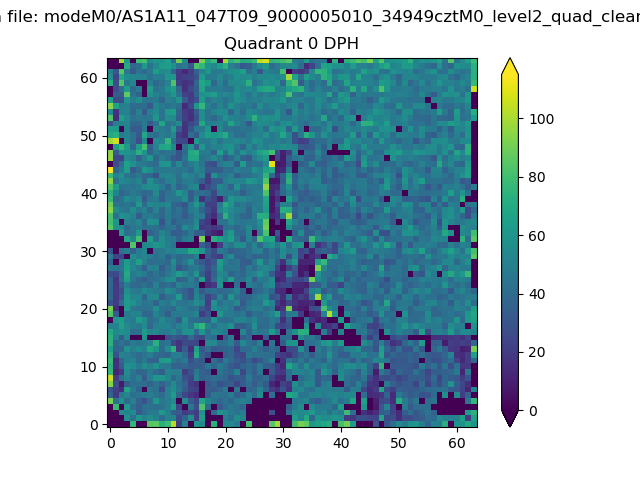 |
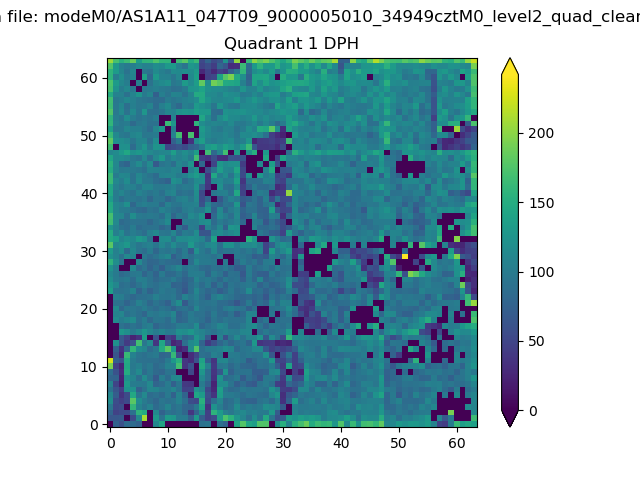 |
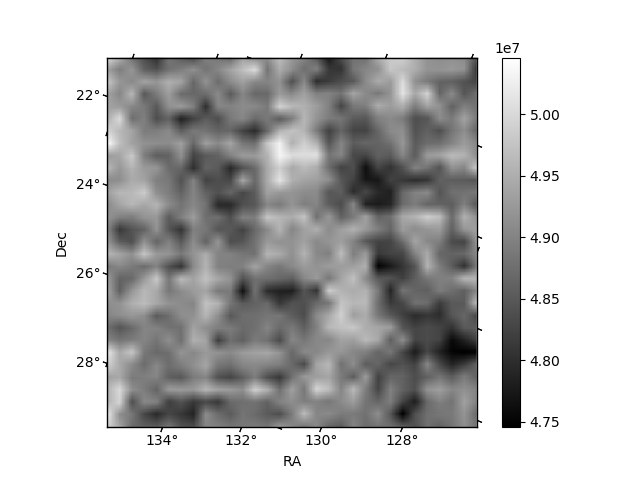
Quadrant B |
|---|---|---|---|
| Quadrant D | 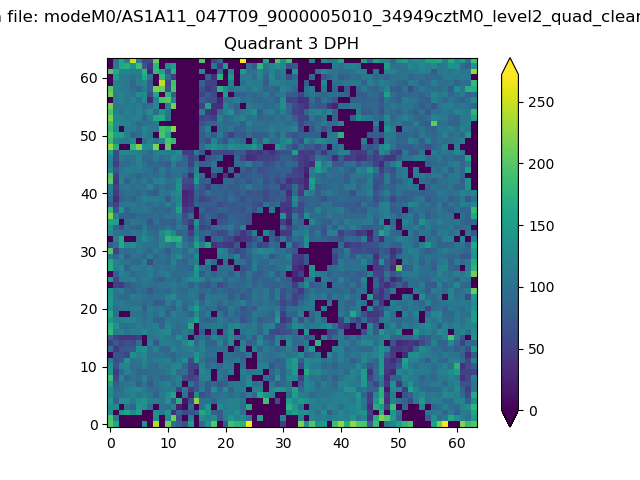 |
 |
Quadrant C |
| Plot type | Count rate plots | Images |
|---|---|---|
| Comparison with Poisson distribution Blue bars denote a histogram of data divided into 1 sec bins. Red curve is a Poisson curve with rate = median count rate of data. |
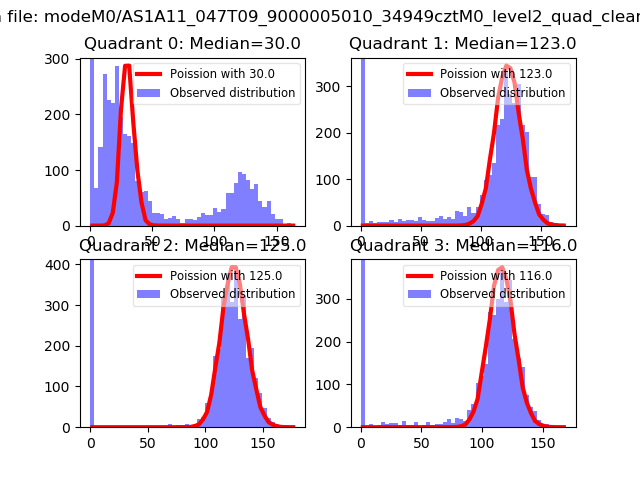 |
 |
| Quadrant-wise count rates Data is divided into 100 sec bins |
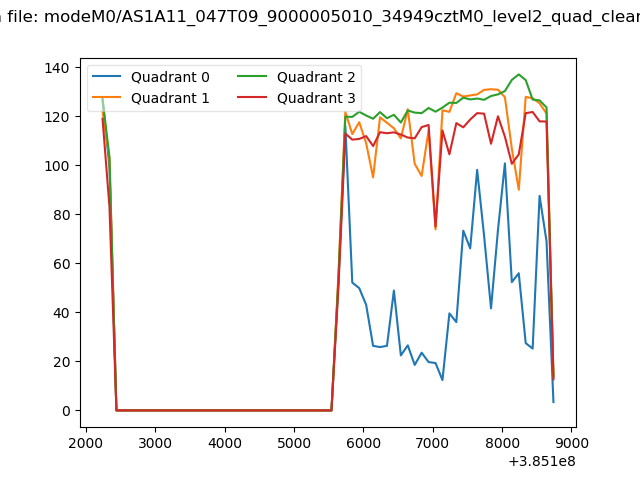 |
|
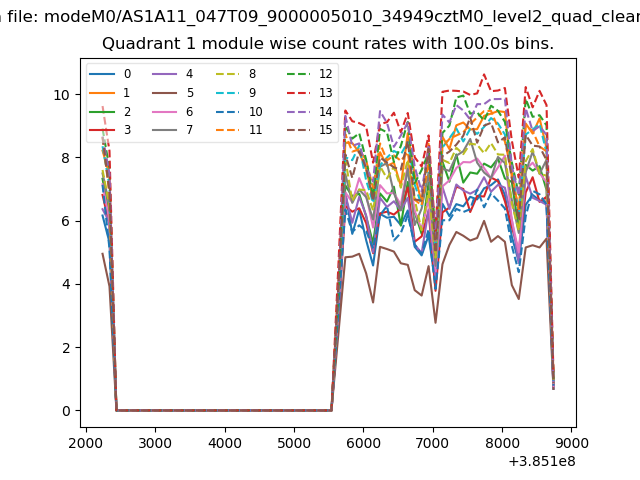
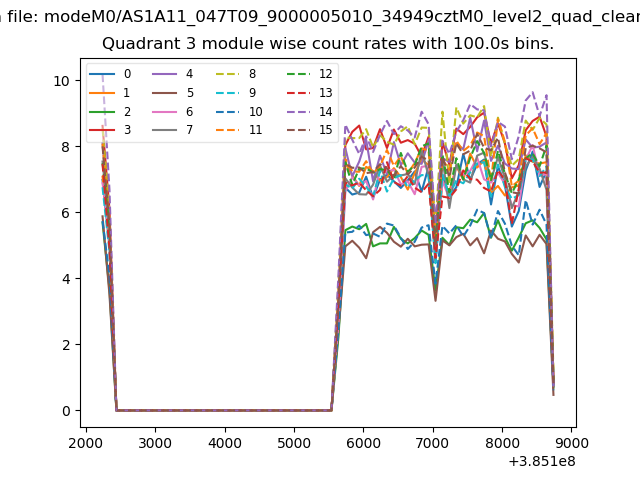
| Module-wise count rates for Quadrant A Data is divided into 100 sec bins |
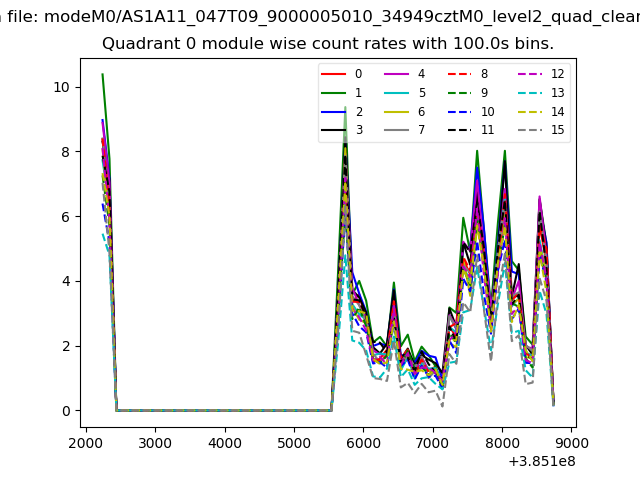 |
 |
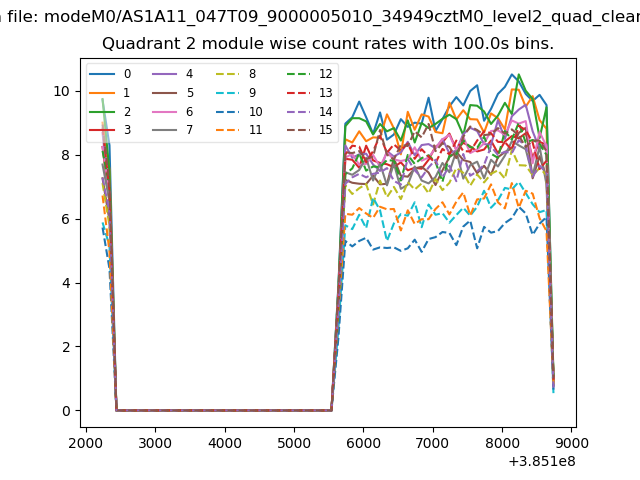
| Module-wise count rates for Quadrant B Data is divided into 100 sec bins |
 |
 |
| Module-wise count rates for Quadrant C Data is divided into 100 sec bins |
 |
 |
| Module-wise count rates for Quadrant D Data is divided into 100 sec bins |
 |
 |
| Parameter | Plot |
|---|---|
| CZT HV Monitor | 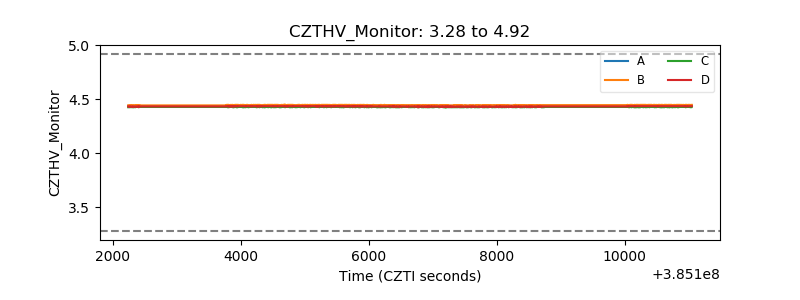 |
| D_VDD | 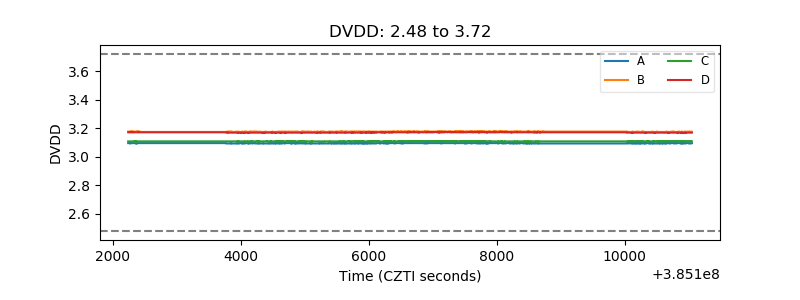 |
| Temperature 1 | 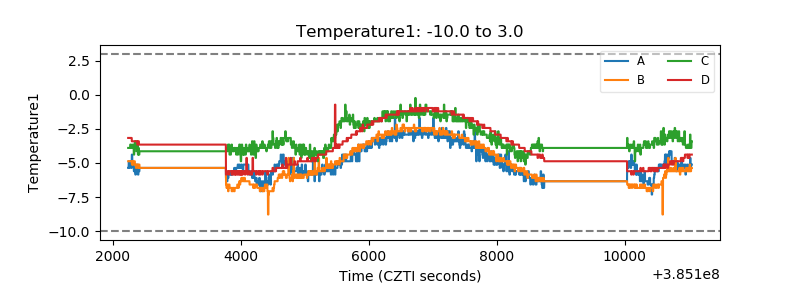 |
| Veto HV Monitor | 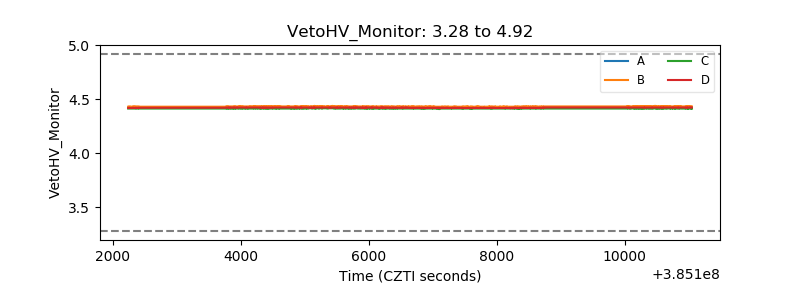 |
| Veto LLD | 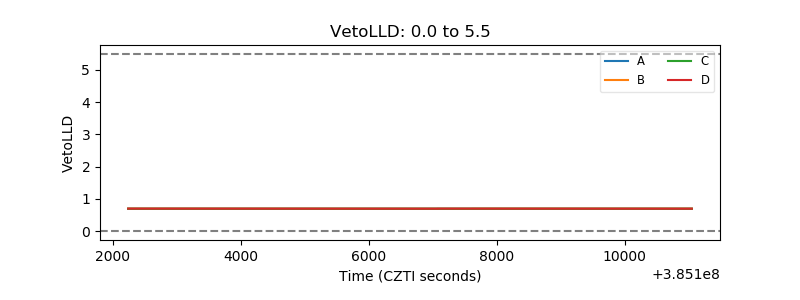 |
| Alpha Counter | 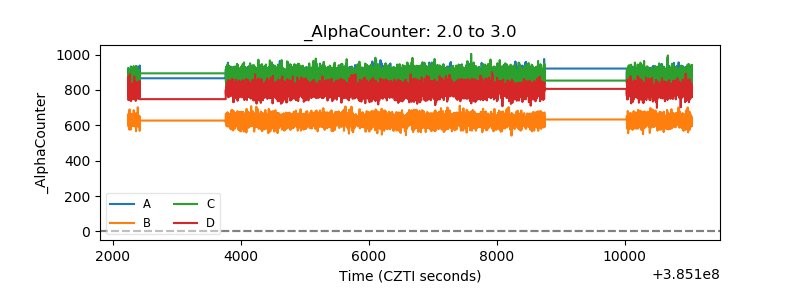 |
| _CPM_Rate | 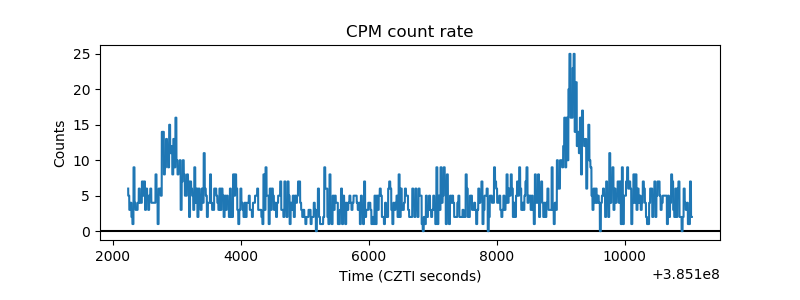 |
| CZT Counter | 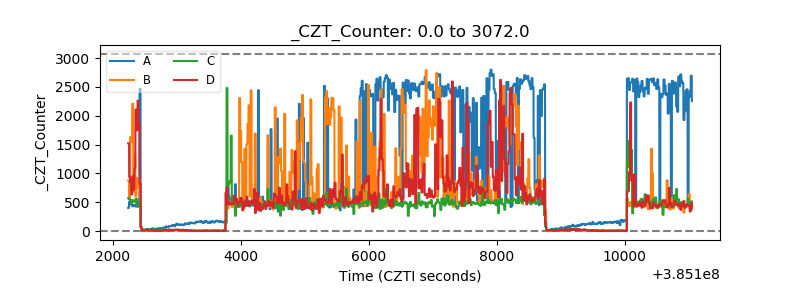 |
| +2.5 Volts monitor | 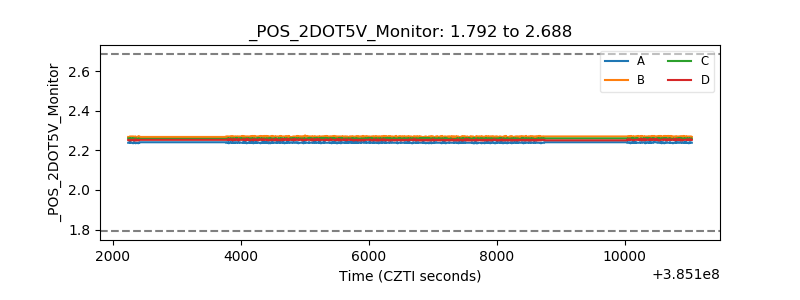 |
| +5 Volts monitor | 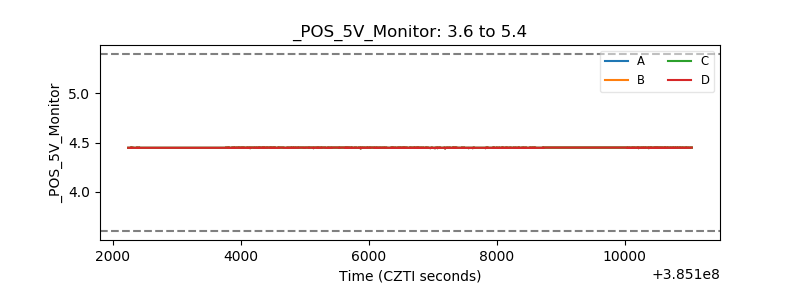 |
| _ROLL_ROT | 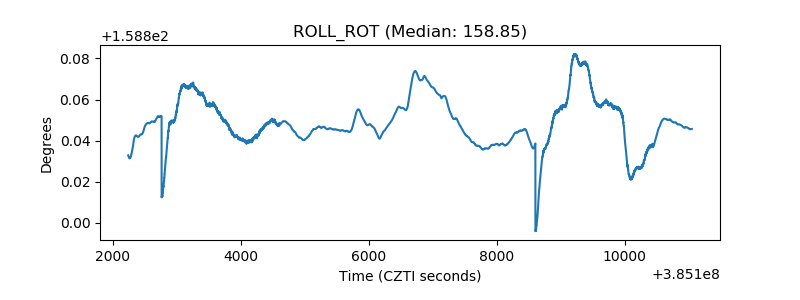 |
| _Roll_DEC | 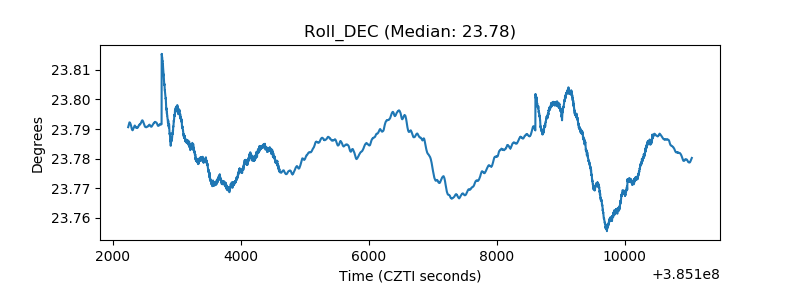 |
| _Roll_RA | 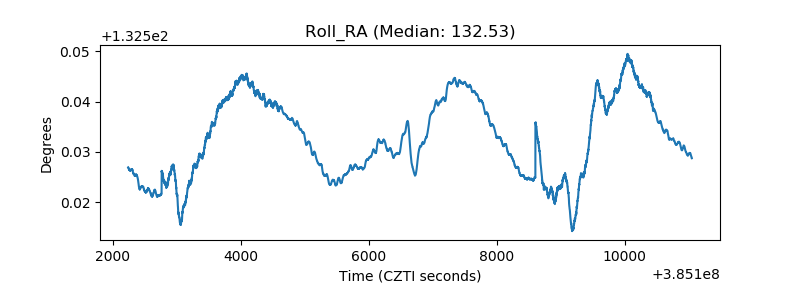 |
| Veto Counter | 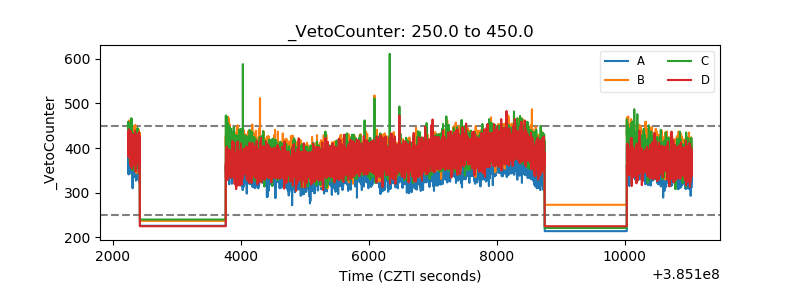 |