| Param | Original file | Final file |
|---|---|---|
| Filename | modeM0/AS1A11_047T09_9000005010_34948cztM0_level2.evt | modeM0/AS1A11_047T09_9000005010_34948cztM0_level2_quad_clean.evt |
| Size (bytes) | 586,670,400 | 57,458,880 |
| Size | 559.5 MB | 54.8 MB |
| Events in quadrant A | 5,221,305 | 317,712 |
| Events in quadrant B | 4,867,566 | 337,474 |
| Events in quadrant C | 3,010,938 | 351,830 |
| Events in quadrant D | 4,274,364 | 326,511 |
| Mode SS | |||
|---|---|---|---|
| Quadrant | BADHDUFLAG | Total packets | Discarded packets |
| A | 0 | 120 | 0 |
| B | 0 | 120 | 0 |
| C | 0 | 120 | 0 |
| D | 0 | 120 | 0 |
| Mode M0 | |||
|---|---|---|---|
| Quadrant | BADHDUFLAG | Total packets | Discarded packets |
| A | 0 | 19123 | 3 |
| B | 0 | 18401 | 2 |
| C | 0 | 12360 | 2 |
| D | 0 | 16629 | 2 |
| Mode M9 | |||
|---|---|---|---|
| Quadrant | BADHDUFLAG | Total packets | Discarded packets |
| A | 0 | 30 | 0 |
| B | 0 | 30 | 0 |
| C | 0 | 30 | 0 |
| D | 0 | 30 | 0 |
| Quadrant | Total seconds | Saturated seconds | Saturation percentage |
|---|---|---|---|
| A | 5803 | 1168 | 20.127520% |
| B | 5803 | 652 | 11.235568% |
| C | 5803 | 68 | 1.171808% |
| D | 5803 | 152 | 2.619335% |
Noise dominated data is calculated using 1-second bins in cleaned event files. If a bin has >2000 counts, and if more than 50% of those come from <1% of pixels, then it is considered to be noise-dominated and hence unusable.
| Quadrant | # 1 sec bins | Bins with >0 counts | Bins with >2000 counts | High rate bins dominated by noise | Noise dominated (total time) | Noise dominated (detector-on time) | Marked lightcurve |
|---|---|---|---|---|---|---|---|
| A | 8728 | 5805 | 1072 | 1072 | 12.28% | 18.47% | 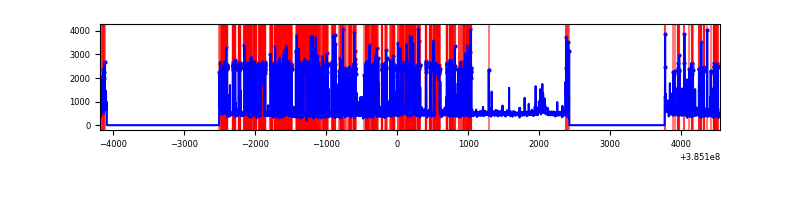 |
| B | 8728 | 5805 | 482 | 482 | 5.52% | 8.30% | 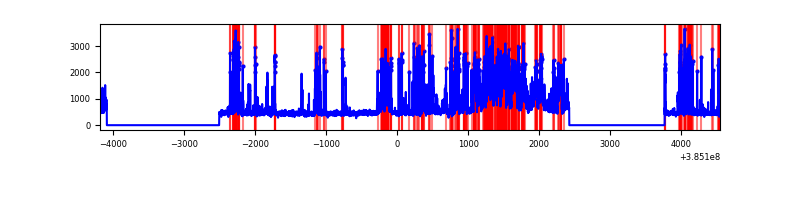 |
| C | 8728 | 5805 | 59 | 59 | 0.68% | 1.02% | 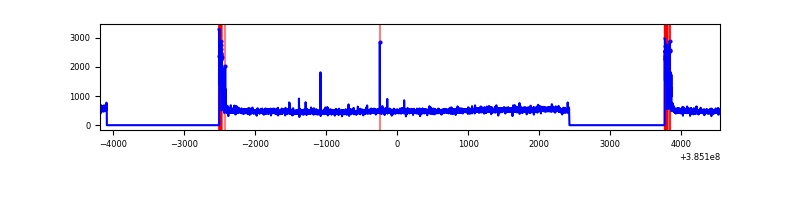 |
| D | 8728 | 5804 | 141 | 141 | 1.62% | 2.43% | 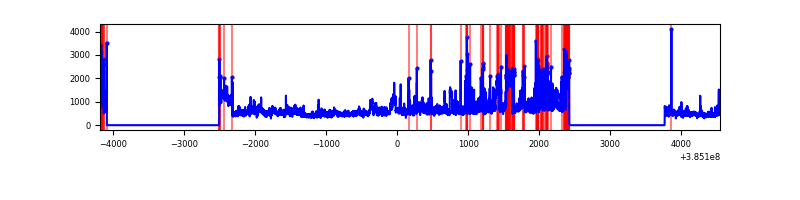 |
Top three noisy pixels from each quadrant. If the there are fewer than three noisy pixels in the level2.evt file, extra rows are filled as -1
| Pixel properties | Quadrant properties | ||||||
|---|---|---|---|---|---|---|---|
| Quadrant | DetID | PixID | Counts | Sigma | Mean | Median | Sigma |
| A | 15 | 169 | 2873072 | 24501.1 | 578 | 567 | 117.2 |
| A | 10 | 83 | 61759 | 521.94 | 578 | 567 | 117.2 |
| A | 9 | 143 | 33616 | 281.89 | 578 | 567 | 117.2 |
| B | 5 | 172 | 1222603 | 9971.67 | 639 | 621 | 122.5 |
| B | 5 | 31 | 600318 | 4893.67 | 639 | 621 | 122.5 |
| B | 5 | 15 | 186013 | 1512.84 | 639 | 621 | 122.5 |
| C | 15 | 214 | 243547 | 1596.8 | 648 | 652 | 152.1 |
| C | 0 | 10 | 196668 | 1288.61 | 648 | 652 | 152.1 |
| C | 0 | 207 | 16435 | 103.76 | 648 | 652 | 152.1 |
| D | 8 | 195 | 796325 | 4999.6 | 643 | 625 | 159.2 |
| D | 2 | 31 | 425354 | 2668.69 | 643 | 625 | 159.2 |
| D | 2 | 249 | 183851 | 1151.26 | 643 | 625 | 159.2 |
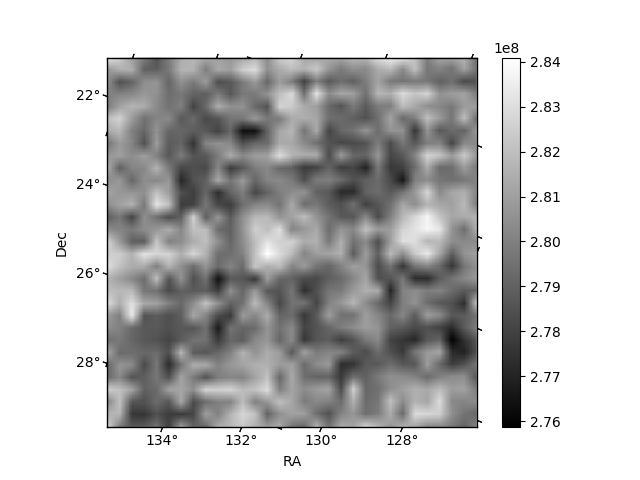
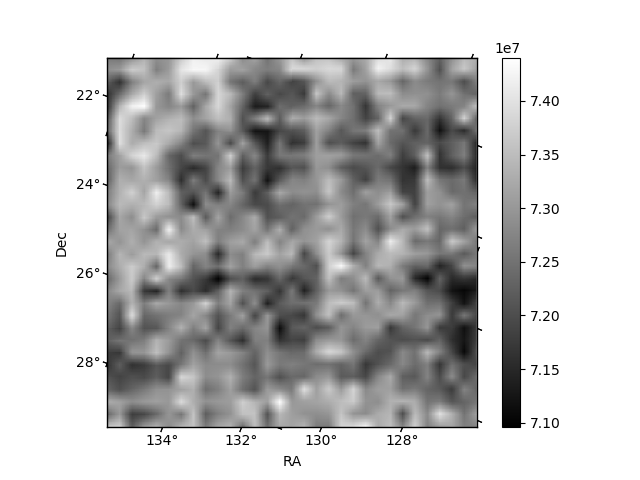
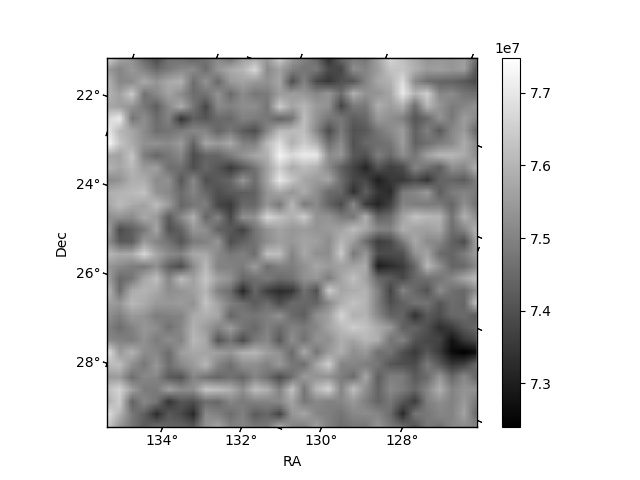
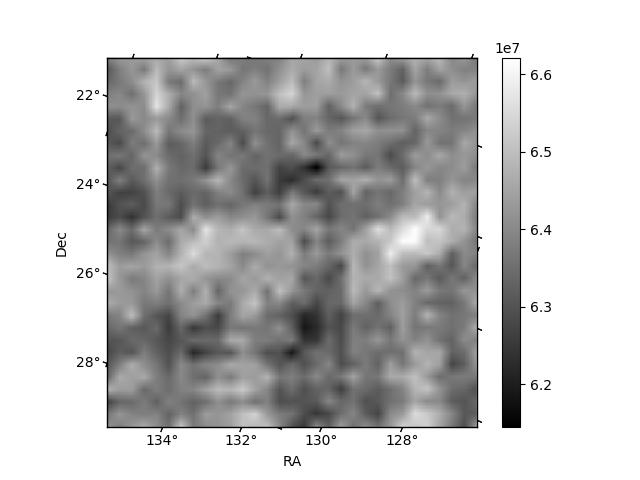
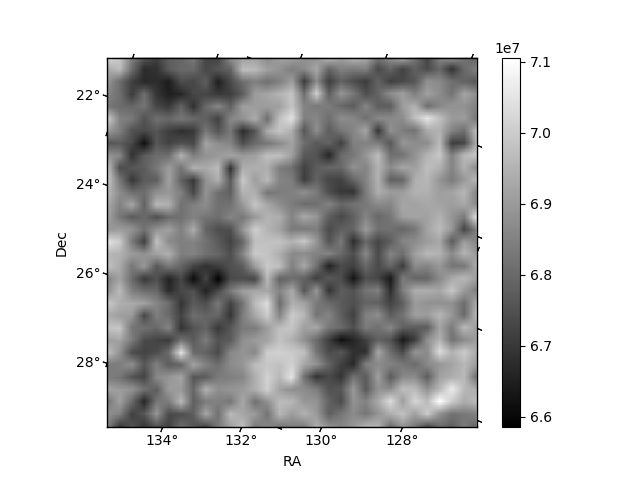
Histogram calculated using DETX and DETY for each event in the final _common_clean file
| Quadrant A | 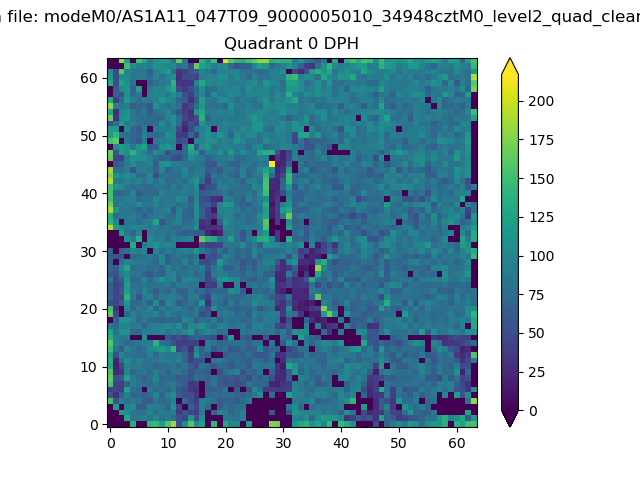 |
 |
Quadrant B |
|---|---|---|---|
| Quadrant D | 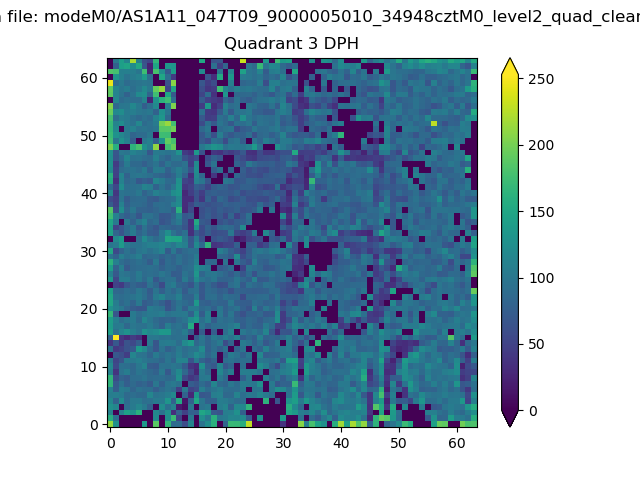 |
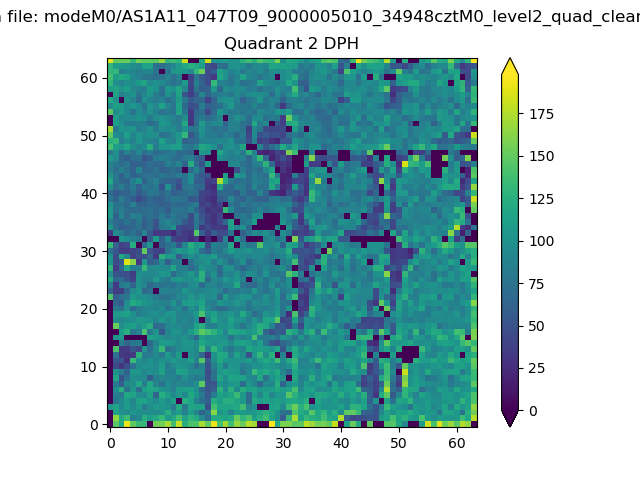 |
Quadrant C |
| Plot type | Count rate plots | Images |
|---|---|---|
| Comparison with Poisson distribution Blue bars denote a histogram of data divided into 1 sec bins. Red curve is a Poisson curve with rate = median count rate of data. |
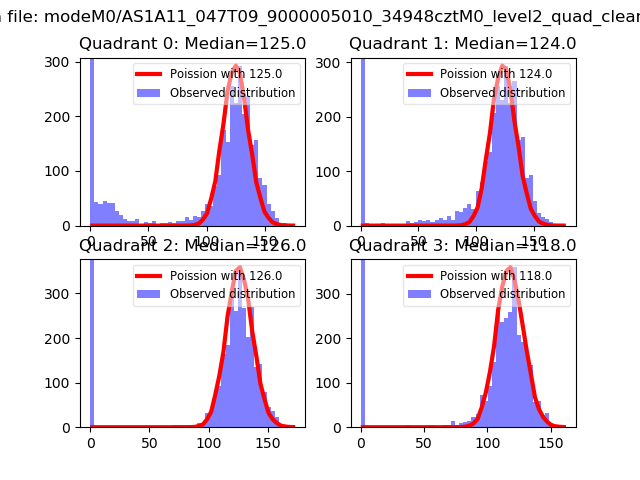 |
 |
| Quadrant-wise count rates Data is divided into 100 sec bins |
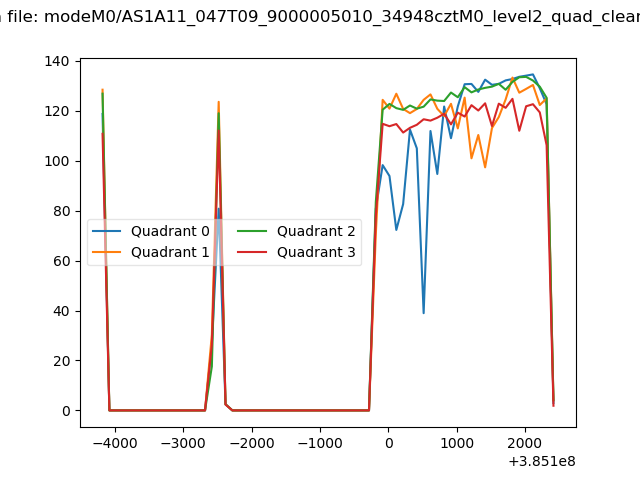 |
|
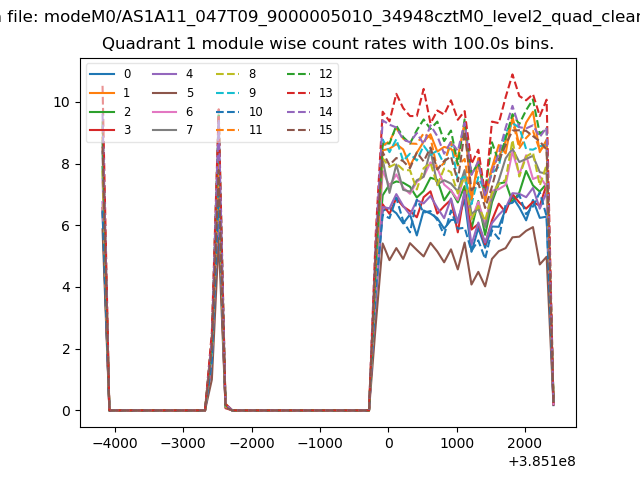
| Module-wise count rates for Quadrant A Data is divided into 100 sec bins |
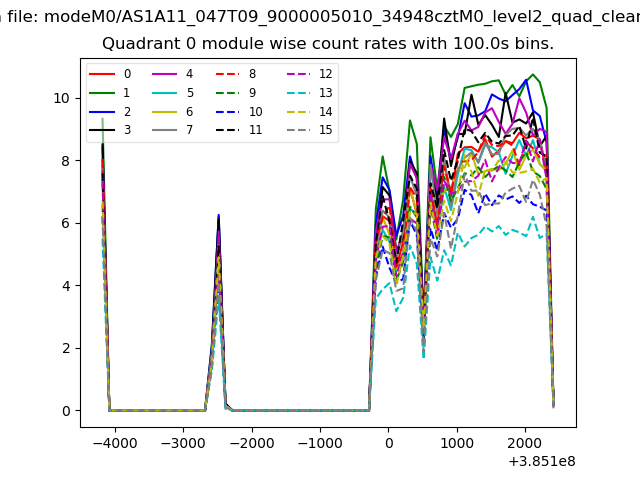 |
 |
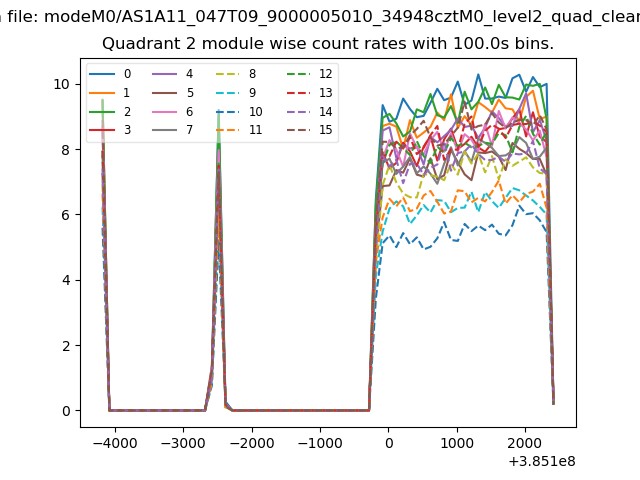
| Module-wise count rates for Quadrant B Data is divided into 100 sec bins |
 |
 |
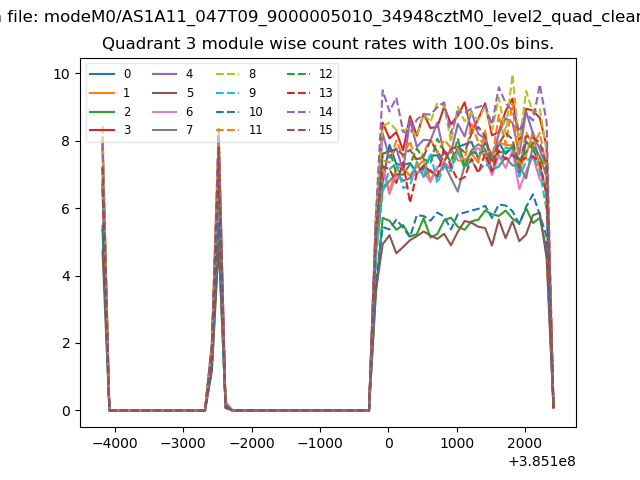
| Module-wise count rates for Quadrant C Data is divided into 100 sec bins |
 |
 |
| Module-wise count rates for Quadrant D Data is divided into 100 sec bins |
 |
 |
| Parameter | Plot |
|---|---|
| CZT HV Monitor |  |
| D_VDD | 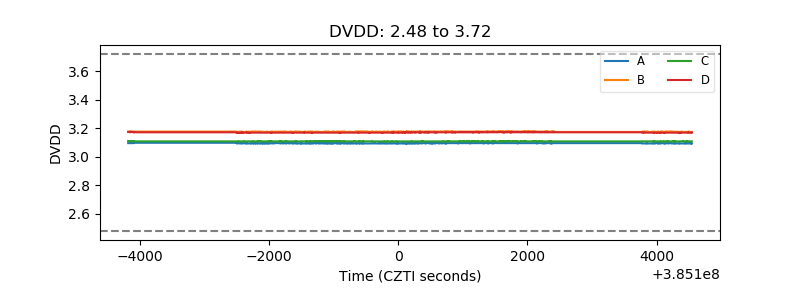 |
| Temperature 1 | 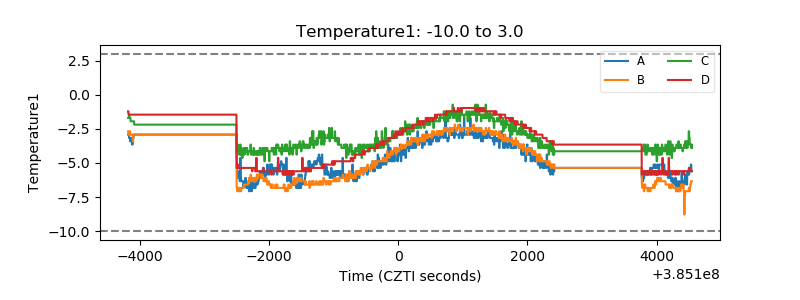 |
| Veto HV Monitor | 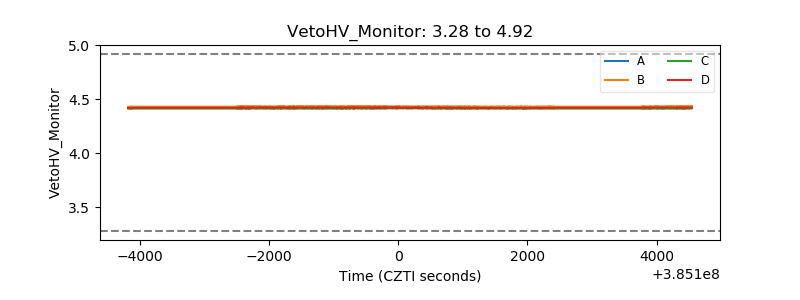 |
| Veto LLD | 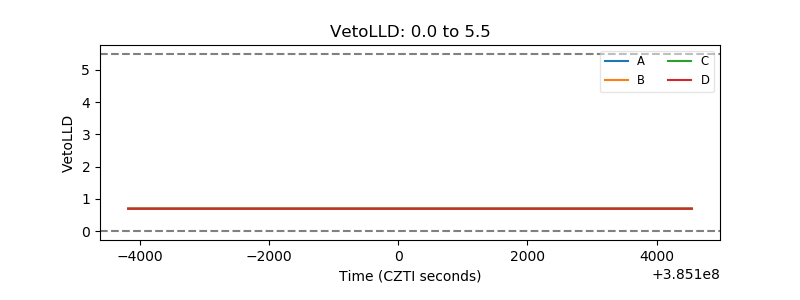 |
| Alpha Counter | 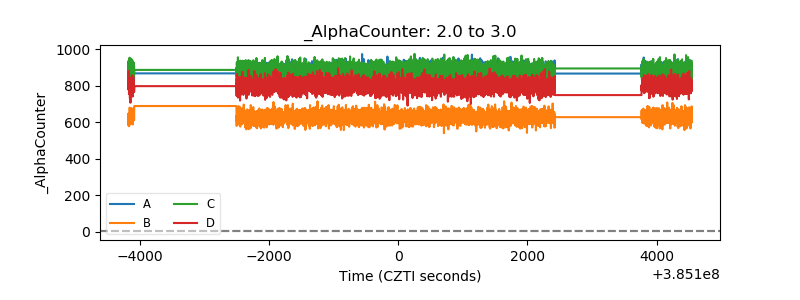 |
| _CPM_Rate |  |
| CZT Counter | 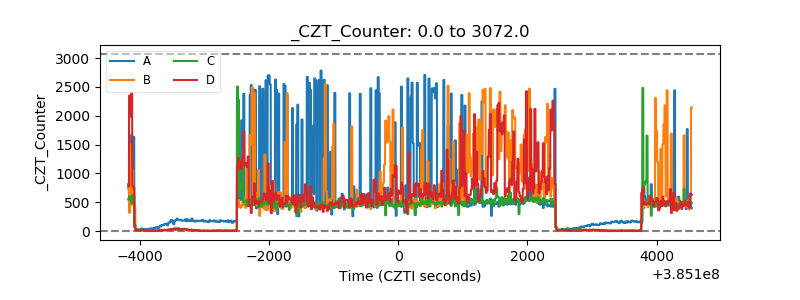 |
| +2.5 Volts monitor | 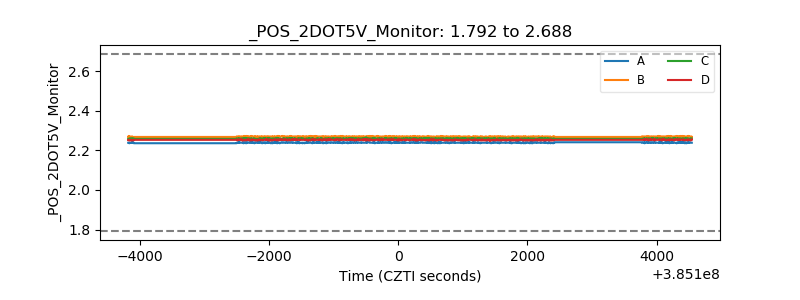 |
| +5 Volts monitor | 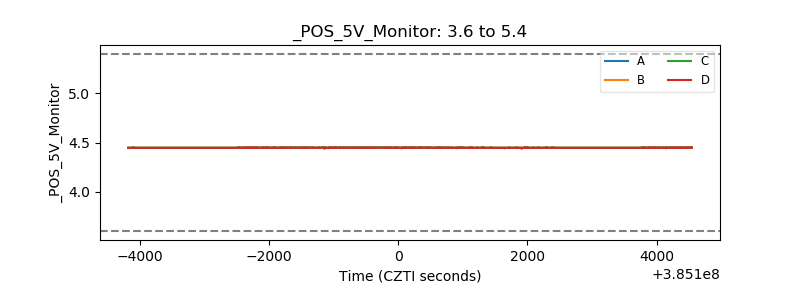 |
| _ROLL_ROT | 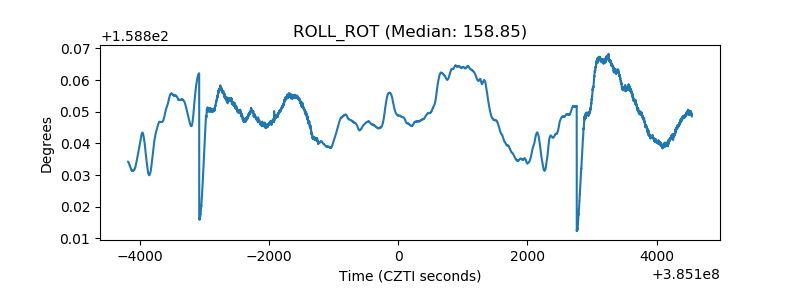 |
| _Roll_DEC | 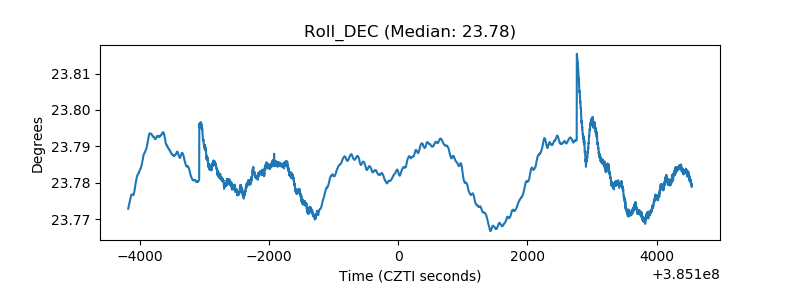 |
| _Roll_RA | 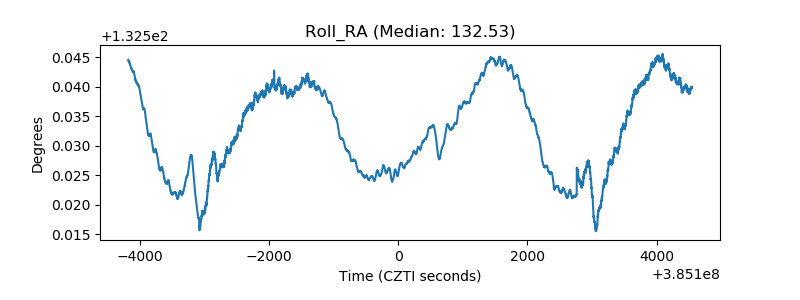 |
| Veto Counter | 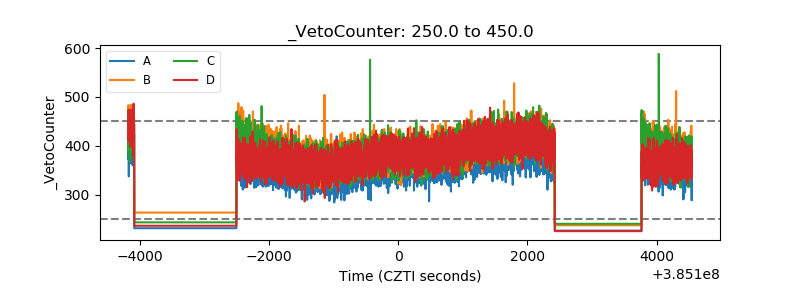 |