| Param | Original file | Final file |
|---|---|---|
| Filename | modeM0/AS1A11_047T09_9000005010_34947cztM0_level2.evt | modeM0/AS1A11_047T09_9000005010_34947cztM0_level2_quad_clean.evt |
| Size (bytes) | 548,026,560 | 57,176,640 |
| Size | 522.6 MB | 54.5 MB |
| Events in quadrant A | 4,717,325 | 320,539 |
| Events in quadrant B | 4,312,138 | 336,215 |
| Events in quadrant C | 2,897,793 | 350,394 |
| Events in quadrant D | 4,284,198 | 325,723 |
| Mode SS | |||
|---|---|---|---|
| Quadrant | BADHDUFLAG | Total packets | Discarded packets |
| A | 0 | 118 | 0 |
| B | 0 | 118 | 0 |
| C | 0 | 118 | 0 |
| D | 0 | 118 | 0 |
| Mode M0 | |||
|---|---|---|---|
| Quadrant | BADHDUFLAG | Total packets | Discarded packets |
| A | 0 | 17616 | 3 |
| B | 0 | 16595 | 2 |
| C | 0 | 11955 | 2 |
| D | 0 | 16471 | 2 |
| Mode M9 | |||
|---|---|---|---|
| Quadrant | BADHDUFLAG | Total packets | Discarded packets |
| A | 0 | 36 | 0 |
| B | 0 | 36 | 0 |
| C | 0 | 36 | 0 |
| D | 0 | 36 | 0 |
| Quadrant | Total seconds | Saturated seconds | Saturation percentage |
|---|---|---|---|
| A | 5686 | 920 | 16.180091% |
| B | 5686 | 588 | 10.341189% |
| C | 5686 | 49 | 0.861766% |
| D | 5686 | 238 | 4.185719% |
Noise dominated data is calculated using 1-second bins in cleaned event files. If a bin has >2000 counts, and if more than 50% of those come from <1% of pixels, then it is considered to be noise-dominated and hence unusable.
| Quadrant | # 1 sec bins | Bins with >0 counts | Bins with >2000 counts | High rate bins dominated by noise | Noise dominated (total time) | Noise dominated (detector-on time) | Marked lightcurve |
|---|---|---|---|---|---|---|---|
| A | 9242 | 5688 | 737 | 737 | 7.97% | 12.96% | 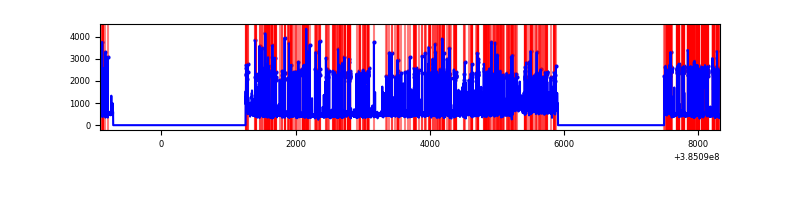 |
| B | 9242 | 5688 | 465 | 465 | 5.03% | 8.18% | 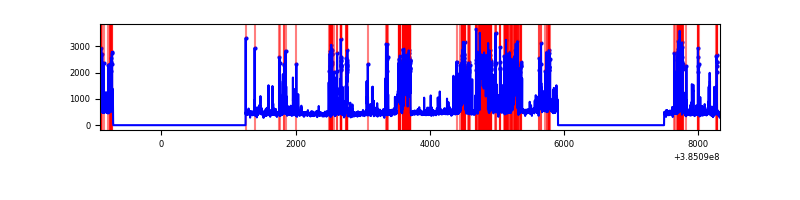 |
| C | 9242 | 5688 | 40 | 40 | 0.43% | 0.70% | 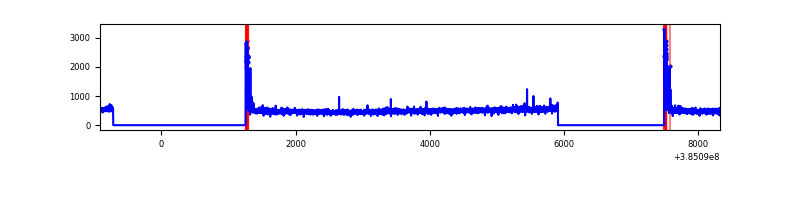 |
| D | 9242 | 5688 | 199 | 199 | 2.15% | 3.50% |  |
Top three noisy pixels from each quadrant. If the there are fewer than three noisy pixels in the level2.evt file, extra rows are filled as -1
| Pixel properties | Quadrant properties | ||||||
|---|---|---|---|---|---|---|---|
| Quadrant | DetID | PixID | Counts | Sigma | Mean | Median | Sigma |
| A | 15 | 169 | 2317524 | 19575.98 | 586 | 574 | 118.4 |
| A | 10 | 83 | 60977 | 510.34 | 586 | 574 | 118.4 |
| A | 7 | 16 | 50222 | 419.47 | 586 | 574 | 118.4 |
| B | 5 | 172 | 1363991 | 11335.77 | 623 | 608 | 120.3 |
| B | 0 | 190 | 169320 | 1402.75 | 623 | 608 | 120.3 |
| B | 4 | 232 | 122851 | 1016.38 | 623 | 608 | 120.3 |
| C | 15 | 214 | 240669 | 1608.31 | 637 | 643 | 149.2 |
| C | 0 | 10 | 136719 | 911.78 | 637 | 643 | 149.2 |
| C | 0 | 207 | 18780 | 121.52 | 637 | 643 | 149.2 |
| D | 8 | 195 | 730054 | 4734.45 | 629 | 614 | 154.1 |
| D | 13 | 249 | 360196 | 2333.88 | 629 | 614 | 154.1 |
| D | 2 | 249 | 274881 | 1780.14 | 629 | 614 | 154.1 |
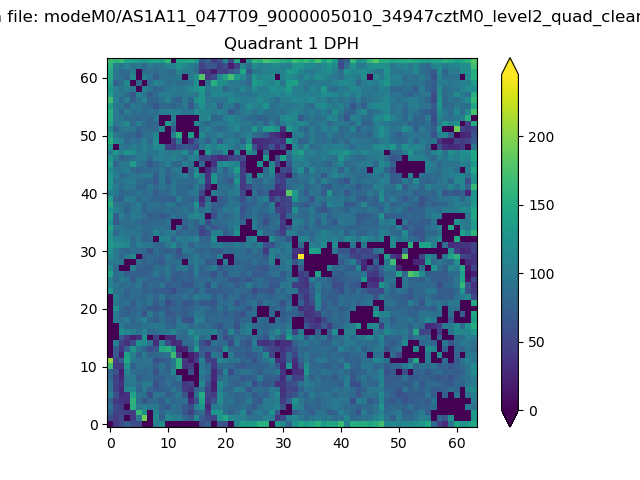
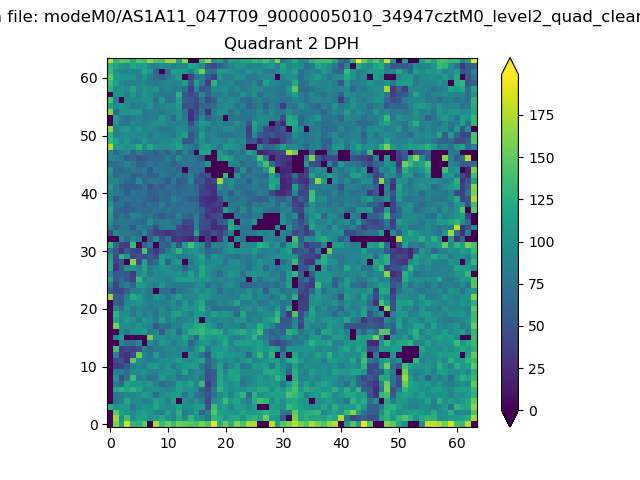
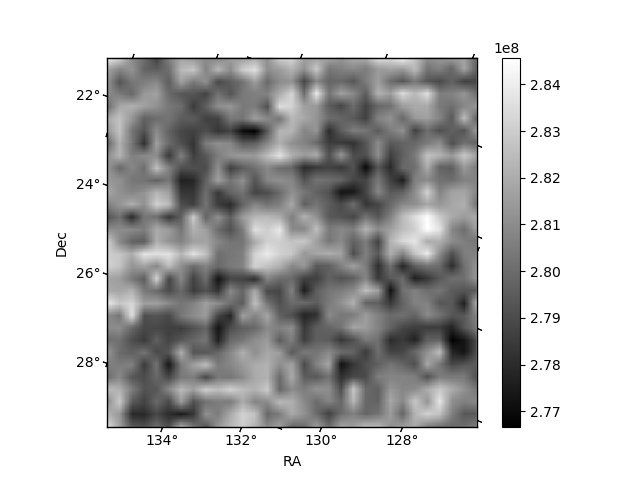
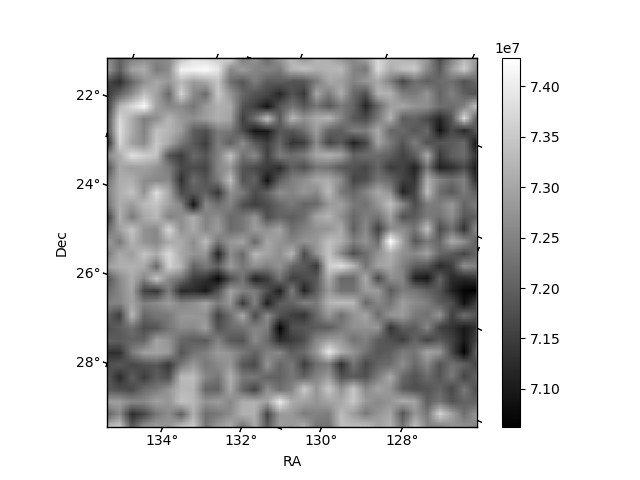
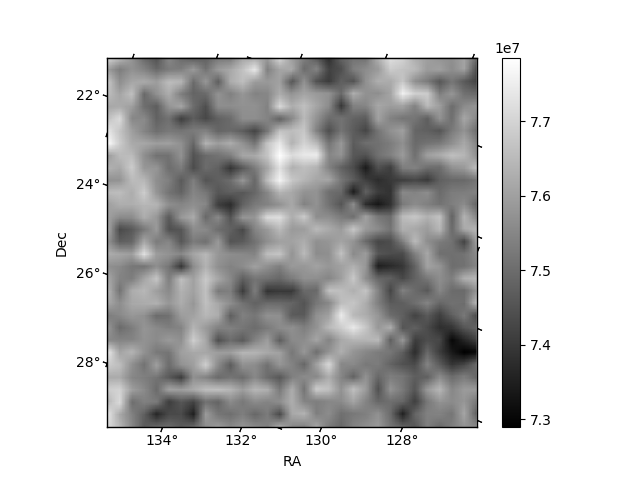
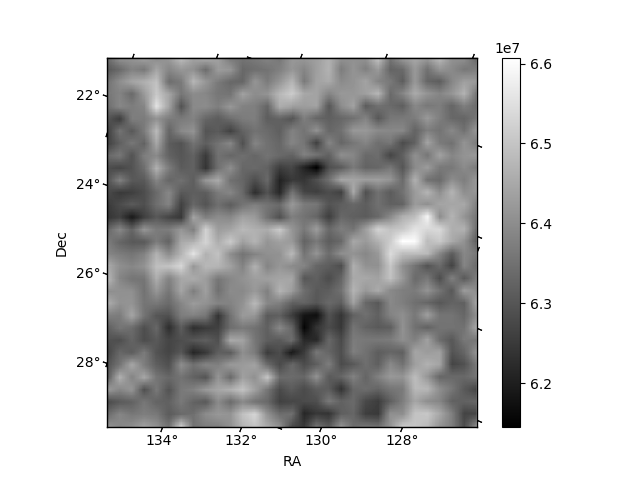
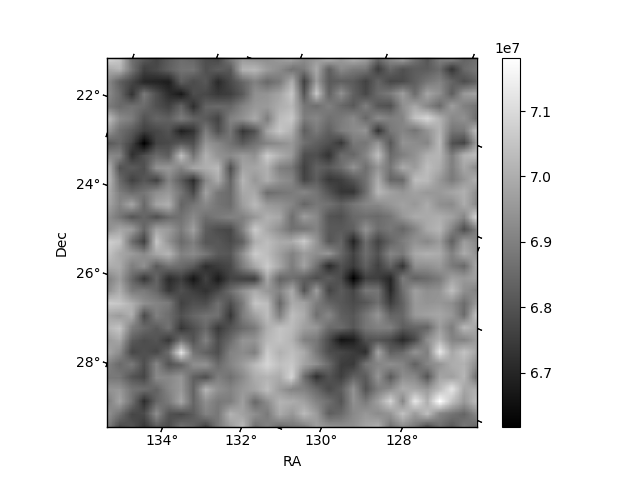
Histogram calculated using DETX and DETY for each event in the final _common_clean file
| Quadrant A | 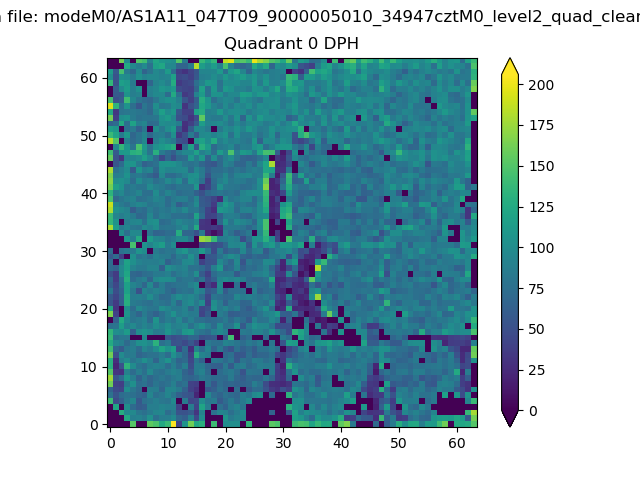 |
 |
Quadrant B |
|---|---|---|---|
| Quadrant D | 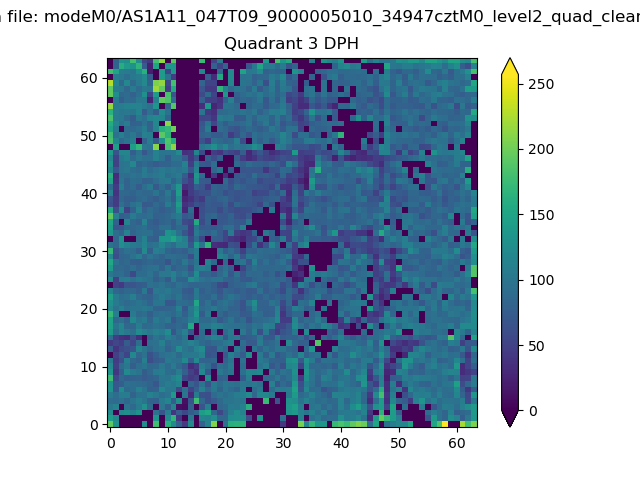 |
 |
Quadrant C |
| Plot type | Count rate plots | Images |
|---|---|---|
| Comparison with Poisson distribution Blue bars denote a histogram of data divided into 1 sec bins. Red curve is a Poisson curve with rate = median count rate of data. |
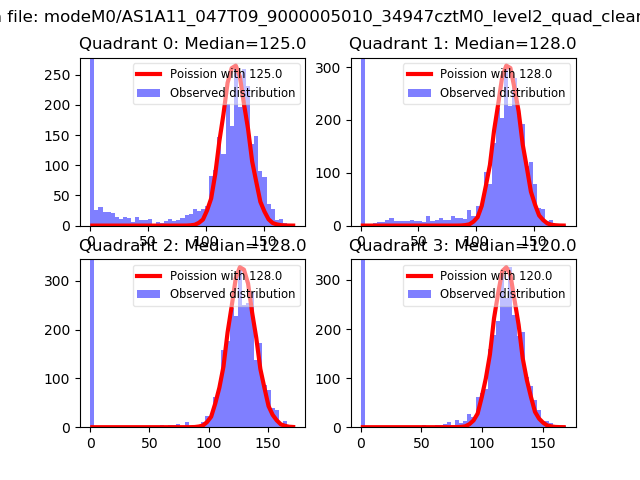 |
 |
| Quadrant-wise count rates Data is divided into 100 sec bins |
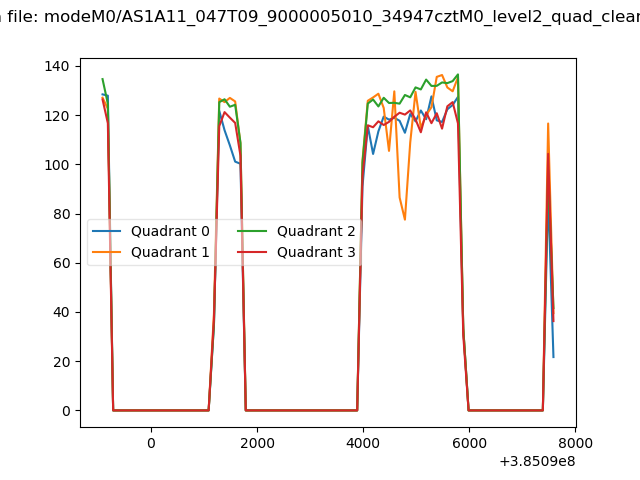 |
|
| Module-wise count rates for Quadrant A Data is divided into 100 sec bins |
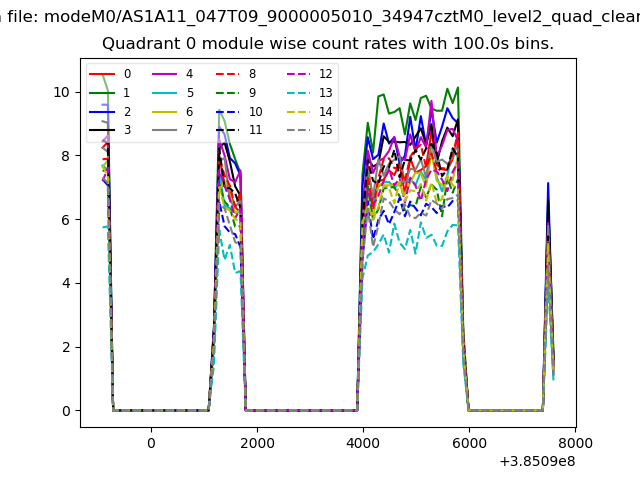 |
 |
| Module-wise count rates for Quadrant B Data is divided into 100 sec bins |
 |
 |
| Module-wise count rates for Quadrant C Data is divided into 100 sec bins |
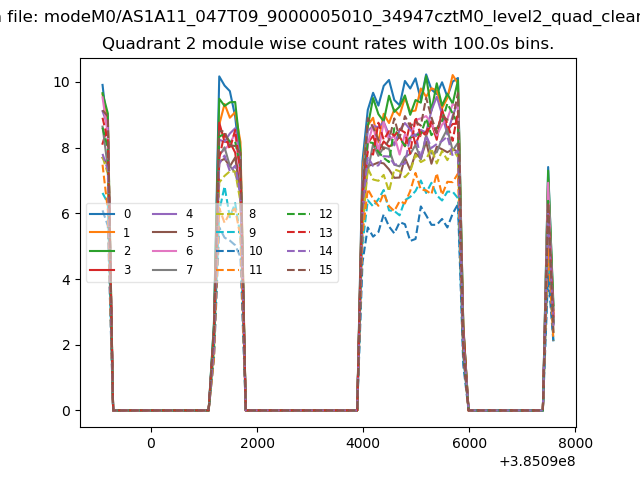 |
 |
| Module-wise count rates for Quadrant D Data is divided into 100 sec bins |
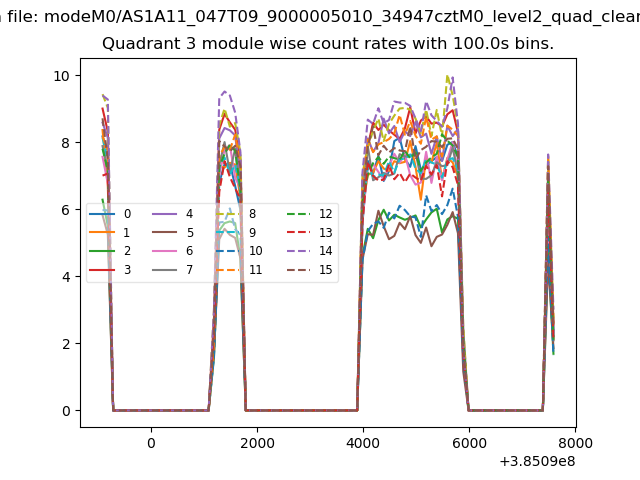 |
 |
| Parameter | Plot |
|---|---|
| CZT HV Monitor | 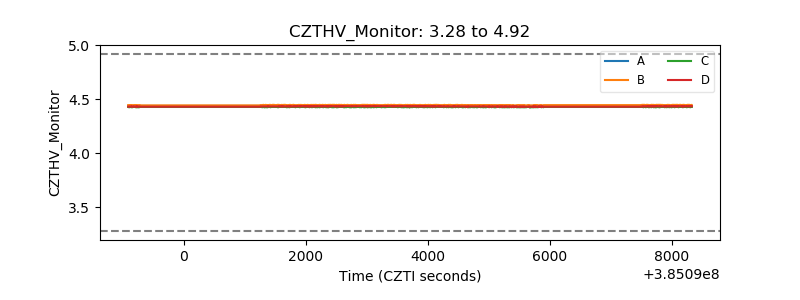 |
| D_VDD | 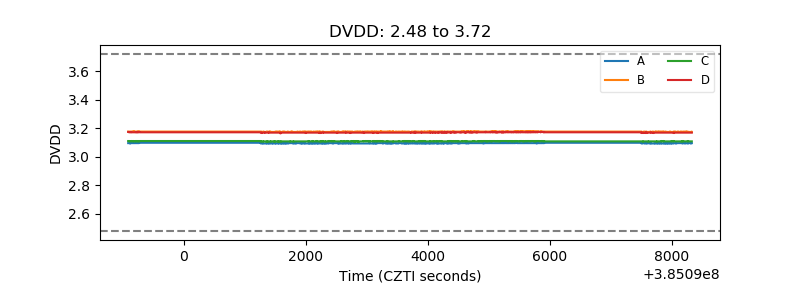 |
| Temperature 1 | 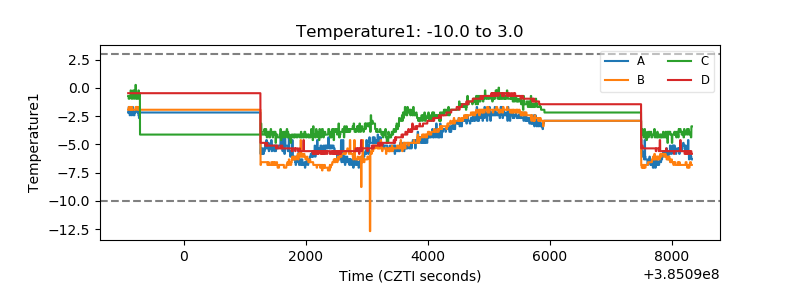 |
| Veto HV Monitor | 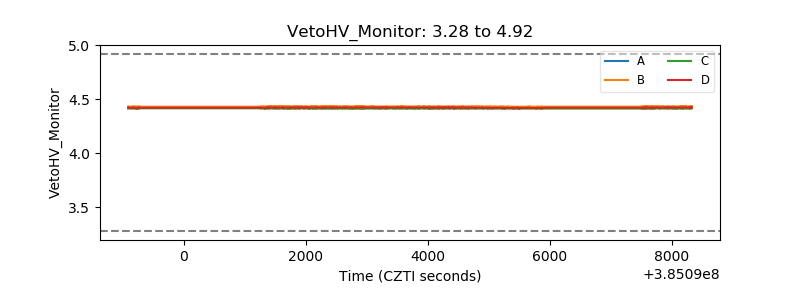 |
| Veto LLD | 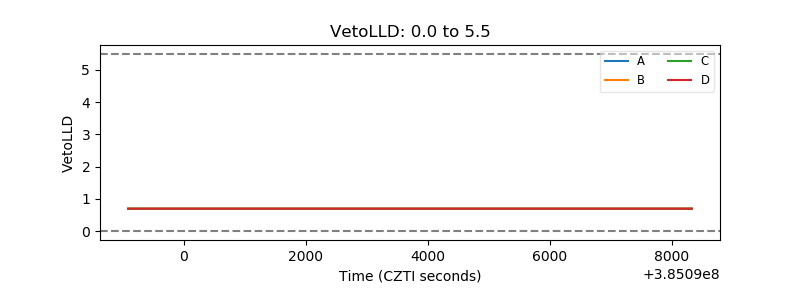 |
| Alpha Counter | 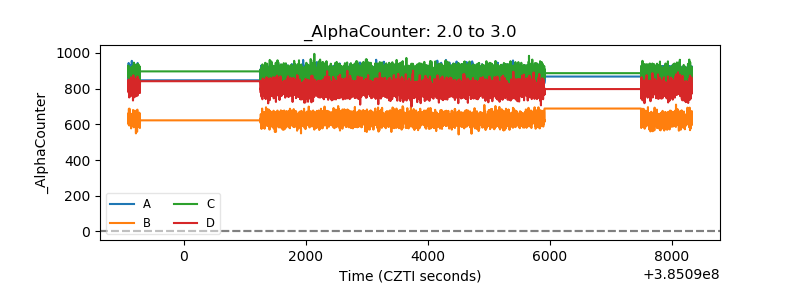 |
| _CPM_Rate | 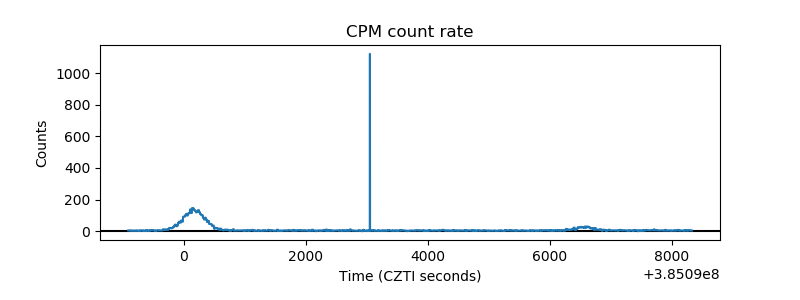 |
| CZT Counter | 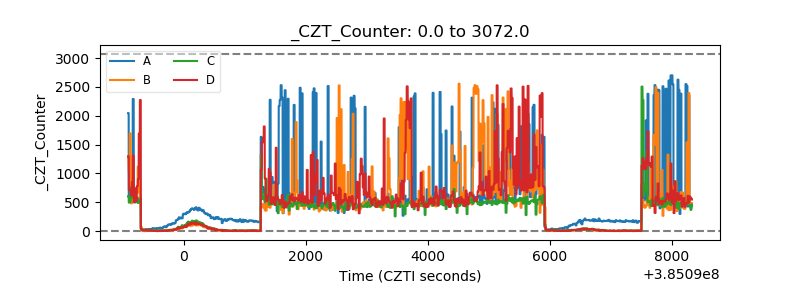 |
| +2.5 Volts monitor | 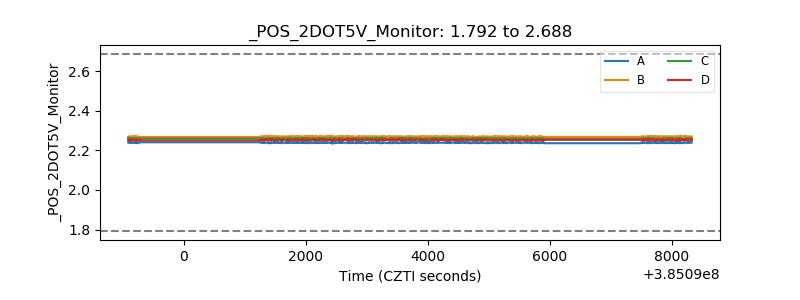 |
| +5 Volts monitor | 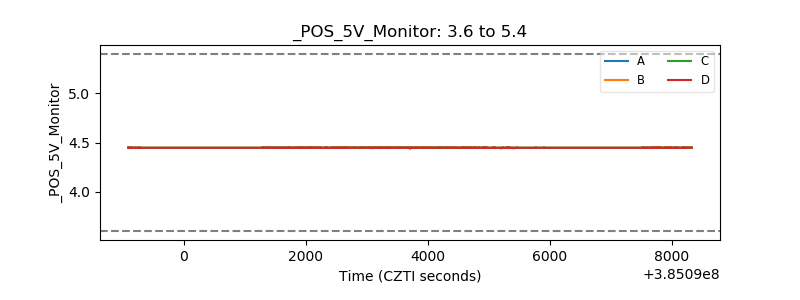 |
| _ROLL_ROT | 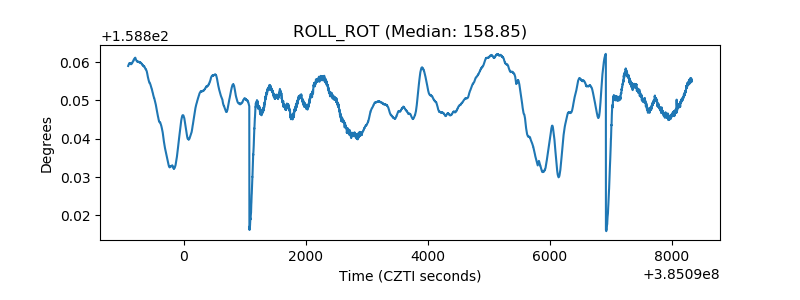 |
| _Roll_DEC | 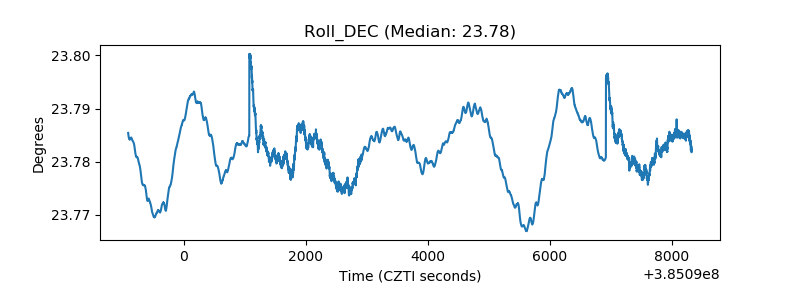 |
| _Roll_RA | 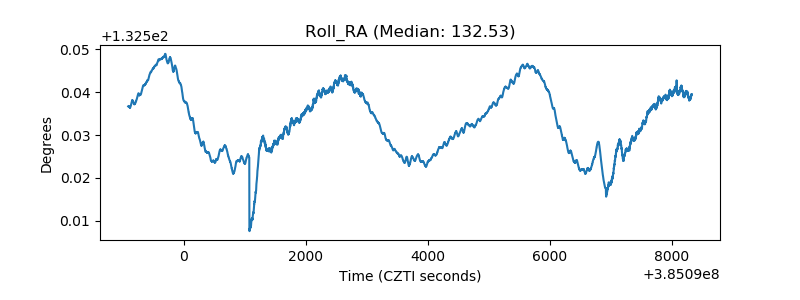 |
| Veto Counter | 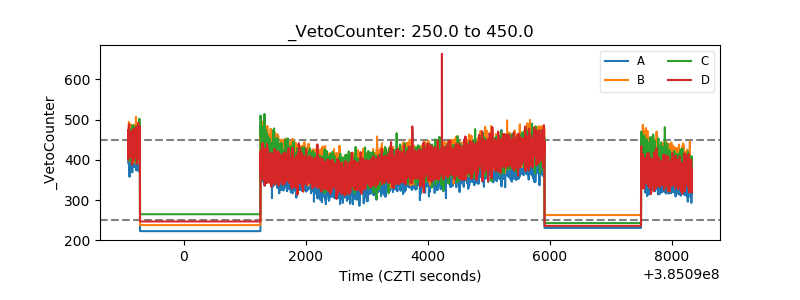 |