| Param | Original file | Final file |
|---|---|---|
| Filename | modeM0/AS1A11_047T09_9000005010_34946cztM0_level2.evt | modeM0/AS1A11_047T09_9000005010_34946cztM0_level2_quad_clean.evt |
| Size (bytes) | 495,198,720 | 52,899,840 |
| Size | 472.3 MB | 50.4 MB |
| Events in quadrant A | 4,957,703 | 264,644 |
| Events in quadrant B | 3,381,541 | 327,822 |
| Events in quadrant C | 2,644,581 | 335,333 |
| Events in quadrant D | 3,664,780 | 313,481 |
| Mode SS | |||
|---|---|---|---|
| Quadrant | BADHDUFLAG | Total packets | Discarded packets |
| A | 0 | 106 | 0 |
| B | 0 | 106 | 0 |
| C | 0 | 106 | 0 |
| D | 0 | 106 | 0 |
| Mode M0 | |||
|---|---|---|---|
| Quadrant | BADHDUFLAG | Total packets | Discarded packets |
| A | 0 | 17954 | 3 |
| B | 0 | 13472 | 2 |
| C | 0 | 10899 | 2 |
| D | 0 | 14229 | 2 |
| Mode M9 | |||
|---|---|---|---|
| Quadrant | BADHDUFLAG | Total packets | Discarded packets |
| A | 0 | 41 | 0 |
| B | 0 | 41 | 0 |
| C | 0 | 41 | 0 |
| D | 0 | 41 | 0 |
| Quadrant | Total seconds | Saturated seconds | Saturation percentage |
|---|---|---|---|
| A | 5134 | 1248 | 24.308531% |
| B | 5134 | 317 | 6.174523% |
| C | 5134 | 44 | 0.857032% |
| D | 5134 | 111 | 2.162057% |
Noise dominated data is calculated using 1-second bins in cleaned event files. If a bin has >2000 counts, and if more than 50% of those come from <1% of pixels, then it is considered to be noise-dominated and hence unusable.
| Quadrant | # 1 sec bins | Bins with >0 counts | Bins with >2000 counts | High rate bins dominated by noise | Noise dominated (total time) | Noise dominated (detector-on time) | Marked lightcurve |
|---|---|---|---|---|---|---|---|
| A | 9232 | 5135 | 1130 | 1130 | 12.24% | 22.01% | 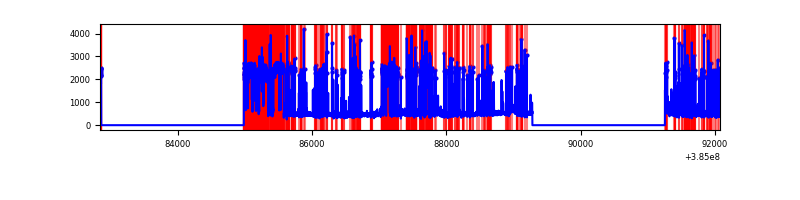 |
| B | 9232 | 5136 | 234 | 234 | 2.53% | 4.56% | 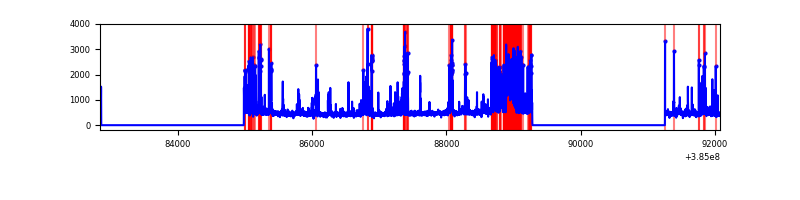 |
| C | 9232 | 5136 | 38 | 38 | 0.41% | 0.74% | 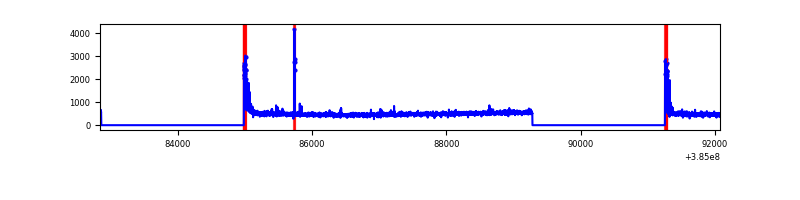 |
| D | 9232 | 5136 | 88 | 88 | 0.95% | 1.71% | 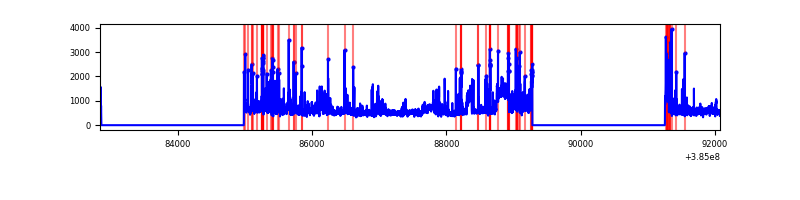 |
Top three noisy pixels from each quadrant. If the there are fewer than three noisy pixels in the level2.evt file, extra rows are filled as -1
| Pixel properties | Quadrant properties | ||||||
|---|---|---|---|---|---|---|---|
| Quadrant | DetID | PixID | Counts | Sigma | Mean | Median | Sigma |
| A | 15 | 169 | 2961348 | 30195.09 | 488 | 478 | 98.1 |
| A | 10 | 83 | 46949 | 473.91 | 488 | 478 | 98.1 |
| A | 7 | 16 | 43819 | 441.99 | 488 | 478 | 98.1 |
| B | 5 | 172 | 955215 | 8615.62 | 574 | 560 | 110.8 |
| B | 4 | 232 | 123047 | 1105.43 | 574 | 560 | 110.8 |
| B | 0 | 190 | 18808 | 164.69 | 574 | 560 | 110.8 |
| C | 15 | 214 | 217887 | 1625.46 | 574 | 579 | 133.7 |
| C | 0 | 10 | 146263 | 1089.71 | 574 | 579 | 133.7 |
| C | 12 | 250 | 18987 | 137.69 | 574 | 579 | 133.7 |
| D | 8 | 195 | 520141 | 3744.99 | 567 | 552 | 138.7 |
| D | 2 | 31 | 315277 | 2268.41 | 567 | 552 | 138.7 |
| D | 13 | 249 | 170425 | 1224.38 | 567 | 552 | 138.7 |
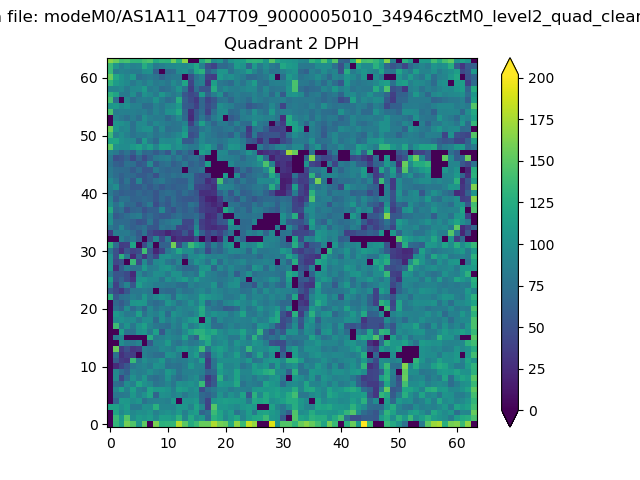
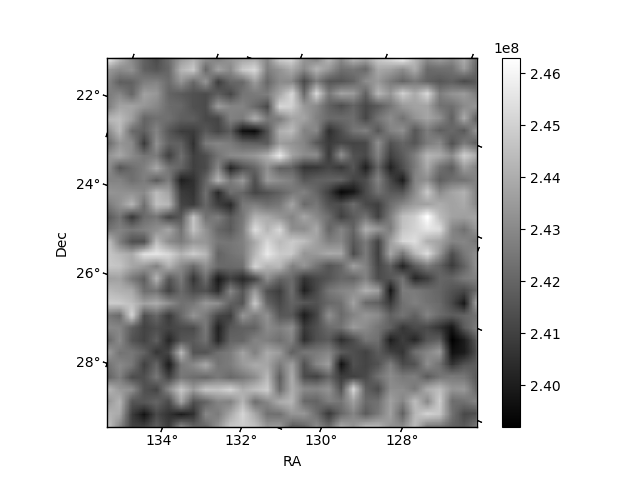
Histogram calculated using DETX and DETY for each event in the final _common_clean file
| Quadrant A | 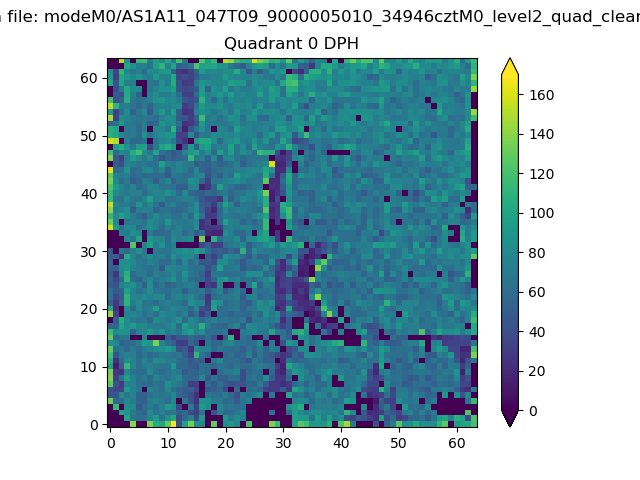 |
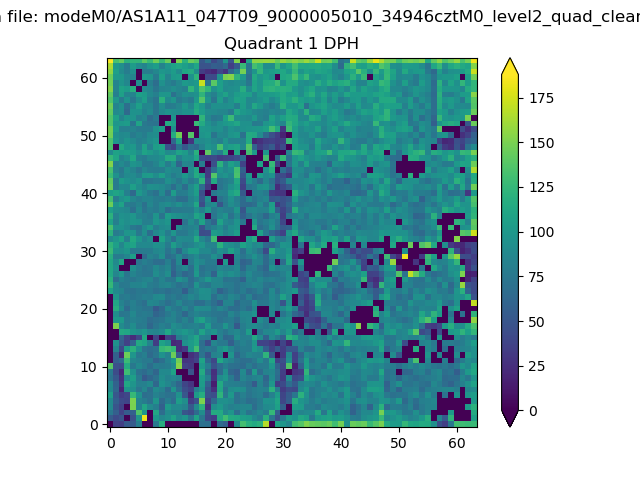 |
Quadrant B |
|---|---|---|---|
| Quadrant D | 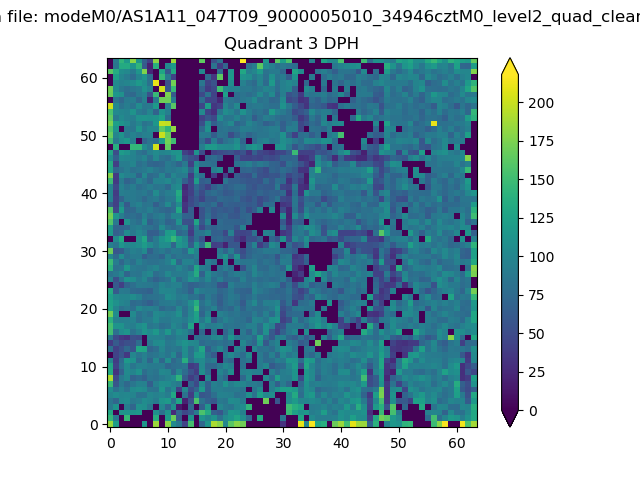 |
 |
Quadrant C |
| Plot type | Count rate plots | Images |
|---|---|---|
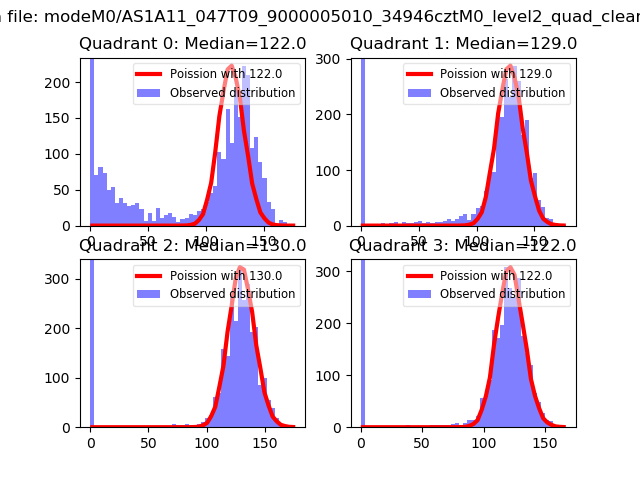
| Comparison with Poisson distribution Blue bars denote a histogram of data divided into 1 sec bins. Red curve is a Poisson curve with rate = median count rate of data. |
 |
 |
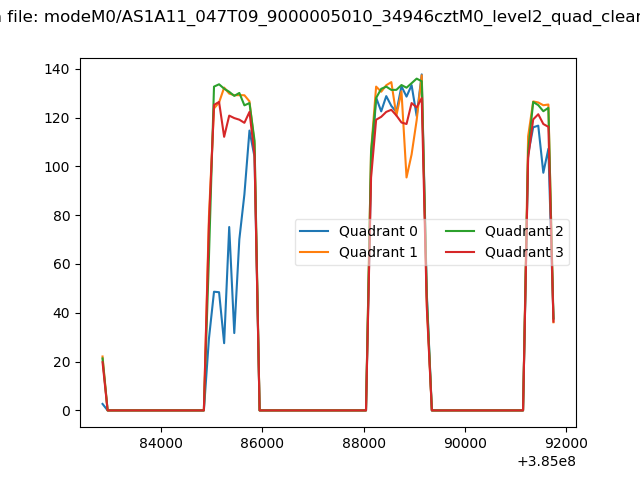
| Quadrant-wise count rates Data is divided into 100 sec bins |
 |
|
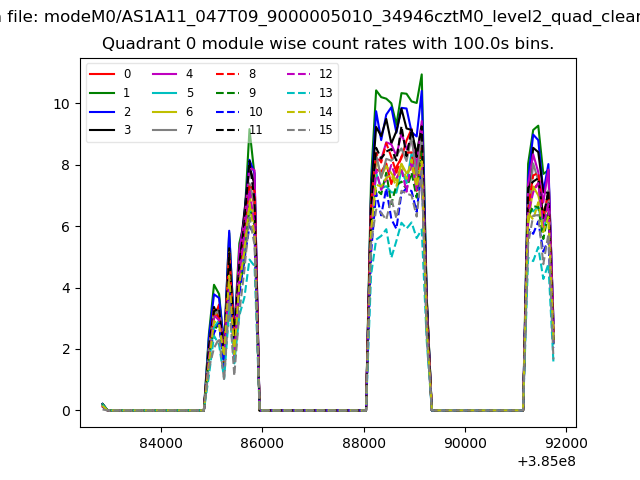
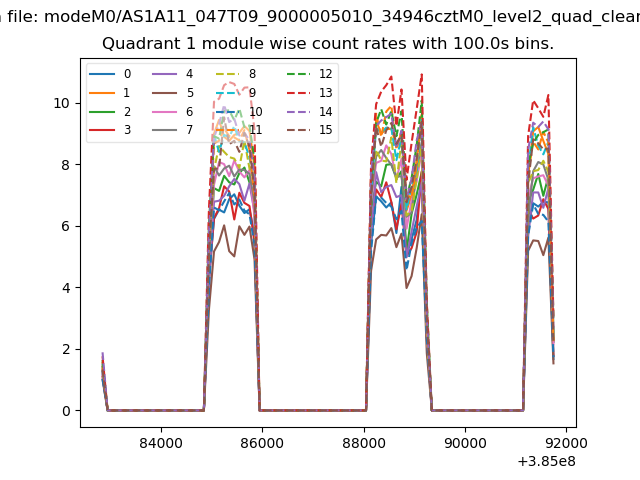
| Module-wise count rates for Quadrant A Data is divided into 100 sec bins |
 |
 |
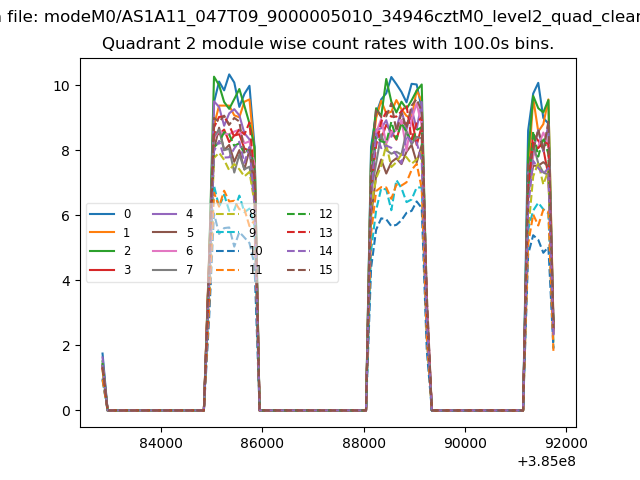
| Module-wise count rates for Quadrant B Data is divided into 100 sec bins |
 |
 |
| Module-wise count rates for Quadrant C Data is divided into 100 sec bins |
 |
 |
| Module-wise count rates for Quadrant D Data is divided into 100 sec bins |
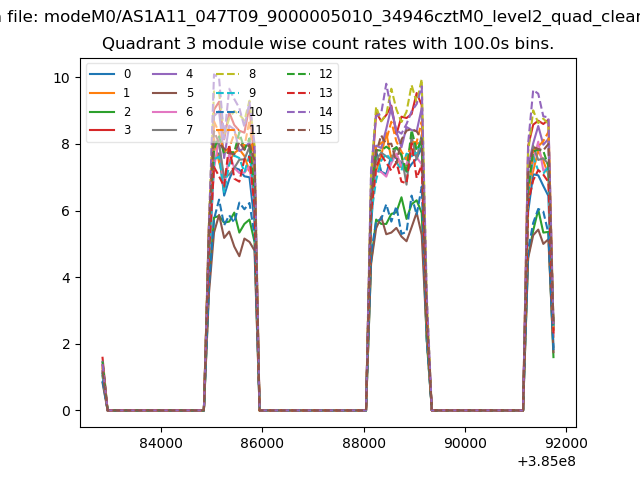 |
 |
| Parameter | Plot |
|---|---|
| CZT HV Monitor | 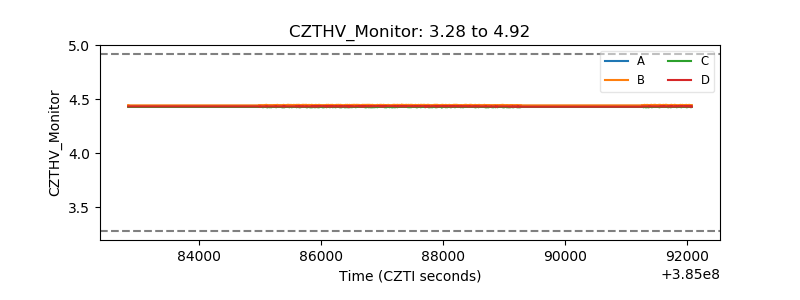 |
| D_VDD | 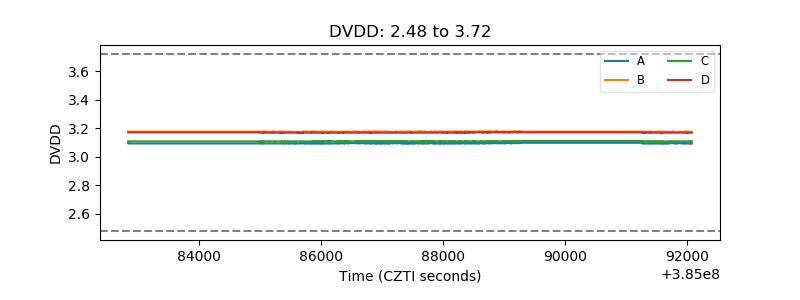 |
| Temperature 1 | 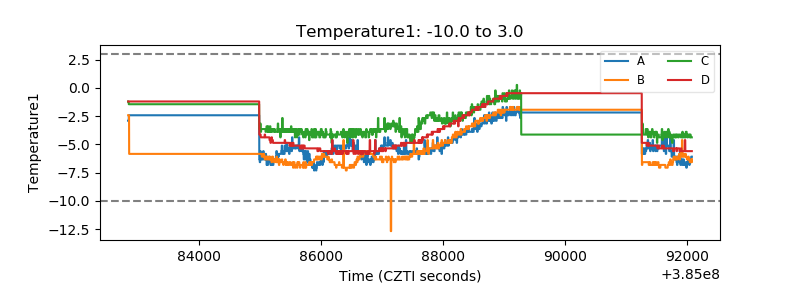 |
| Veto HV Monitor | 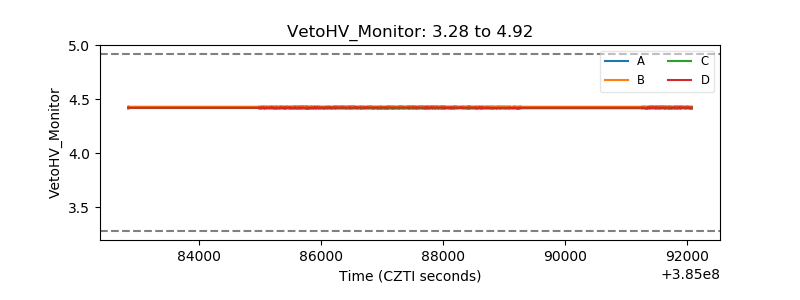 |
| Veto LLD | 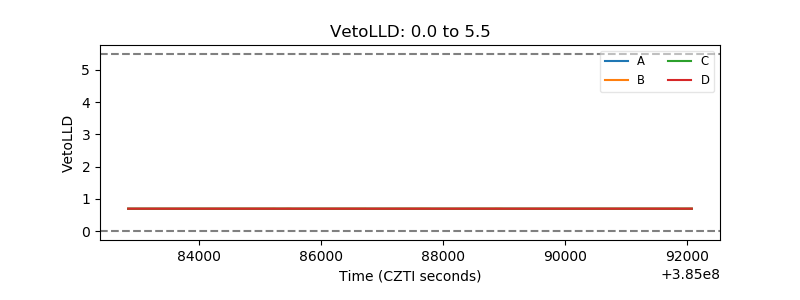 |
| Alpha Counter | 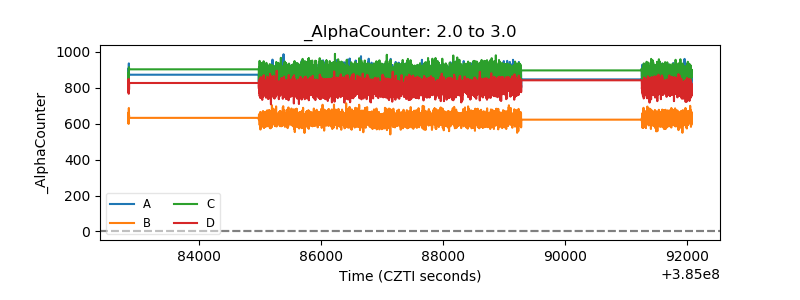 |
| _CPM_Rate | 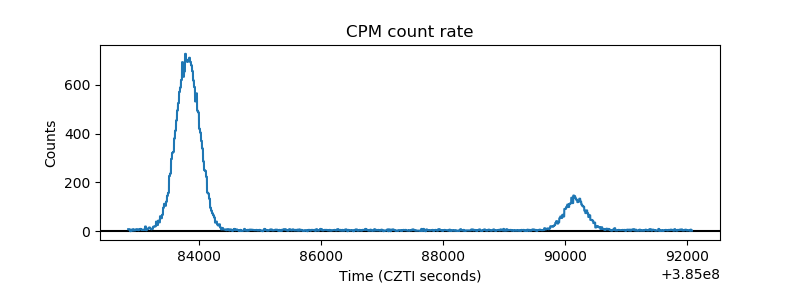 |
| CZT Counter | 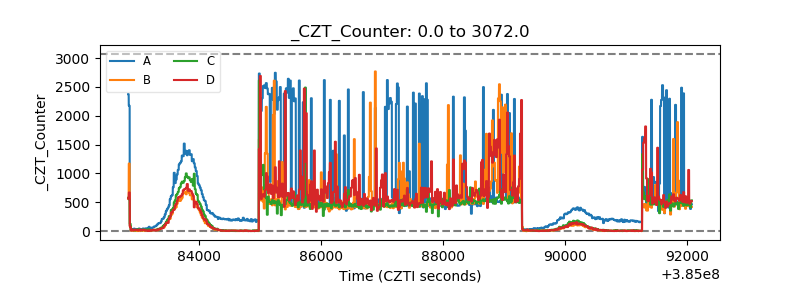 |
| +2.5 Volts monitor |  |
| +5 Volts monitor | 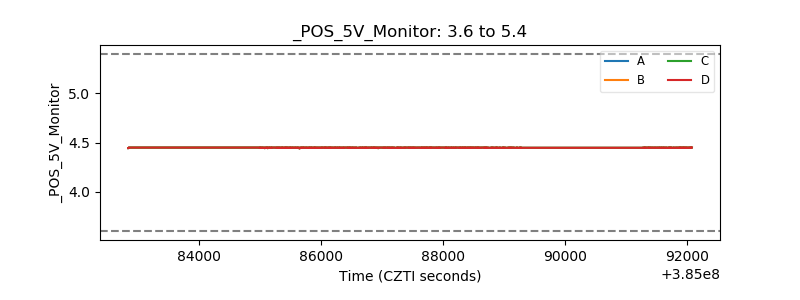 |
| _ROLL_ROT | 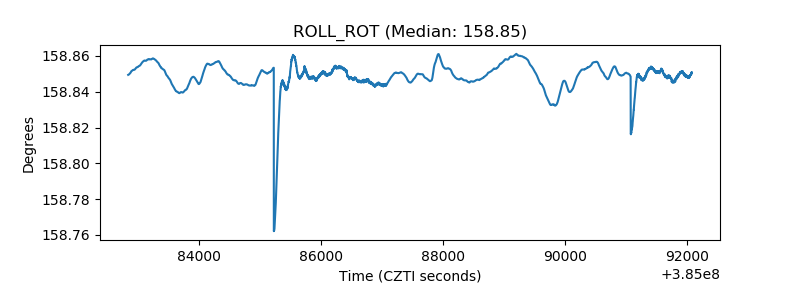 |
| _Roll_DEC | 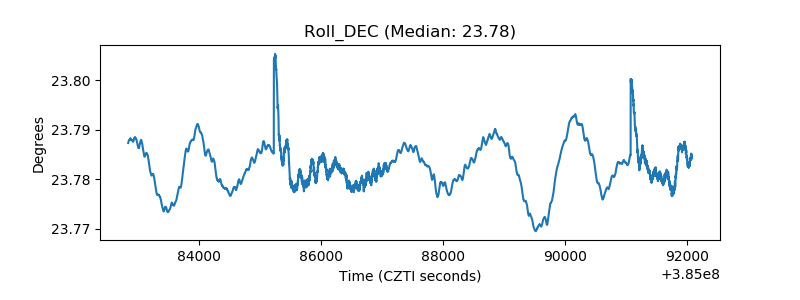 |
| _Roll_RA | 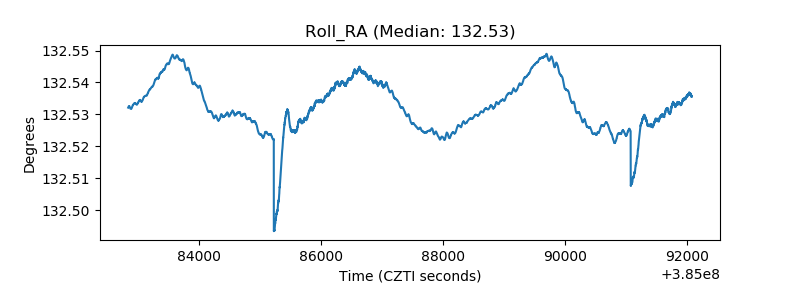 |
| Veto Counter | 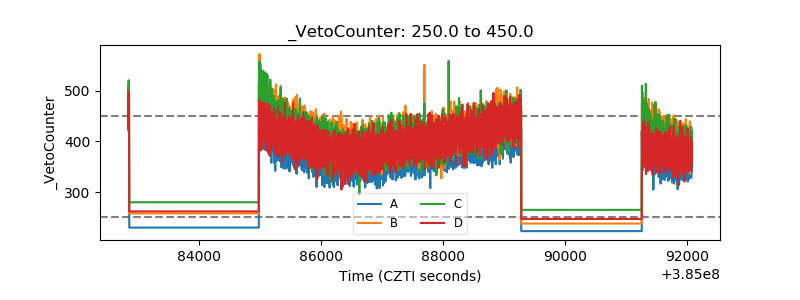 |