| Param | Original file | Final file |
|---|---|---|
| Filename | modeM0/AS1A11_047T09_9000005010_34945cztM0_level2.evt | modeM0/AS1A11_047T09_9000005010_34945cztM0_level2_quad_clean.evt |
| Size (bytes) | 458,562,240 | 32,437,440 |
| Size | 437.3 MB | 30.9 MB |
| Events in quadrant A | 6,515,709 | 116,789 |
| Events in quadrant B | 2,247,607 | 204,778 |
| Events in quadrant C | 2,117,088 | 202,925 |
| Events in quadrant D | 2,750,601 | 190,061 |
| Mode SS | |||
|---|---|---|---|
| Quadrant | BADHDUFLAG | Total packets | Discarded packets |
| A | 0 | 78 | 0 |
| B | 0 | 78 | 0 |
| C | 0 | 78 | 0 |
| D | 0 | 78 | 0 |
| Mode M0 | |||
|---|---|---|---|
| Quadrant | BADHDUFLAG | Total packets | Discarded packets |
| A | 0 | 21882 | 2 |
| B | 0 | 9015 | 1 |
| C | 0 | 8530 | 1 |
| D | 0 | 10719 | 1 |
| Mode M9 | |||
|---|---|---|---|
| Quadrant | BADHDUFLAG | Total packets | Discarded packets |
| A | 0 | 21 | 0 |
| B | 0 | 21 | 0 |
| C | 0 | 21 | 0 |
| D | 0 | 21 | 0 |
| Quadrant | Total seconds | Saturated seconds | Saturation percentage |
|---|---|---|---|
| A | 3768 | 2334 | 61.942675% |
| B | 3768 | 128 | 3.397028% |
| C | 3768 | 40 | 1.061571% |
| D | 3768 | 108 | 2.866242% |
Noise dominated data is calculated using 1-second bins in cleaned event files. If a bin has >2000 counts, and if more than 50% of those come from <1% of pixels, then it is considered to be noise-dominated and hence unusable.
| Quadrant | # 1 sec bins | Bins with >0 counts | Bins with >2000 counts | High rate bins dominated by noise | Noise dominated (total time) | Noise dominated (detector-on time) | Marked lightcurve |
|---|---|---|---|---|---|---|---|
| A | 5892 | 3768 | 2200 | 2200 | 37.34% | 58.39% | 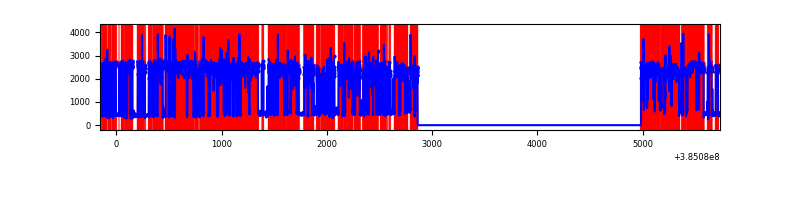 |
| B | 5892 | 3769 | 101 | 101 | 1.71% | 2.68% | 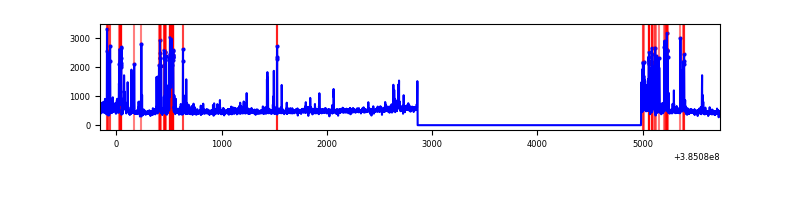 |
| C | 5892 | 3769 | 37 | 37 | 0.63% | 0.98% |  |
| D | 5892 | 3769 | 102 | 102 | 1.73% | 2.71% | 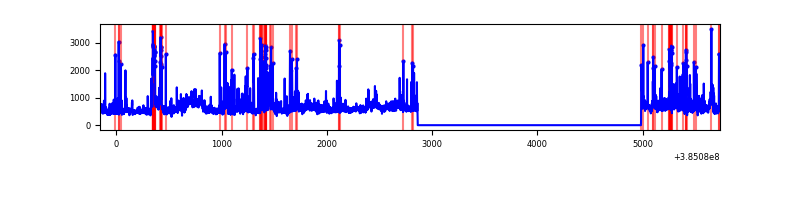 |
Top three noisy pixels from each quadrant. If the there are fewer than three noisy pixels in the level2.evt file, extra rows are filled as -1
| Pixel properties | Quadrant properties | ||||||
|---|---|---|---|---|---|---|---|
| Quadrant | DetID | PixID | Counts | Sigma | Mean | Median | Sigma |
| A | 15 | 169 | 5378564 | 91707.5 | 284 | 278 | 58.6 |
| A | 10 | 83 | 17921 | 300.84 | 284 | 278 | 58.6 |
| A | 13 | 6 | 10053 | 166.68 | 284 | 278 | 58.6 |
| B | 5 | 172 | 495944 | 5840.72 | 435 | 424 | 84.8 |
| B | 4 | 232 | 16775 | 192.73 | 435 | 424 | 84.8 |
| B | 12 | 111 | 10425 | 117.88 | 435 | 424 | 84.8 |
| C | 15 | 214 | 155542 | 1565.36 | 427 | 430 | 99.1 |
| C | 0 | 10 | 148867 | 1497.99 | 427 | 430 | 99.1 |
| C | 12 | 250 | 114222 | 1148.36 | 427 | 430 | 99.1 |
| D | 8 | 195 | 437437 | 4224.46 | 420 | 410 | 103.5 |
| D | 1 | 47 | 240168 | 2317.59 | 420 | 410 | 103.5 |
| D | 13 | 249 | 238420 | 2300.69 | 420 | 410 | 103.5 |
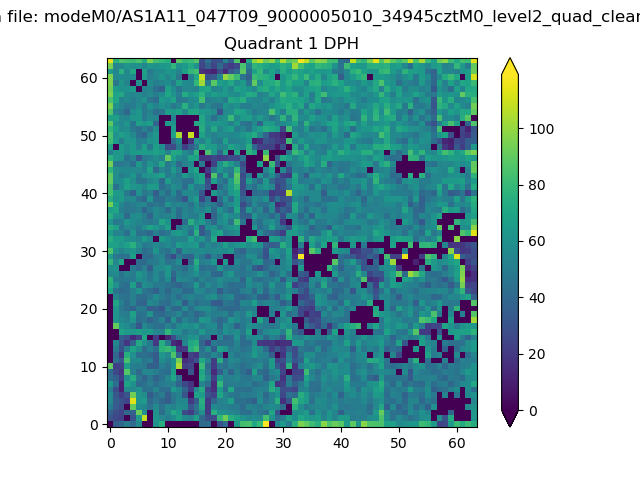
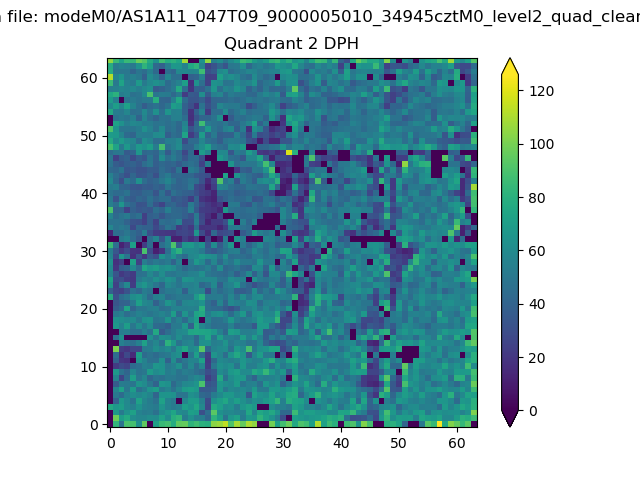
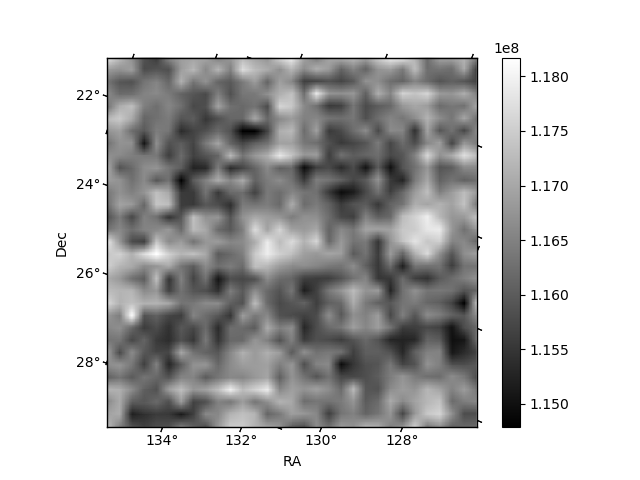
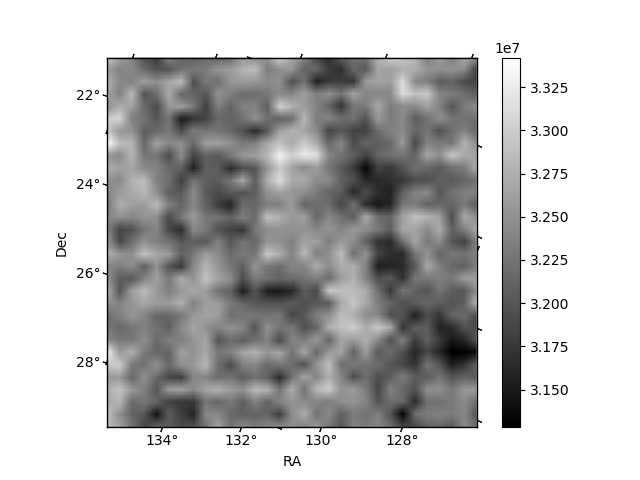
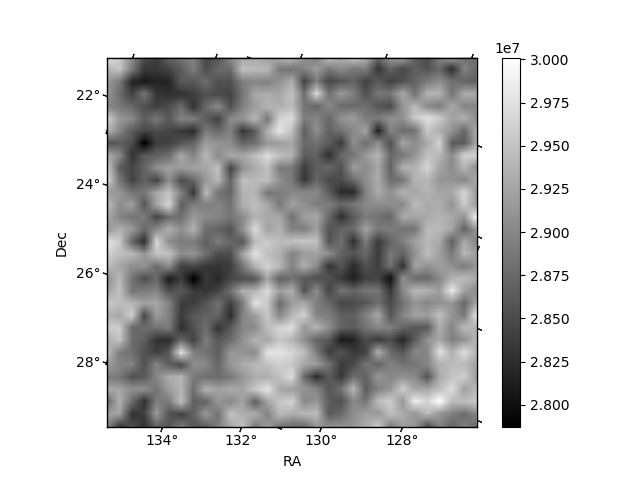
Histogram calculated using DETX and DETY for each event in the final _common_clean file
| Quadrant A | 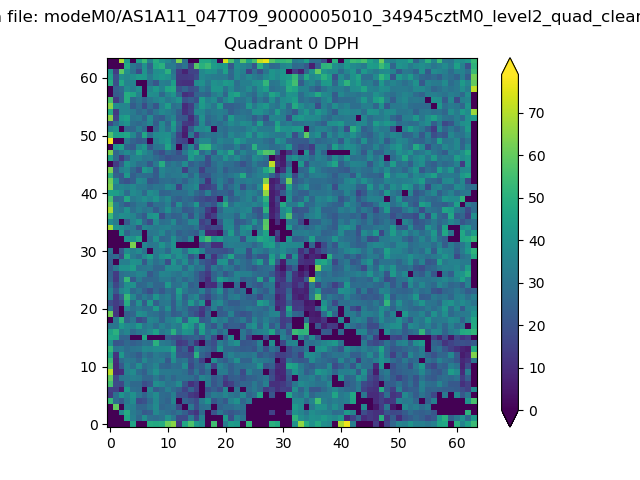 |
 |
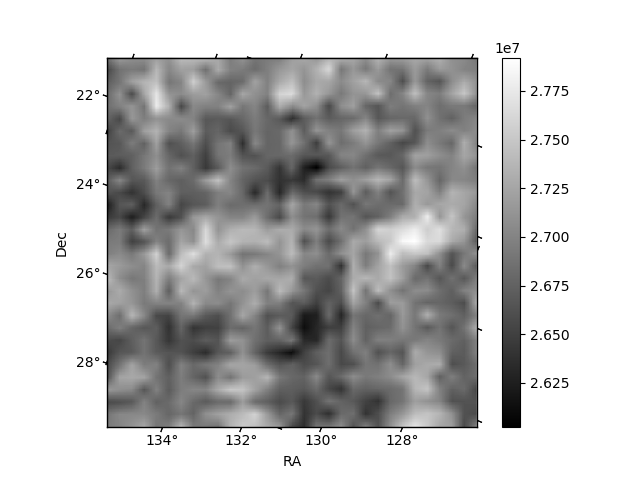
Quadrant B |
|---|---|---|---|
| Quadrant D | 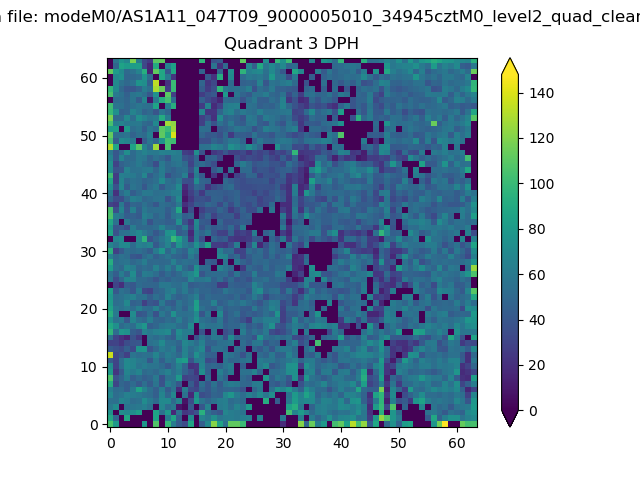 |
 |
Quadrant C |
| Plot type | Count rate plots | Images |
|---|---|---|
| Comparison with Poisson distribution Blue bars denote a histogram of data divided into 1 sec bins. Red curve is a Poisson curve with rate = median count rate of data. |
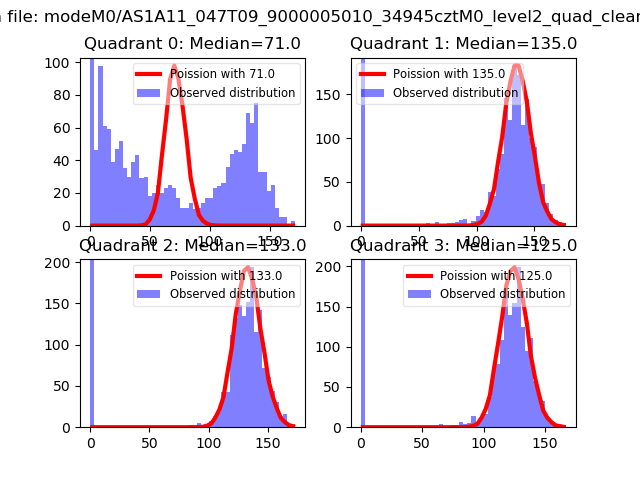 |
 |
| Quadrant-wise count rates Data is divided into 100 sec bins |
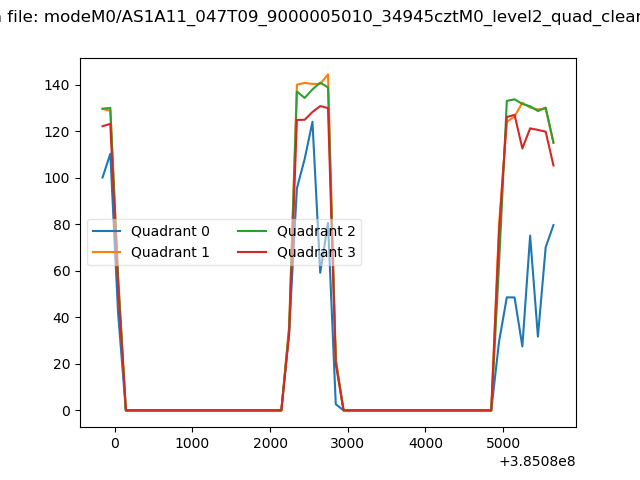 |
|
| Module-wise count rates for Quadrant A Data is divided into 100 sec bins |
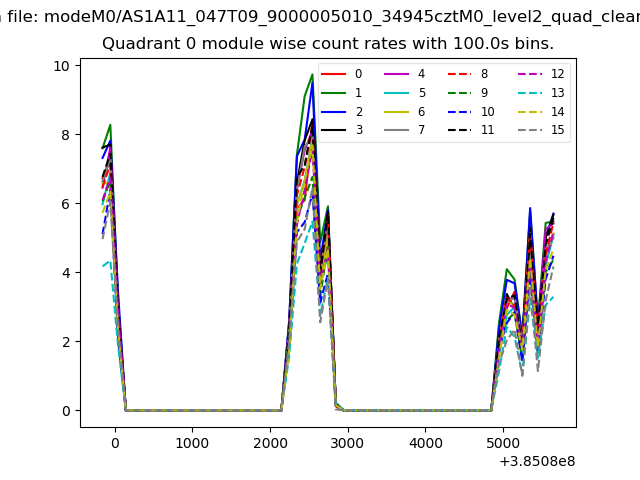 |
 |
| Module-wise count rates for Quadrant B Data is divided into 100 sec bins |
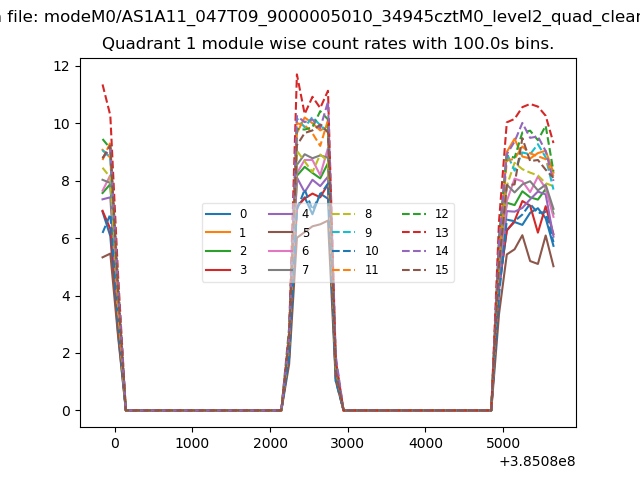 |
 |
| Module-wise count rates for Quadrant C Data is divided into 100 sec bins |
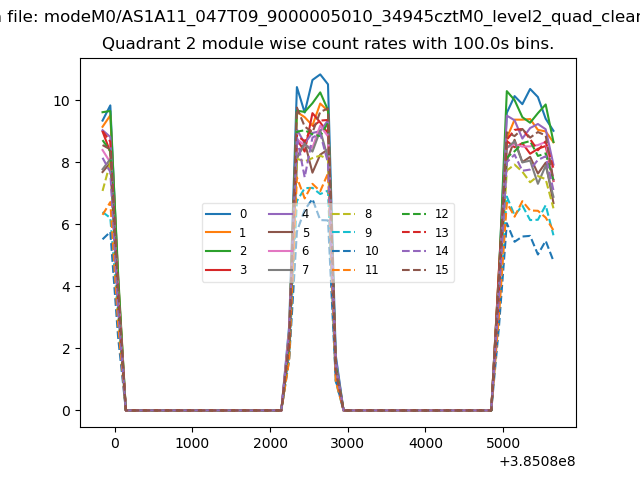 |
 |
| Module-wise count rates for Quadrant D Data is divided into 100 sec bins |
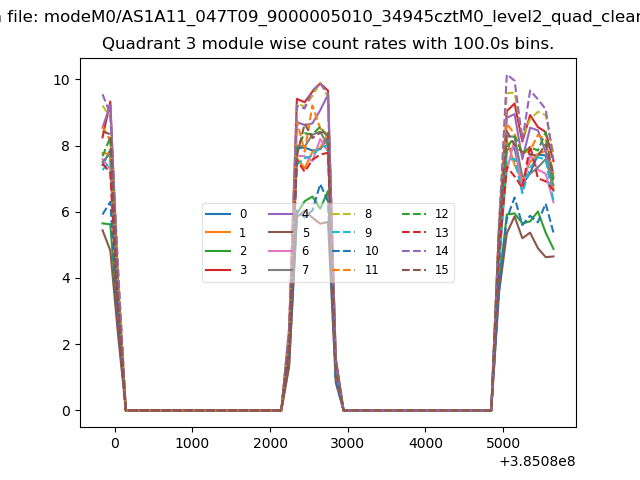 |
 |
| Parameter | Plot |
|---|---|
| CZT HV Monitor | 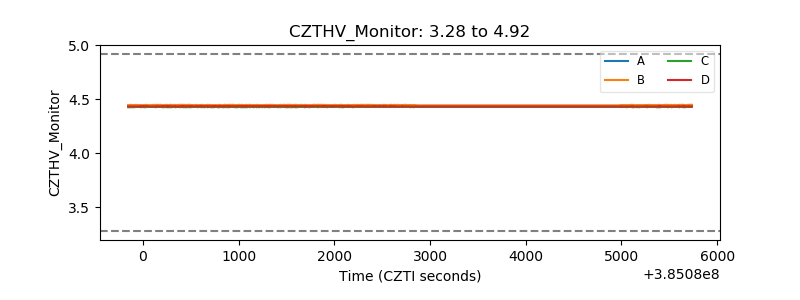 |
| D_VDD | 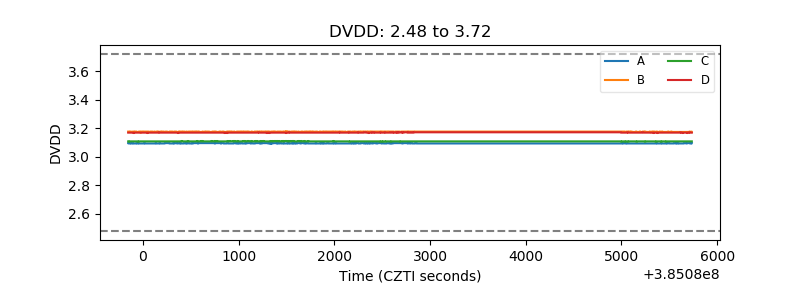 |
| Temperature 1 | 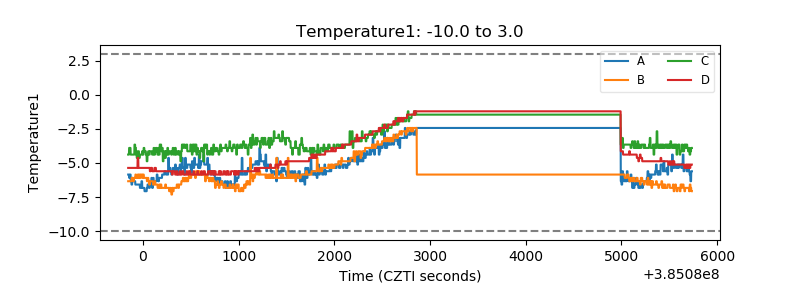 |
| Veto HV Monitor | 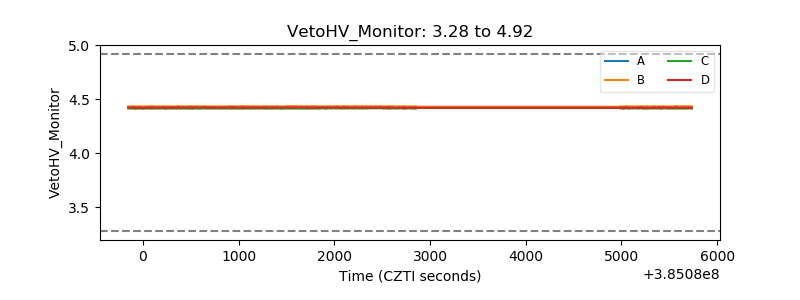 |
| Veto LLD | 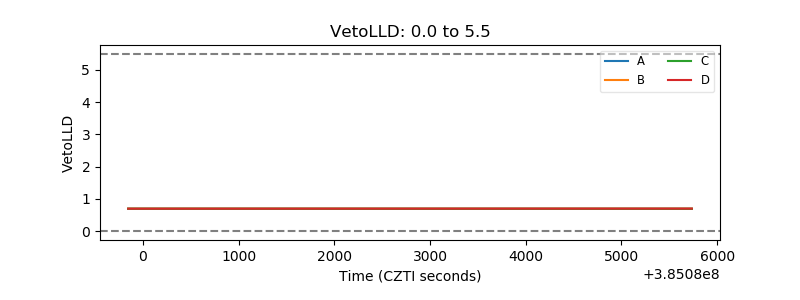 |
| Alpha Counter | 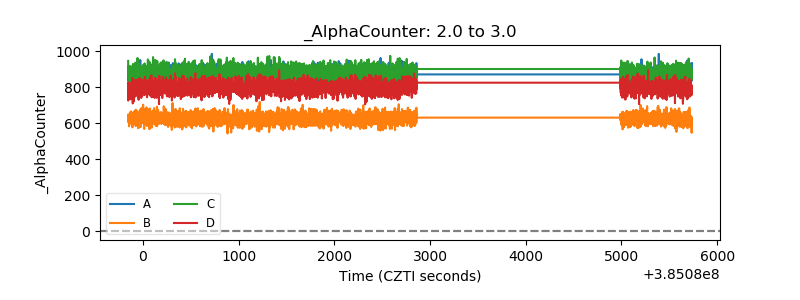 |
| _CPM_Rate | 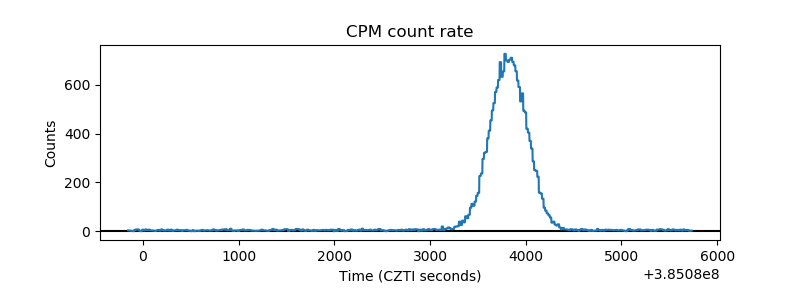 |
| CZT Counter | 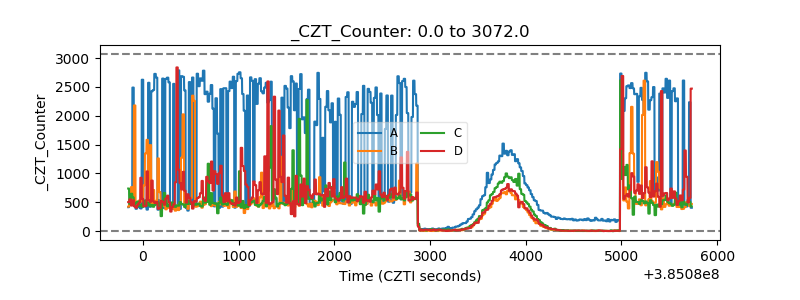 |
| +2.5 Volts monitor | 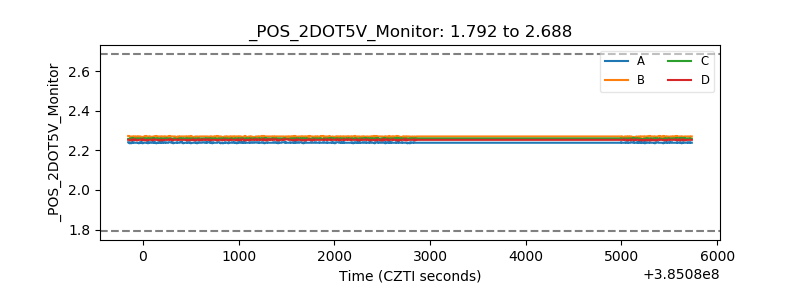 |
| +5 Volts monitor | 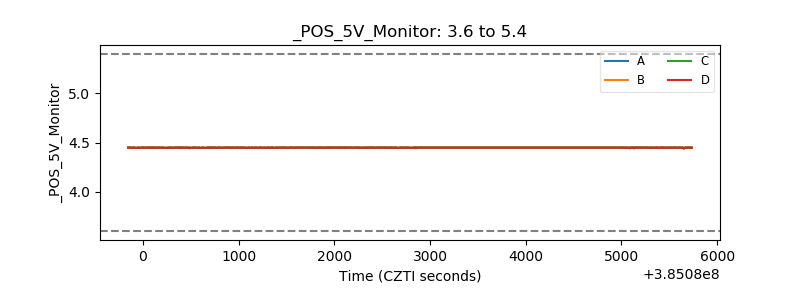 |
| _ROLL_ROT | 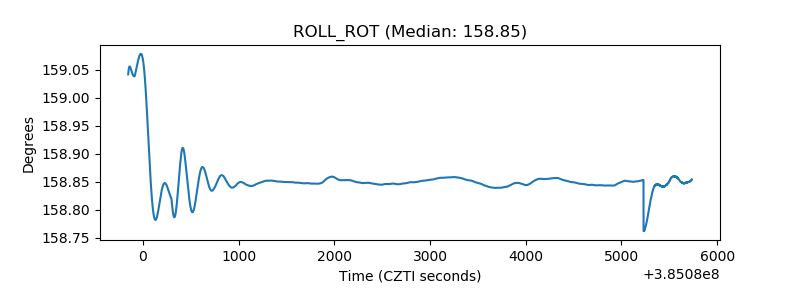 |
| _Roll_DEC | 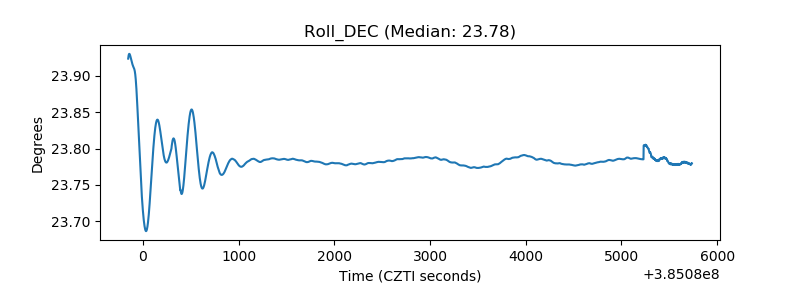 |
| _Roll_RA | 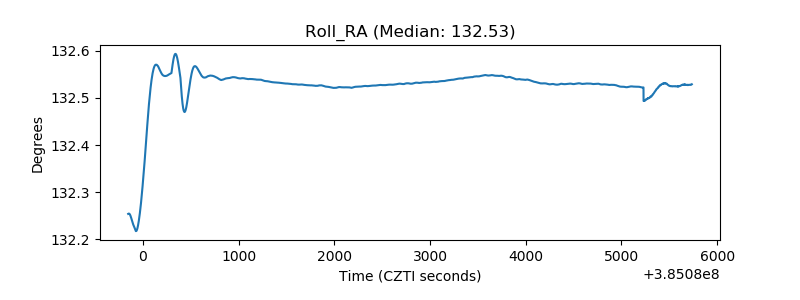 |
| Veto Counter | 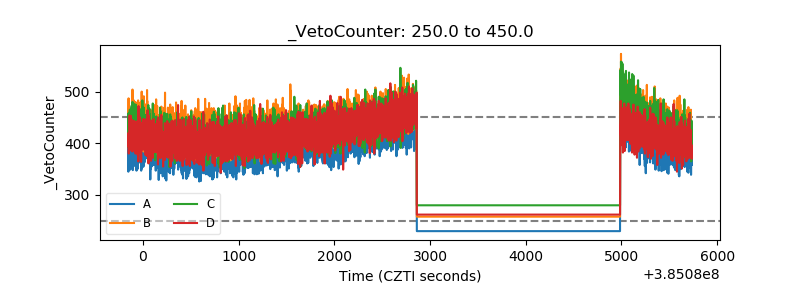 |