| Param | Original file | Final file |
|---|---|---|
| Filename | modeM0/AS1A11_047T01_9000005006_34938cztM0_level2.evt | modeM0/AS1A11_047T01_9000005006_34938cztM0_level2_quad_clean.evt |
| Size (bytes) | 346,668,480 | 61,145,280 |
| Size | 330.6 MB | 58.3 MB |
| Events in quadrant A | 3,335,899 | 409,151 |
| Events in quadrant B | 2,315,269 | 410,893 |
| Events in quadrant C | 1,692,473 | 410,634 |
| Events in quadrant D | 2,923,655 | 379,167 |
| Mode M9 | |||
|---|---|---|---|
| Quadrant | BADHDUFLAG | Total packets | Discarded packets |
| A | 0 | 7 | 0 |
| B | 0 | 7 | 0 |
| C | 0 | 7 | 0 |
| D | 0 | 8 | 0 |
| Mode SS | |||
|---|---|---|---|
| Quadrant | BADHDUFLAG | Total packets | Discarded packets |
| A | 0 | 68 | 0 |
| B | 0 | 68 | 0 |
| C | 0 | 68 | 0 |
| D | 0 | 68 | 0 |
| Mode M0 | |||
|---|---|---|---|
| Quadrant | BADHDUFLAG | Total packets | Discarded packets |
| A | 0 | 12328 | 1 |
| B | 0 | 9159 | 1 |
| C | 0 | 7142 | 1 |
| D | 0 | 11001 | 1 |
| Quadrant | Total seconds | Saturated seconds | Saturation percentage |
|---|---|---|---|
| A | 3403 | 185 | 5.436380% |
| B | 3403 | 197 | 5.789010% |
| C | 3403 | 39 | 1.146048% |
| D | 3403 | 153 | 4.496033% |
Noise dominated data is calculated using 1-second bins in cleaned event files. If a bin has >2000 counts, and if more than 50% of those come from <1% of pixels, then it is considered to be noise-dominated and hence unusable.
| Quadrant | # 1 sec bins | Bins with >0 counts | Bins with >2000 counts | High rate bins dominated by noise | Noise dominated (total time) | Noise dominated (detector-on time) | Marked lightcurve |
|---|---|---|---|---|---|---|---|
| A | 3403 | 3403 | 157 | 157 | 4.61% | 4.61% | 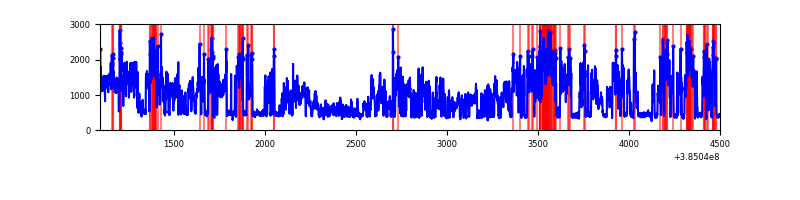 |
| B | 3403 | 3403 | 156 | 156 | 4.58% | 4.58% | 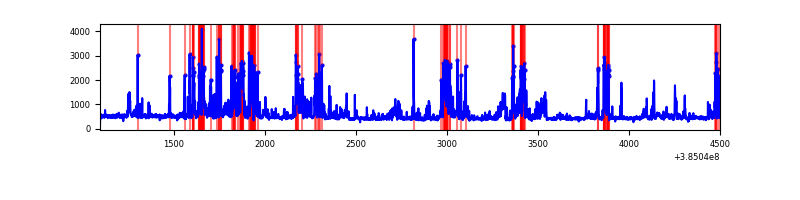 |
| C | 3403 | 3403 | 33 | 33 | 0.97% | 0.97% | 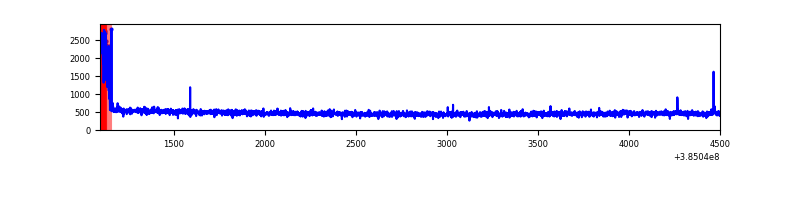 |
| D | 3403 | 3403 | 167 | 167 | 4.91% | 4.91% | 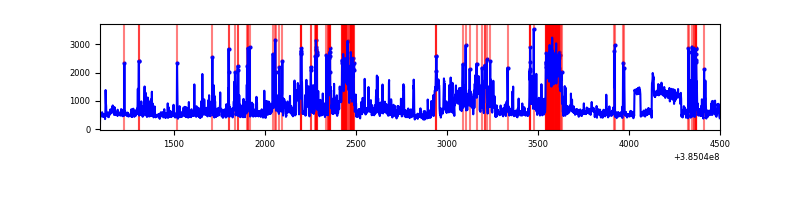 |
Top three noisy pixels from each quadrant. If the there are fewer than three noisy pixels in the level2.evt file, extra rows are filled as -1
| Pixel properties | Quadrant properties | ||||||
|---|---|---|---|---|---|---|---|
| Quadrant | DetID | PixID | Counts | Sigma | Mean | Median | Sigma |
| A | 15 | 169 | 1844182 | 24006.04 | 376 | 368 | 76.8 |
| A | 10 | 83 | 35852 | 461.99 | 376 | 368 | 76.8 |
| A | 13 | 254 | 5741 | 69.96 | 376 | 368 | 76.8 |
| B | 5 | 172 | 553086 | 7700.76 | 368 | 358 | 71.8 |
| B | 4 | 232 | 141849 | 1971.29 | 368 | 358 | 71.8 |
| B | 0 | 190 | 84016 | 1165.55 | 368 | 358 | 71.8 |
| C | 15 | 214 | 140755 | 1634.76 | 367 | 369 | 85.9 |
| C | 0 | 10 | 101157 | 1173.65 | 367 | 369 | 85.9 |
| C | 14 | 67 | 10726 | 120.6 | 367 | 369 | 85.9 |
| D | 8 | 195 | 444841 | 4945.05 | 366 | 356 | 89.9 |
| D | 2 | 31 | 380411 | 4228.24 | 366 | 356 | 89.9 |
| D | 10 | 118 | 105358 | 1168.18 | 366 | 356 | 89.9 |
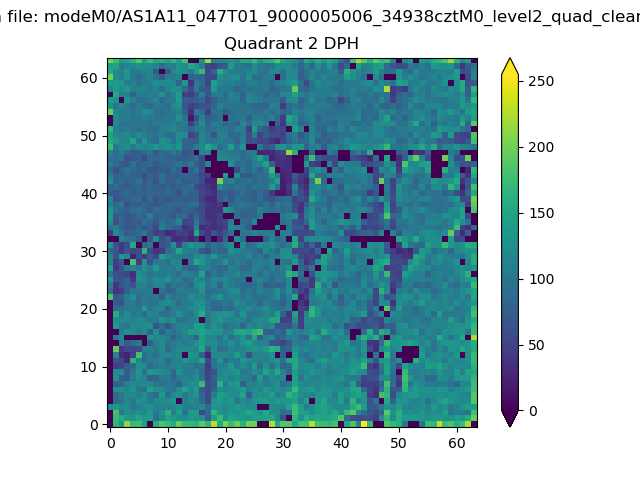
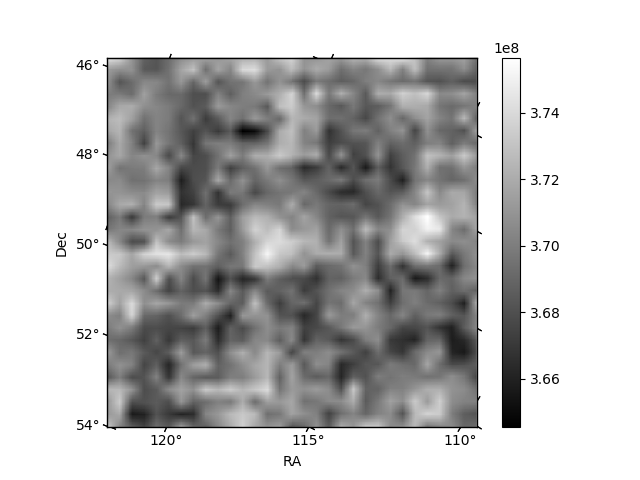
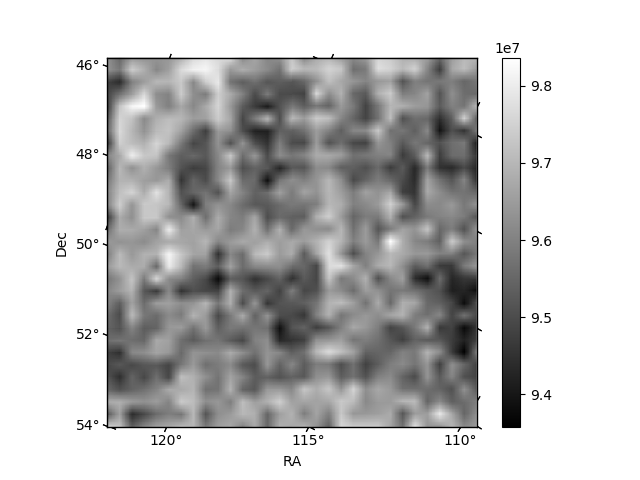
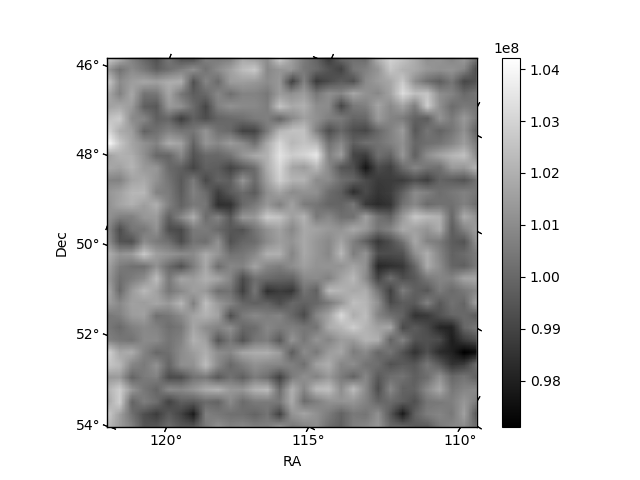
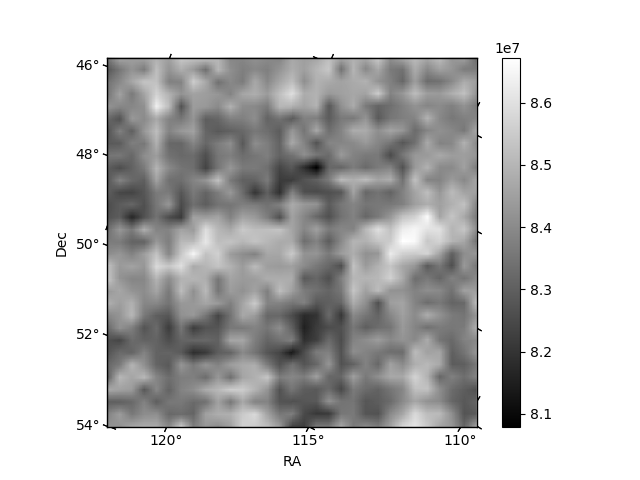
Histogram calculated using DETX and DETY for each event in the final _common_clean file
| Quadrant A | 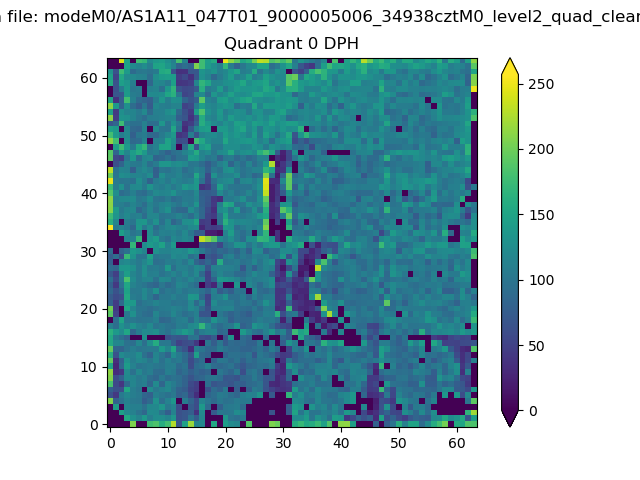 |
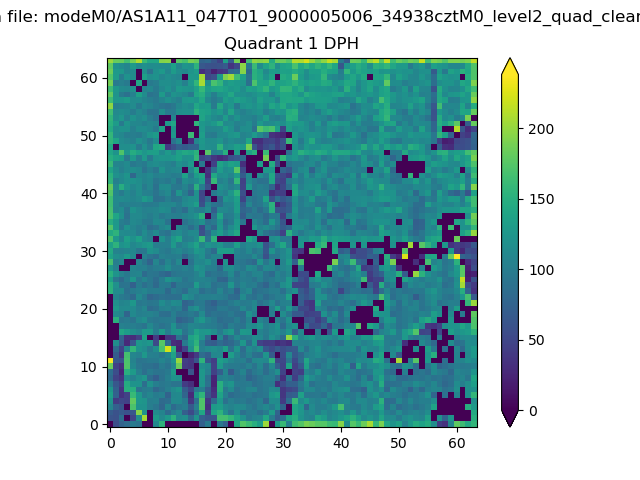 |
Quadrant B |
|---|---|---|---|
| Quadrant D | 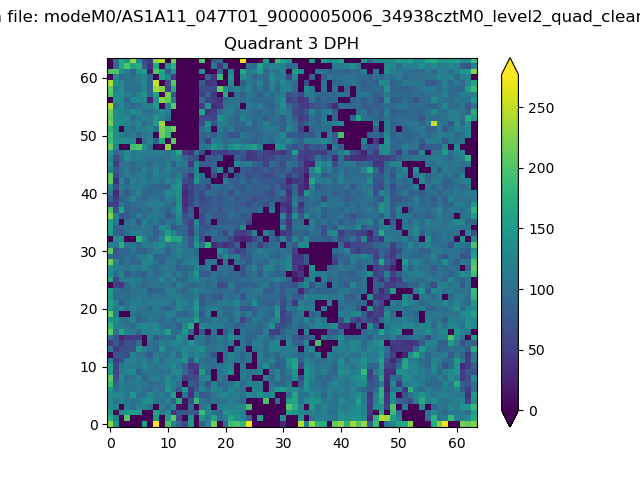 |
 |
Quadrant C |
| Plot type | Count rate plots | Images |
|---|---|---|
| Comparison with Poisson distribution Blue bars denote a histogram of data divided into 1 sec bins. Red curve is a Poisson curve with rate = median count rate of data. |
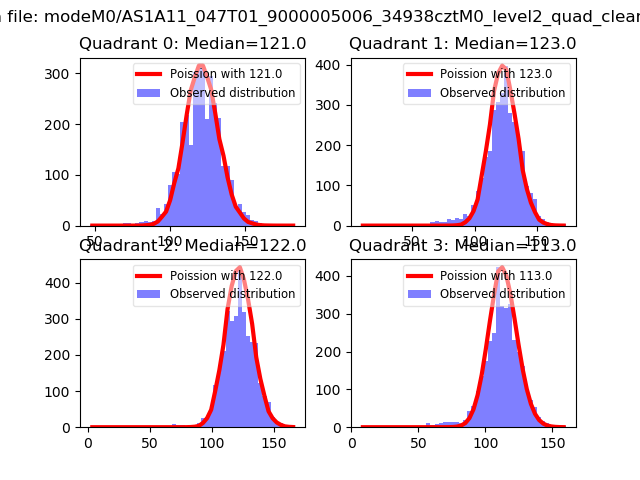 |
 |
| Quadrant-wise count rates Data is divided into 100 sec bins |
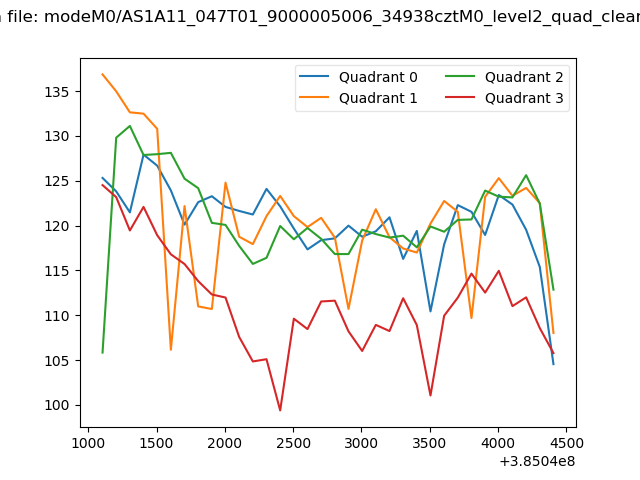 |
|
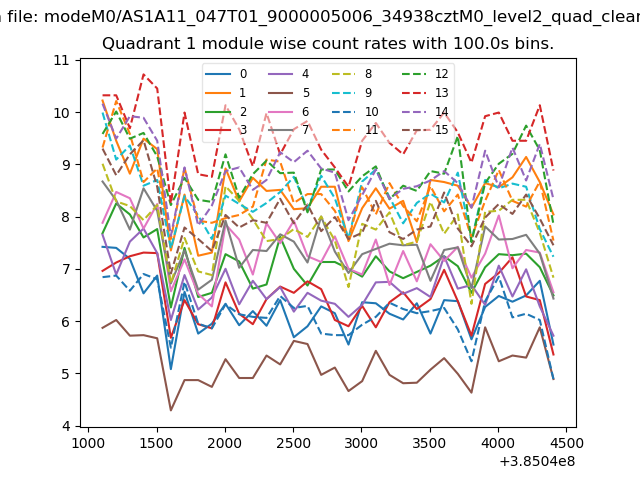
| Module-wise count rates for Quadrant A Data is divided into 100 sec bins |
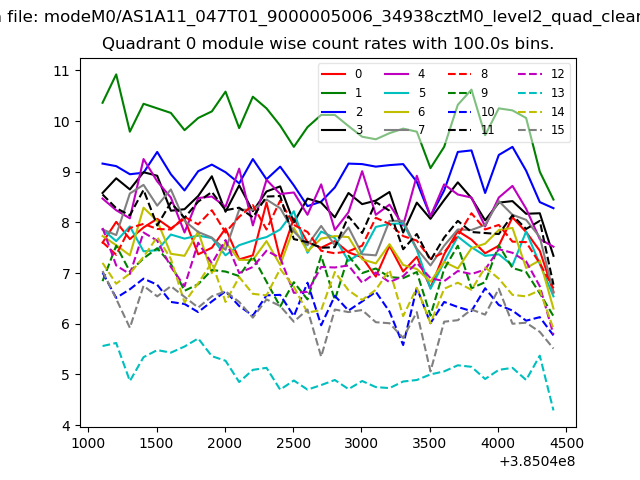 |
 |
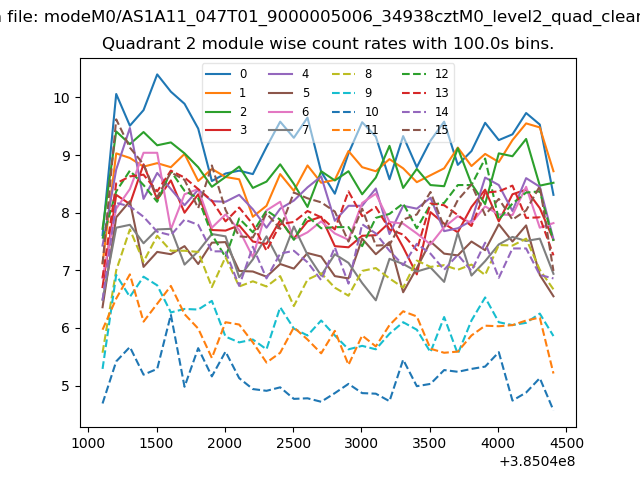
| Module-wise count rates for Quadrant B Data is divided into 100 sec bins |
 |
 |
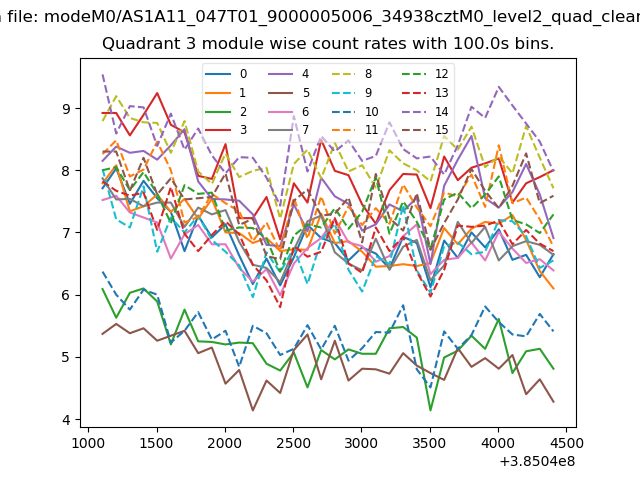
| Module-wise count rates for Quadrant C Data is divided into 100 sec bins |
 |
 |
| Module-wise count rates for Quadrant D Data is divided into 100 sec bins |
 |
 |
| Parameter | Plot |
|---|---|
| CZT HV Monitor | 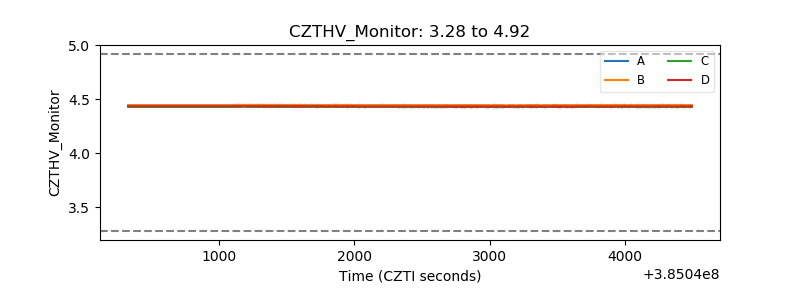 |
| D_VDD | 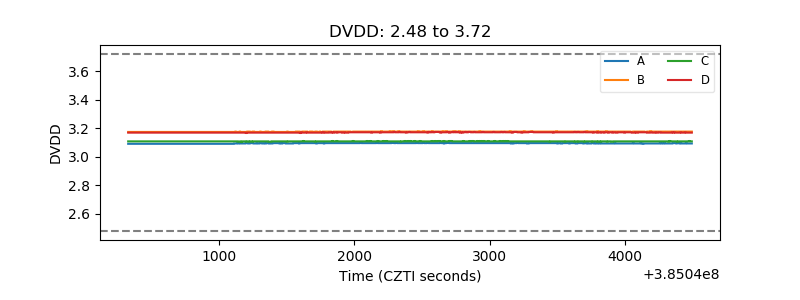 |
| Temperature 1 | 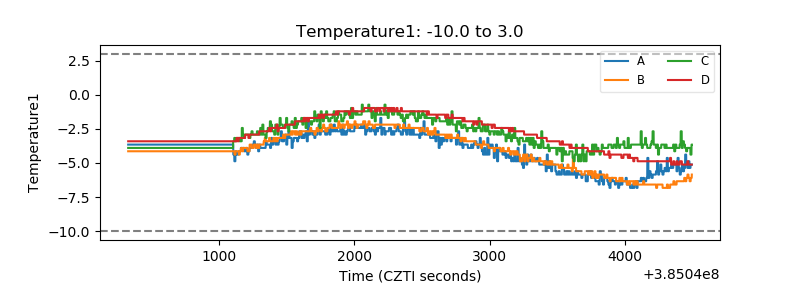 |
| Veto HV Monitor | 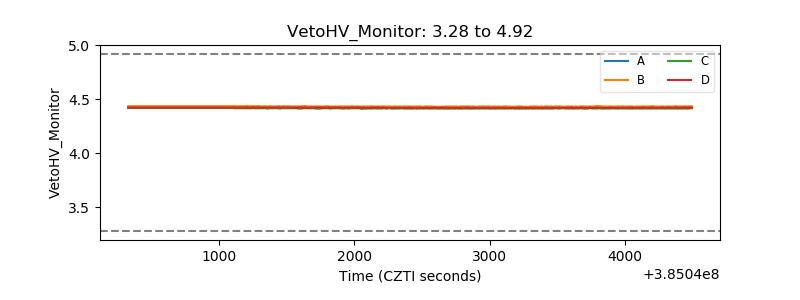 |
| Veto LLD | 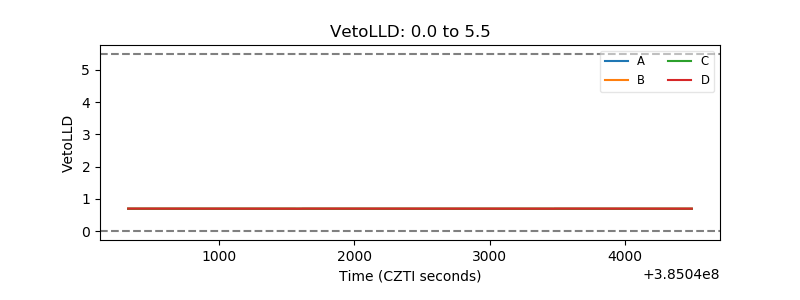 |
| Alpha Counter | 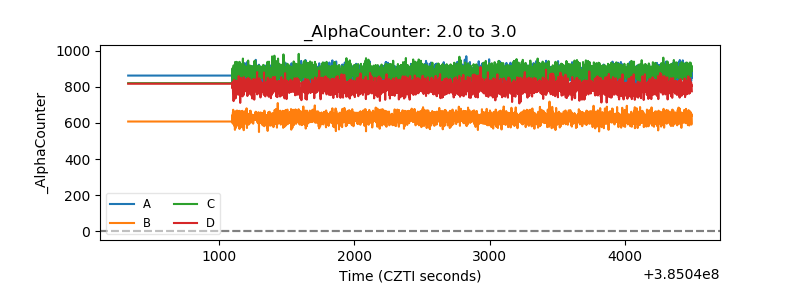 |
| _CPM_Rate | 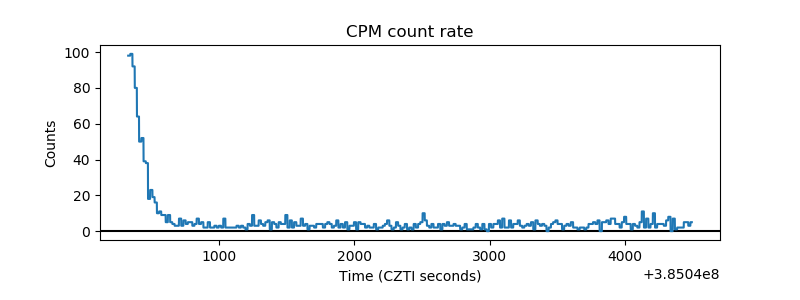 |
| CZT Counter | 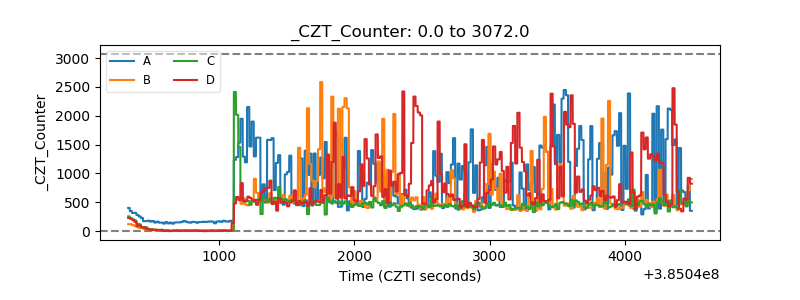 |
| +2.5 Volts monitor | 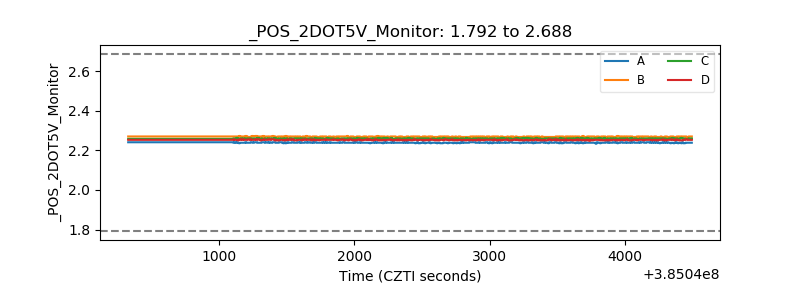 |
| +5 Volts monitor | 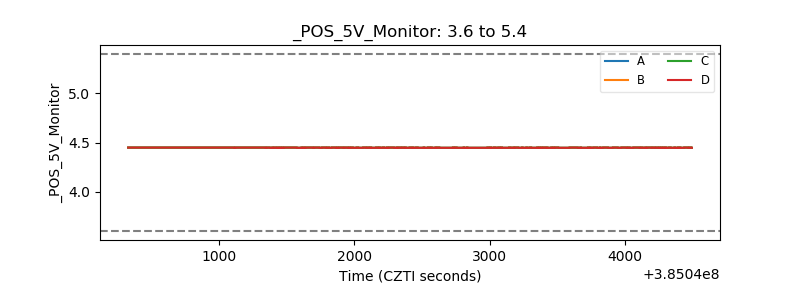 |
| _ROLL_ROT | 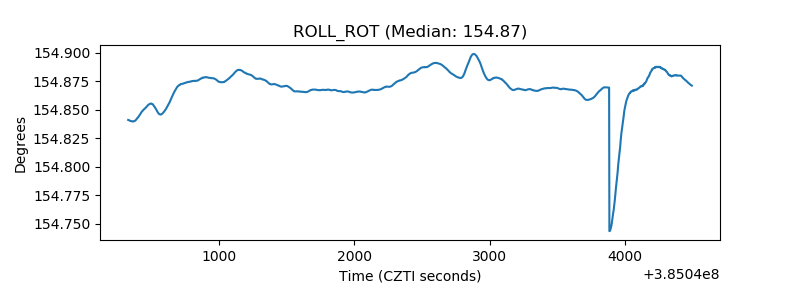 |
| _Roll_DEC | 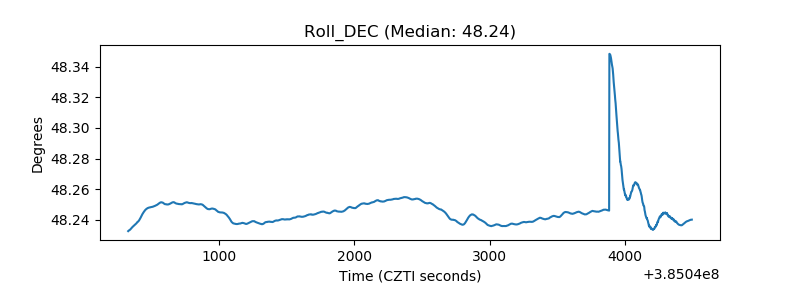 |
| _Roll_RA | 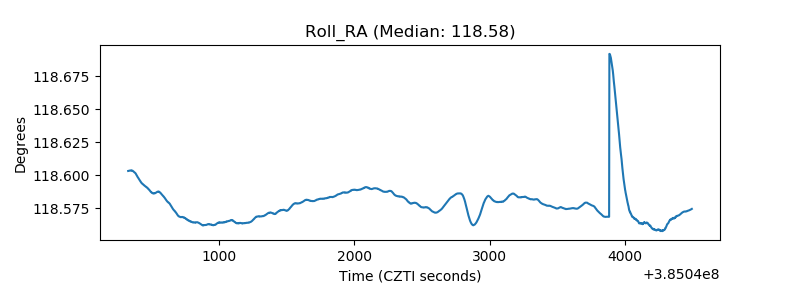 |
| Veto Counter | 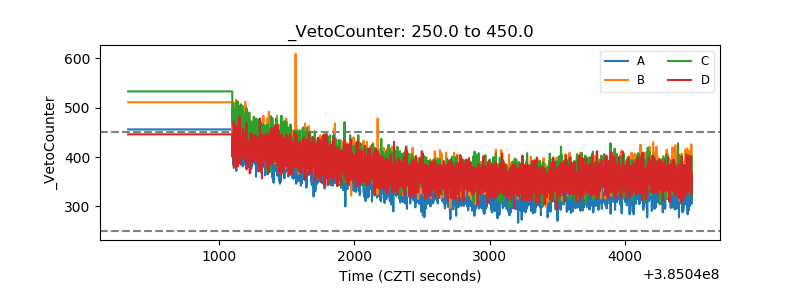 |