| Param | Original file | Final file |
|---|---|---|
| Filename | modeM0/AS1A11_047T01_9000005006_34937cztM0_level2.evt | modeM0/AS1A11_047T01_9000005006_34937cztM0_level2_quad_clean.evt |
| Size (bytes) | 646,773,120 | 94,656,960 |
| Size | 616.8 MB | 90.3 MB |
| Events in quadrant A | 6,703,751 | 598,969 |
| Events in quadrant B | 4,137,642 | 627,237 |
| Events in quadrant C | 3,232,926 | 629,864 |
| Events in quadrant D | 5,094,819 | 577,557 |
| Mode M9 | |||
|---|---|---|---|
| Quadrant | BADHDUFLAG | Total packets | Discarded packets |
| A | 0 | 28 | 0 |
| B | 0 | 28 | 0 |
| C | 0 | 28 | 0 |
| D | 0 | 28 | 0 |
| Mode SS | |||
|---|---|---|---|
| Quadrant | BADHDUFLAG | Total packets | Discarded packets |
| A | 0 | 128 | 0 |
| B | 0 | 128 | 0 |
| C | 0 | 128 | 0 |
| D | 0 | 128 | 0 |
| Mode M0 | |||
|---|---|---|---|
| Quadrant | BADHDUFLAG | Total packets | Discarded packets |
| A | 0 | 24174 | 3 |
| B | 0 | 16297 | 2 |
| C | 0 | 13206 | 2 |
| D | 0 | 19457 | 2 |
| Quadrant | Total seconds | Saturated seconds | Saturation percentage |
|---|---|---|---|
| A | 6194 | 850 | 13.722958% |
| B | 6194 | 353 | 5.699064% |
| C | 6194 | 85 | 1.372296% |
| D | 6194 | 291 | 4.698095% |
Noise dominated data is calculated using 1-second bins in cleaned event files. If a bin has >2000 counts, and if more than 50% of those come from <1% of pixels, then it is considered to be noise-dominated and hence unusable.
| Quadrant | # 1 sec bins | Bins with >0 counts | Bins with >2000 counts | High rate bins dominated by noise | Noise dominated (total time) | Noise dominated (detector-on time) | Marked lightcurve |
|---|---|---|---|---|---|---|---|
| A | 9030 | 6196 | 742 | 742 | 8.22% | 11.98% | 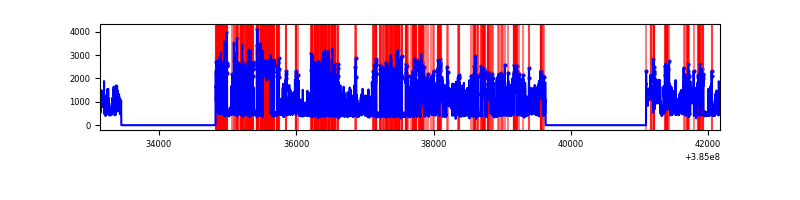 |
| B | 9029 | 6195 | 275 | 275 | 3.05% | 4.44% | 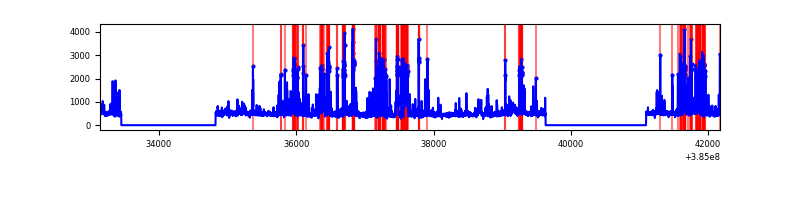 |
| C | 9030 | 6196 | 74 | 74 | 0.82% | 1.19% | 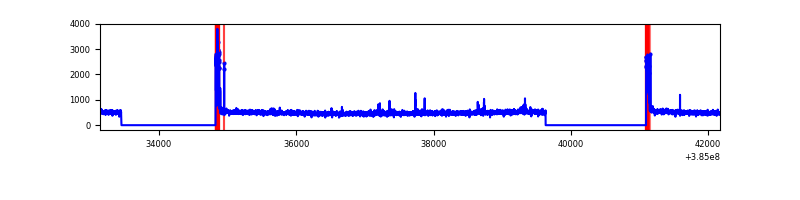 |
| D | 9030 | 6196 | 291 | 291 | 3.22% | 4.70% | 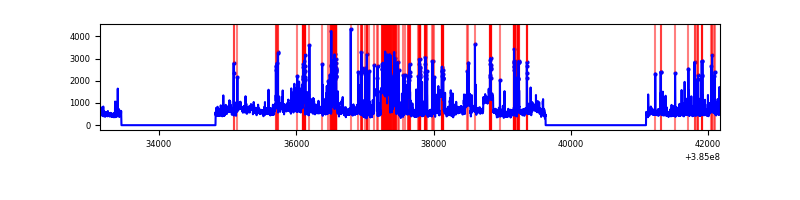 |
Top three noisy pixels from each quadrant. If the there are fewer than three noisy pixels in the level2.evt file, extra rows are filled as -1
| Pixel properties | Quadrant properties | ||||||
|---|---|---|---|---|---|---|---|
| Quadrant | DetID | PixID | Counts | Sigma | Mean | Median | Sigma |
| A | 15 | 169 | 4008458 | 29413.33 | 678 | 664 | 136.3 |
| A | 10 | 83 | 61087 | 443.45 | 678 | 664 | 136.3 |
| A | 13 | 254 | 9995 | 68.48 | 678 | 664 | 136.3 |
| B | 5 | 172 | 1095128 | 8194.74 | 694 | 674 | 133.6 |
| B | 0 | 190 | 162275 | 1209.99 | 694 | 674 | 133.6 |
| B | 4 | 232 | 92732 | 689.29 | 694 | 674 | 133.6 |
| C | 15 | 214 | 260470 | 1612.22 | 689 | 694 | 161.1 |
| C | 0 | 10 | 214309 | 1325.73 | 689 | 694 | 161.1 |
| C | 14 | 67 | 32077 | 194.77 | 689 | 694 | 161.1 |
| D | 8 | 195 | 699678 | 4147.2 | 681 | 660 | 168.6 |
| D | 2 | 31 | 462125 | 2737.82 | 681 | 660 | 168.6 |
| D | 7 | 38 | 402364 | 2383.27 | 681 | 660 | 168.6 |
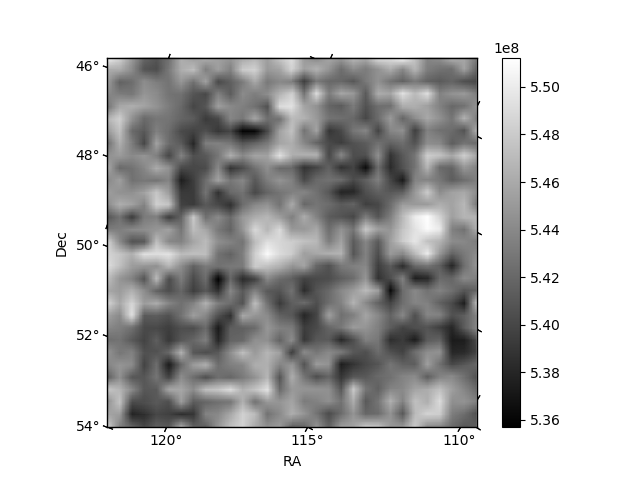
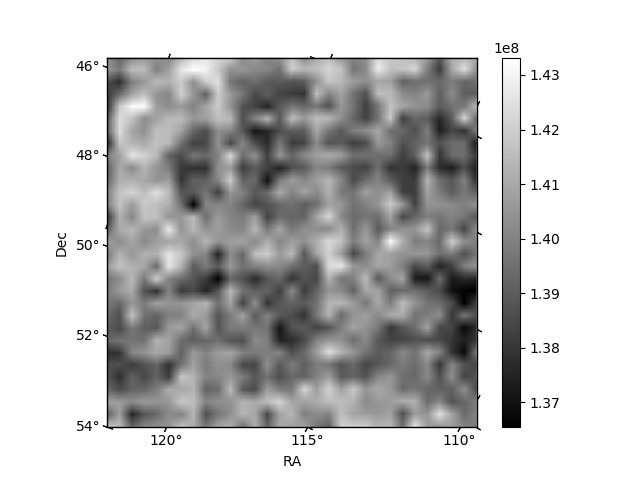
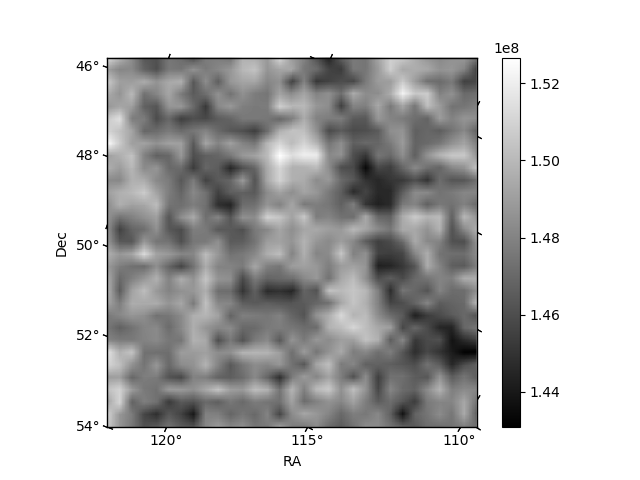
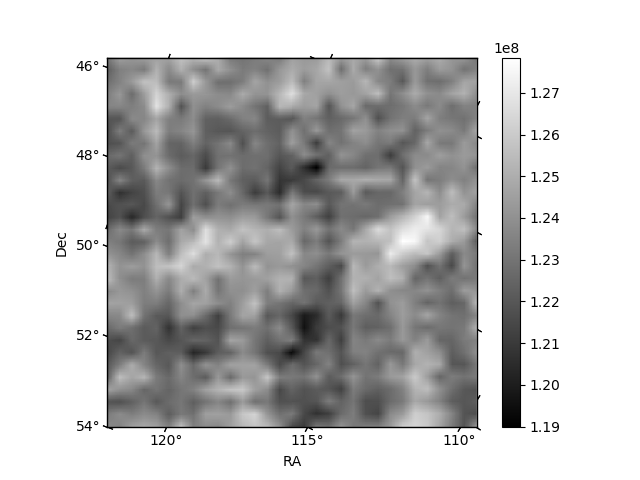
Histogram calculated using DETX and DETY for each event in the final _common_clean file
| Quadrant A | 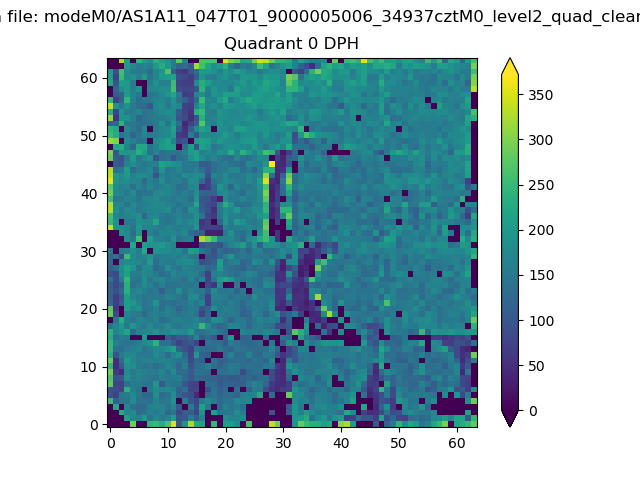 |
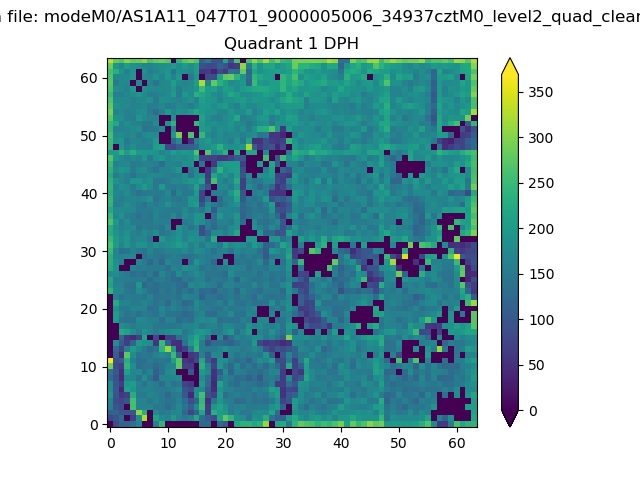 |
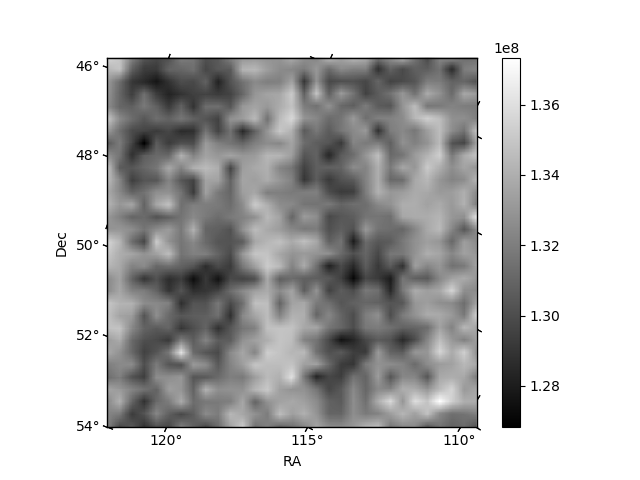
Quadrant B |
|---|---|---|---|
| Quadrant D | 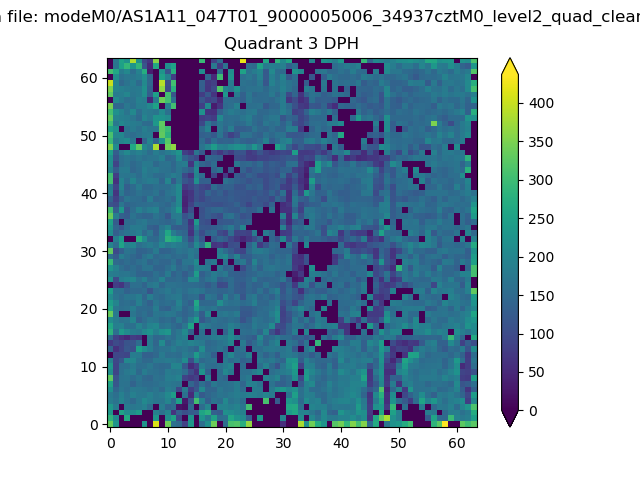 |
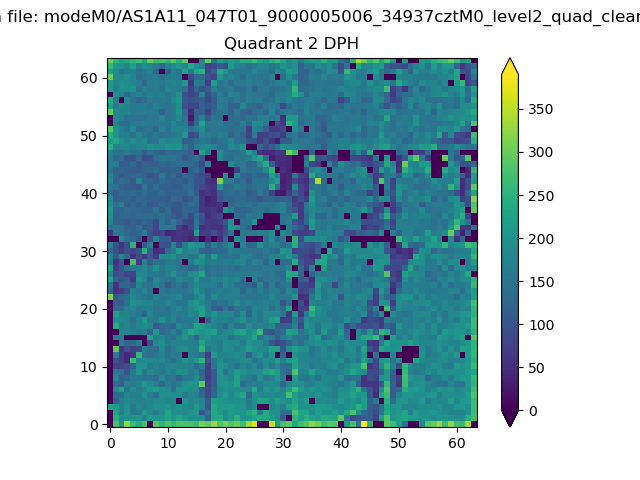 |
Quadrant C |
| Plot type | Count rate plots | Images |
|---|---|---|
| Comparison with Poisson distribution Blue bars denote a histogram of data divided into 1 sec bins. Red curve is a Poisson curve with rate = median count rate of data. |
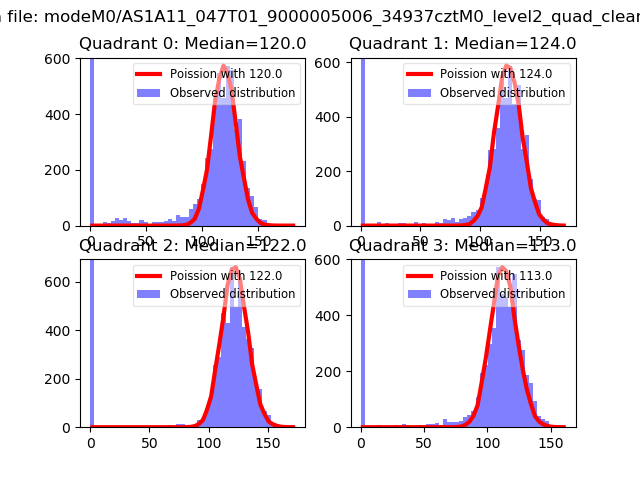 |
 |
| Quadrant-wise count rates Data is divided into 100 sec bins |
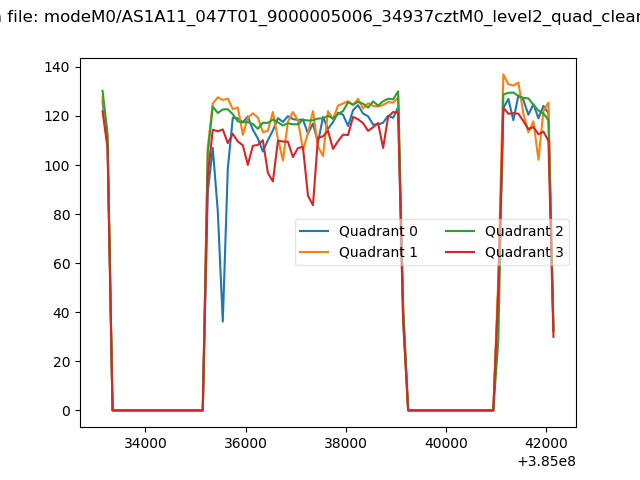 |
|
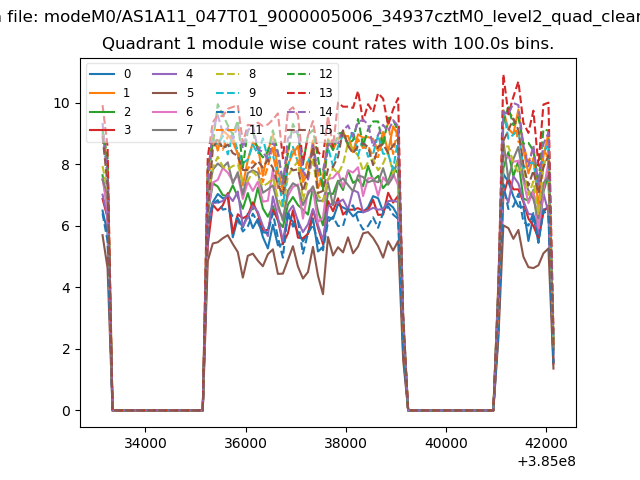
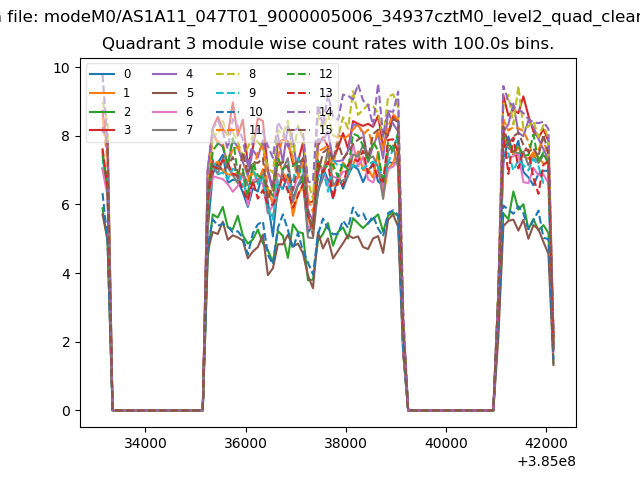
| Module-wise count rates for Quadrant A Data is divided into 100 sec bins |
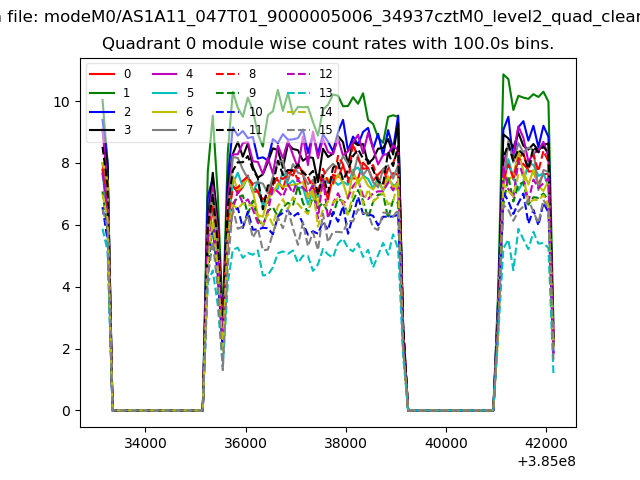 |
 |
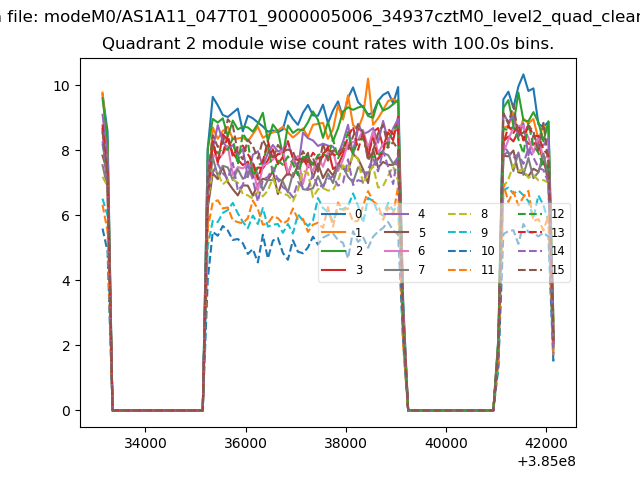
| Module-wise count rates for Quadrant B Data is divided into 100 sec bins |
 |
 |
| Module-wise count rates for Quadrant C Data is divided into 100 sec bins |
 |
 |
| Module-wise count rates for Quadrant D Data is divided into 100 sec bins |
 |
 |
| Parameter | Plot |
|---|---|
| CZT HV Monitor | 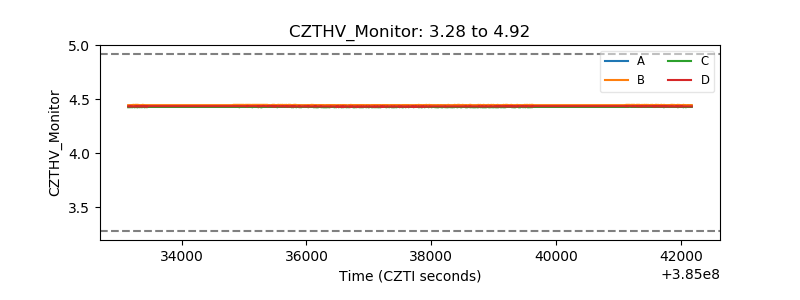 |
| D_VDD | 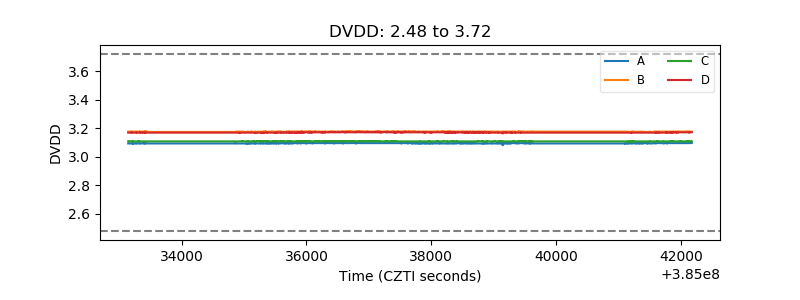 |
| Temperature 1 | 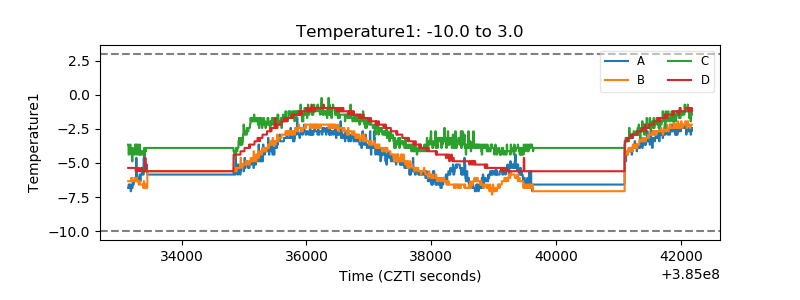 |
| Veto HV Monitor | 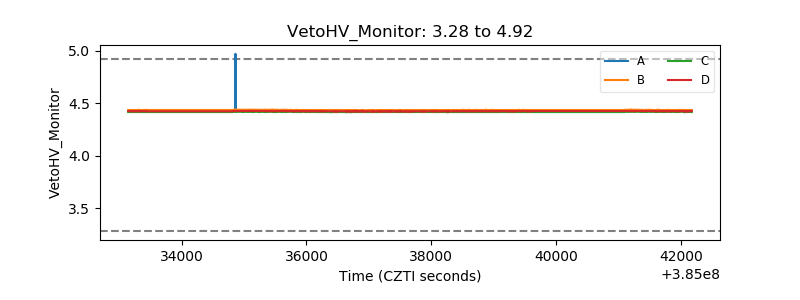 |
| Veto LLD | 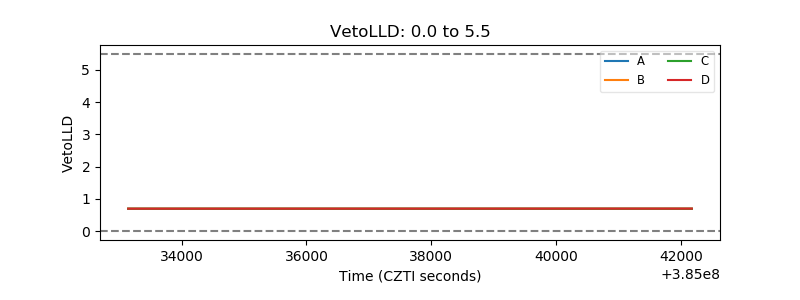 |
| Alpha Counter | 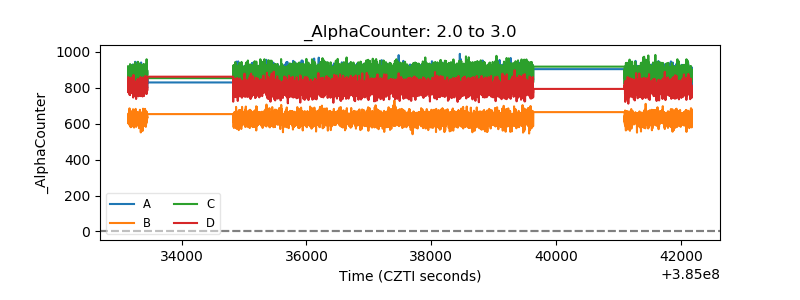 |
| _CPM_Rate | 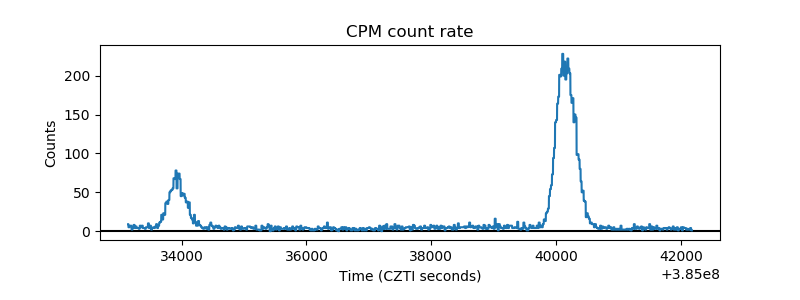 |
| CZT Counter | 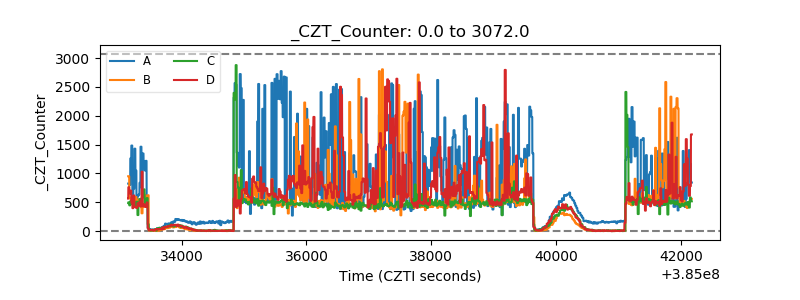 |
| +2.5 Volts monitor | 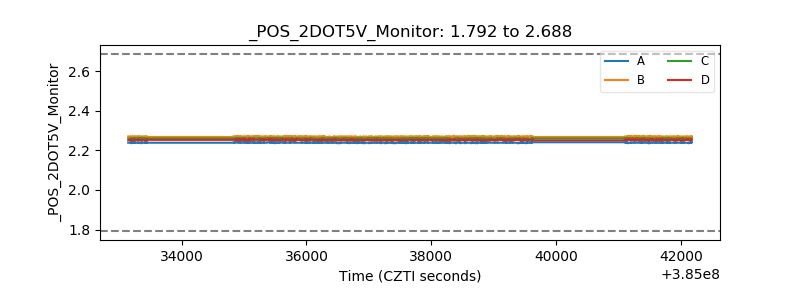 |
| +5 Volts monitor | 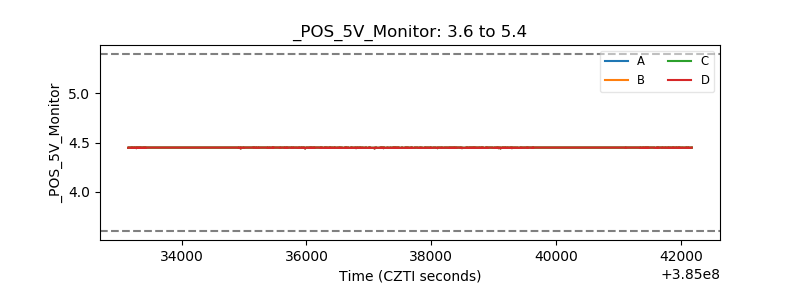 |
| _ROLL_ROT | 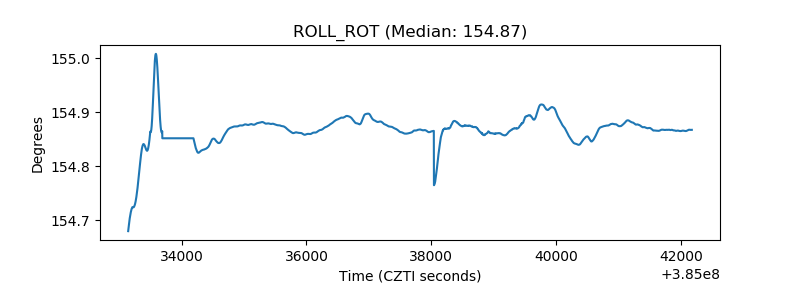 |
| _Roll_DEC | 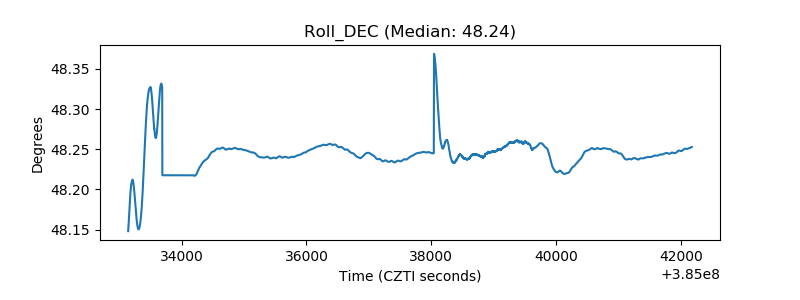 |
| _Roll_RA | 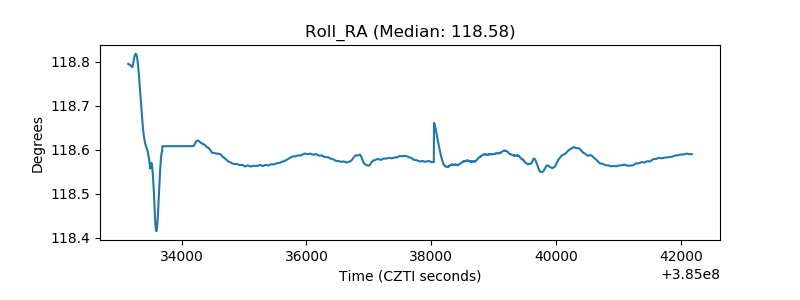 |
| Veto Counter | 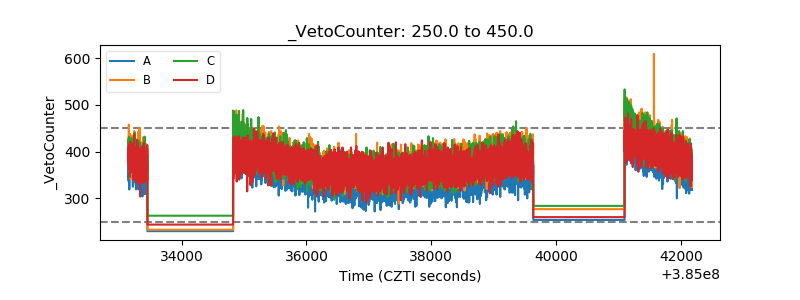 |