| Param | Original file | Final file |
|---|---|---|
| Filename | modeM0/AS1A11_065T12_9000005004_34933cztM0_level2.evt | modeM0/AS1A11_065T12_9000005004_34933cztM0_level2_quad_clean.evt |
| Size (bytes) | 563,008,320 | 65,600,640 |
| Size | 536.9 MB | 62.6 MB |
| Events in quadrant A | 4,809,292 | 400,002 |
| Events in quadrant B | 3,641,760 | 405,104 |
| Events in quadrant C | 3,516,001 | 396,733 |
| Events in quadrant D | 4,671,896 | 359,573 |
| Mode M9 | |||
|---|---|---|---|
| Quadrant | BADHDUFLAG | Total packets | Discarded packets |
| A | 0 | 32 | 0 |
| B | 0 | 32 | 0 |
| C | 0 | 32 | 0 |
| D | 0 | 32 | 0 |
| Mode SS | |||
|---|---|---|---|
| Quadrant | BADHDUFLAG | Total packets | Discarded packets |
| A | 0 | 126 | 0 |
| B | 0 | 126 | 0 |
| C | 0 | 126 | 0 |
| D | 0 | 126 | 0 |
| Mode M0 | |||
|---|---|---|---|
| Quadrant | BADHDUFLAG | Total packets | Discarded packets |
| A | 0 | 18417 | 3 |
| B | 0 | 14786 | 2 |
| C | 0 | 14045 | 2 |
| D | 0 | 18001 | 2 |
| Quadrant | Total seconds | Saturated seconds | Saturation percentage |
|---|---|---|---|
| A | 6081 | 348 | 5.722743% |
| B | 6081 | 108 | 1.776024% |
| C | 6081 | 157 | 2.581812% |
| D | 6081 | 343 | 5.640520% |
Noise dominated data is calculated using 1-second bins in cleaned event files. If a bin has >2000 counts, and if more than 50% of those come from <1% of pixels, then it is considered to be noise-dominated and hence unusable.
| Quadrant | # 1 sec bins | Bins with >0 counts | Bins with >2000 counts | High rate bins dominated by noise | Noise dominated (total time) | Noise dominated (detector-on time) | Marked lightcurve |
|---|---|---|---|---|---|---|---|
| A | 9335 | 6082 | 305 | 305 | 3.27% | 5.01% | 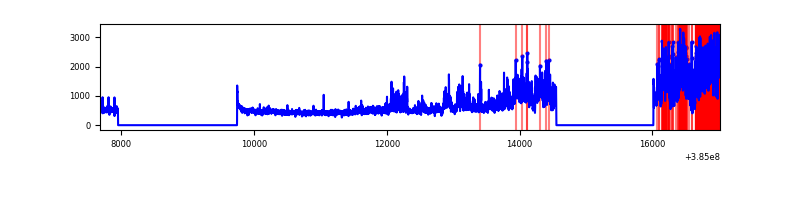 |
| B | 9336 | 6083 | 66 | 66 | 0.71% | 1.08% | 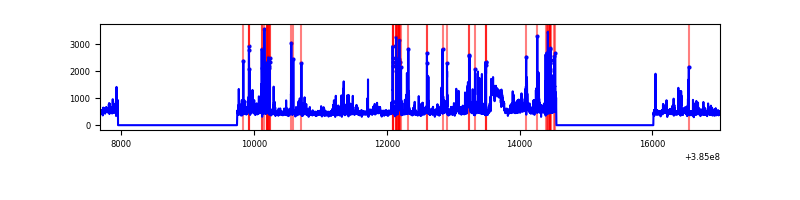 |
| C | 9336 | 6083 | 146 | 146 | 1.56% | 2.40% |  |
| D | 9336 | 6082 | 318 | 318 | 3.41% | 5.23% | 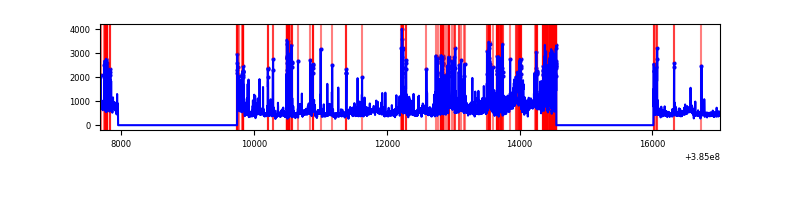 |
Top three noisy pixels from each quadrant. If the there are fewer than three noisy pixels in the level2.evt file, extra rows are filled as -1
| Pixel properties | Quadrant properties | ||||||
|---|---|---|---|---|---|---|---|
| Quadrant | DetID | PixID | Counts | Sigma | Mean | Median | Sigma |
| A | 15 | 169 | 2051726 | 14712.12 | 688 | 673 | 139.4 |
| A | 10 | 83 | 70799 | 503.01 | 688 | 673 | 139.4 |
| A | 13 | 6 | 13103 | 89.16 | 688 | 673 | 139.4 |
| B | 5 | 172 | 592894 | 4430.78 | 691 | 674 | 133.7 |
| B | 0 | 190 | 158956 | 1184.21 | 691 | 674 | 133.7 |
| B | 4 | 232 | 58081 | 429.5 | 691 | 674 | 133.7 |
| C | 0 | 10 | 285708 | 1818.84 | 674 | 679 | 156.7 |
| C | 15 | 214 | 254739 | 1621.22 | 674 | 679 | 156.7 |
| C | 4 | 254 | 246001 | 1565.46 | 674 | 679 | 156.7 |
| D | 8 | 195 | 650288 | 3959.52 | 662 | 642 | 164.1 |
| D | 1 | 52 | 305305 | 1856.88 | 662 | 642 | 164.1 |
| D | 12 | 233 | 267971 | 1629.34 | 662 | 642 | 164.1 |
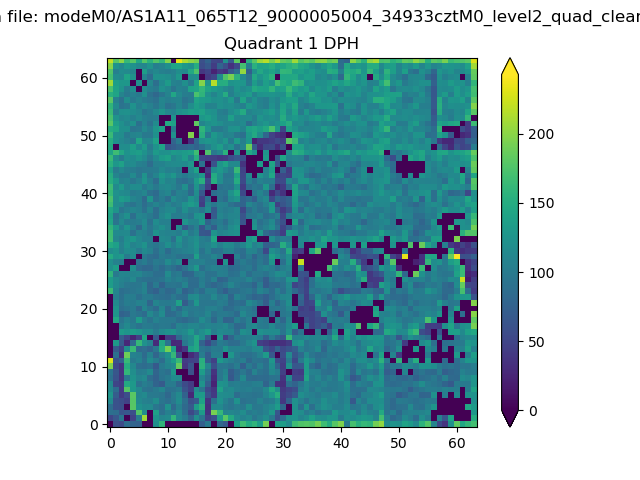
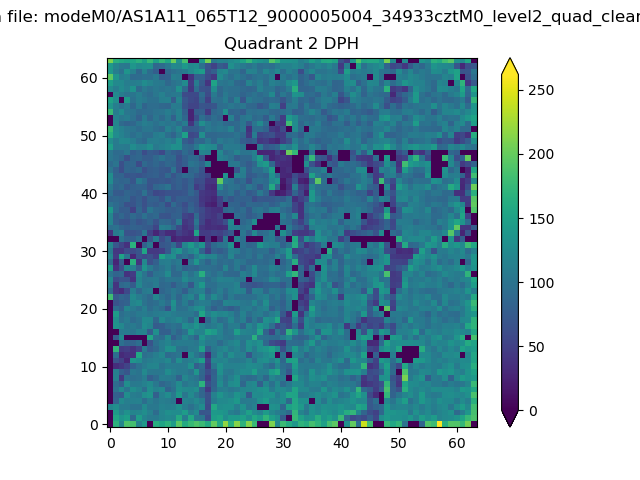
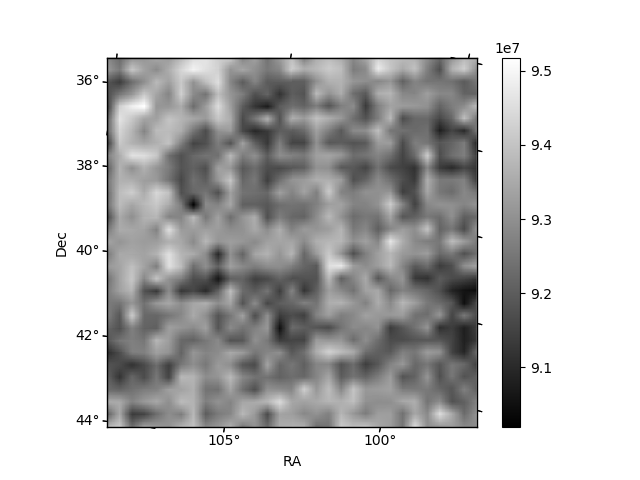
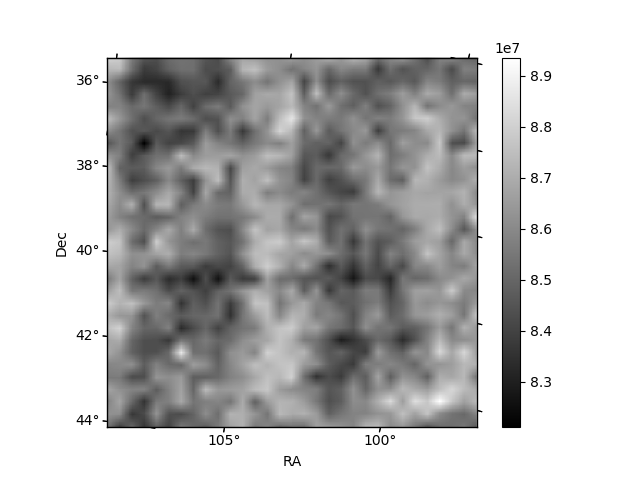
Histogram calculated using DETX and DETY for each event in the final _common_clean file
| Quadrant A | 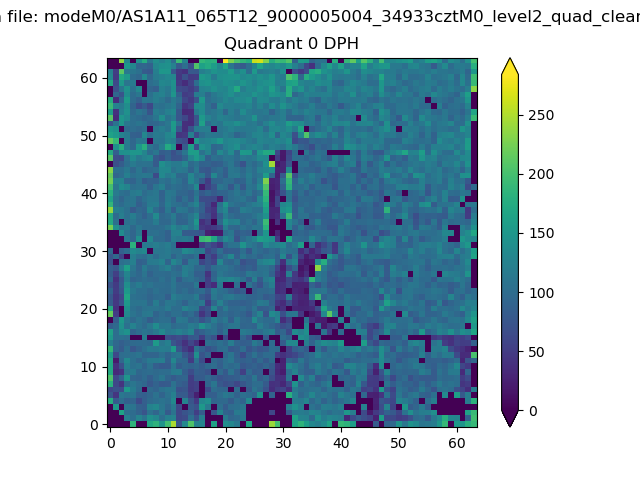 |
 |
Quadrant B |
|---|---|---|---|
| Quadrant D | 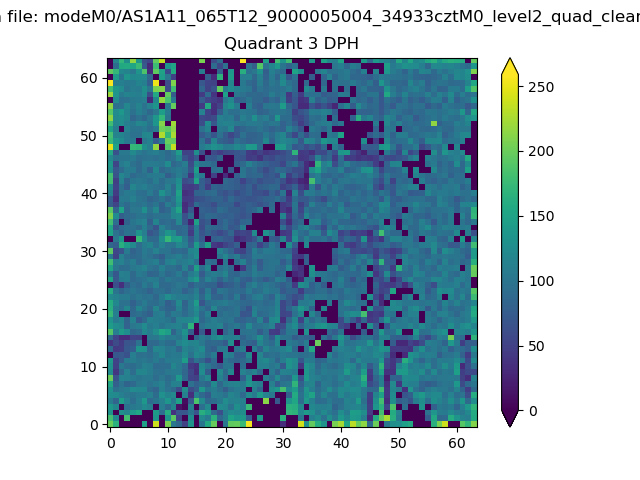 |
 |
Quadrant C |
| Plot type | Count rate plots | Images |
|---|---|---|
| Comparison with Poisson distribution Blue bars denote a histogram of data divided into 1 sec bins. Red curve is a Poisson curve with rate = median count rate of data. |
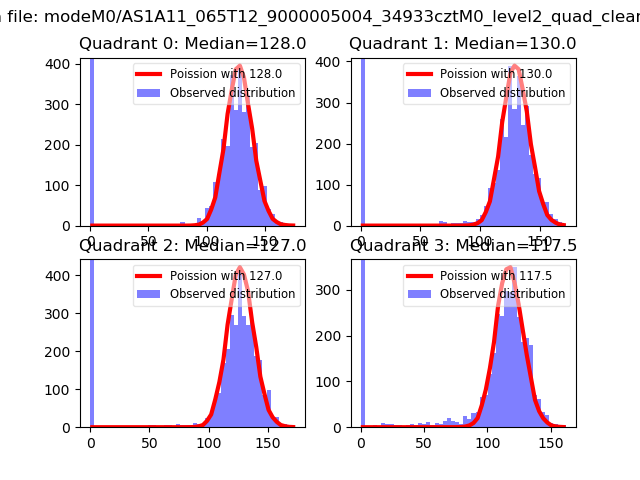 |
 |
| Quadrant-wise count rates Data is divided into 100 sec bins |
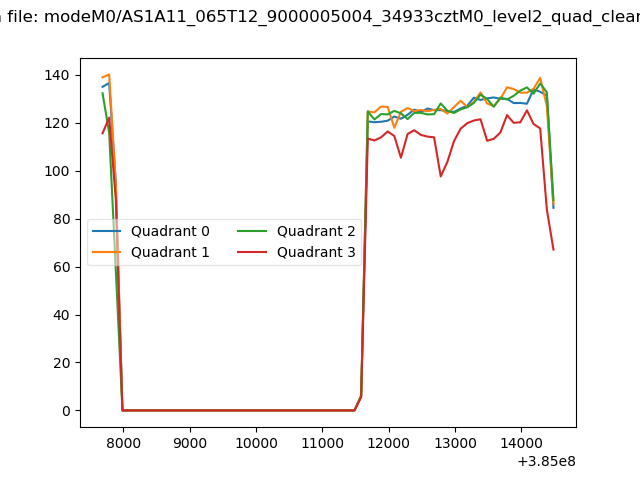 |
|
| Module-wise count rates for Quadrant A Data is divided into 100 sec bins |
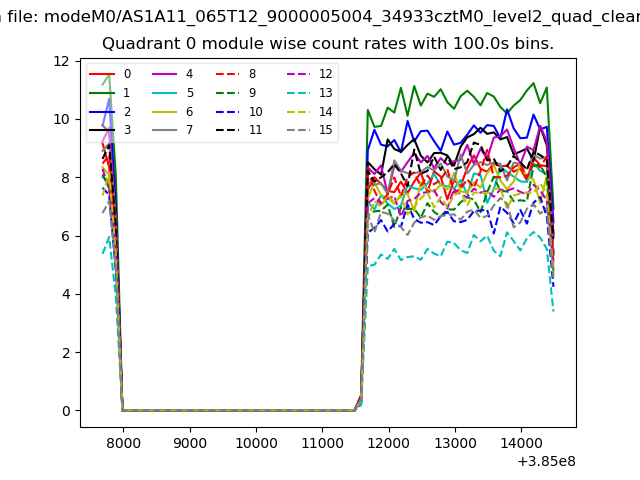 |
 |
| Module-wise count rates for Quadrant B Data is divided into 100 sec bins |
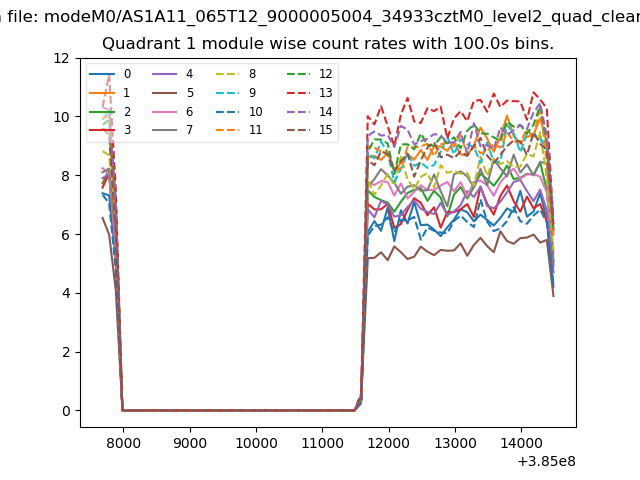 |
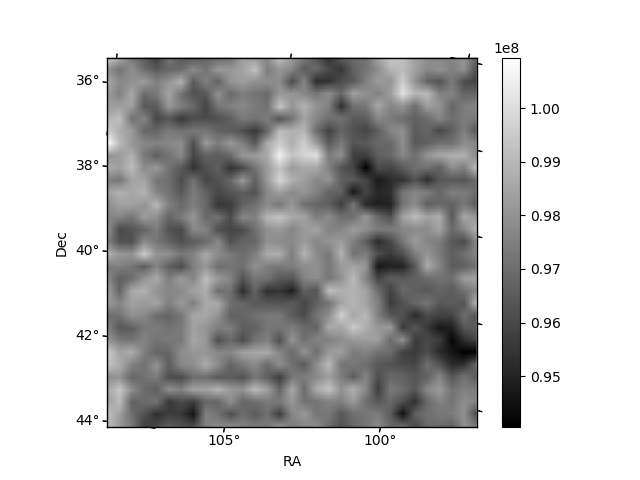 |
| Module-wise count rates for Quadrant C Data is divided into 100 sec bins |
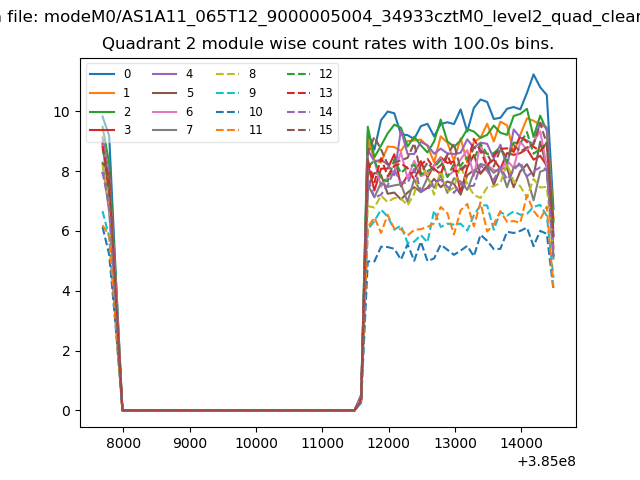 |
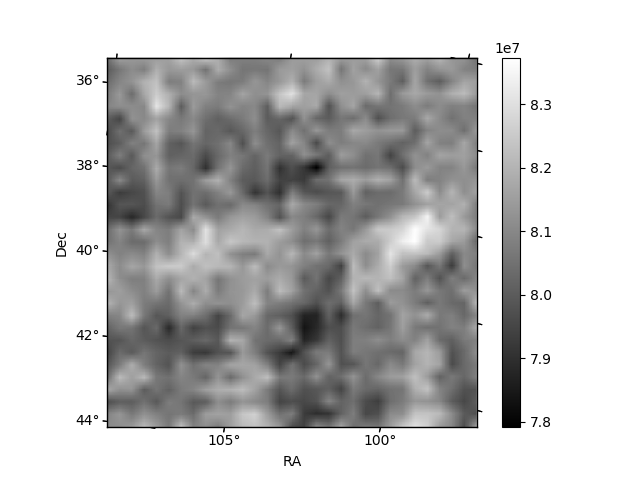 |
| Module-wise count rates for Quadrant D Data is divided into 100 sec bins |
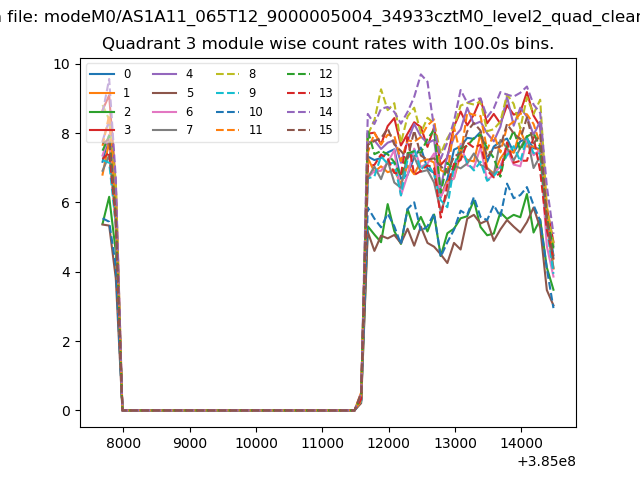 |
 |
| Parameter | Plot |
|---|---|
| CZT HV Monitor |  |
| D_VDD | 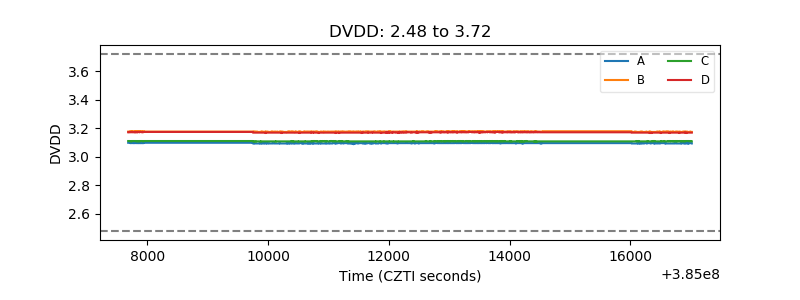 |
| Temperature 1 | 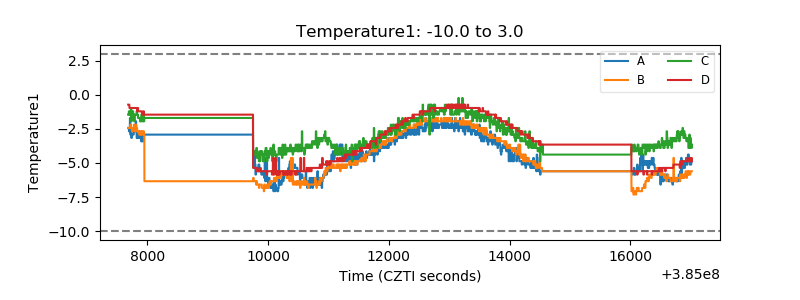 |
| Veto HV Monitor | 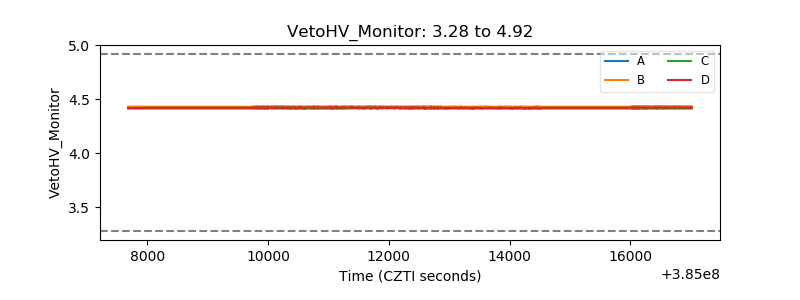 |
| Veto LLD | 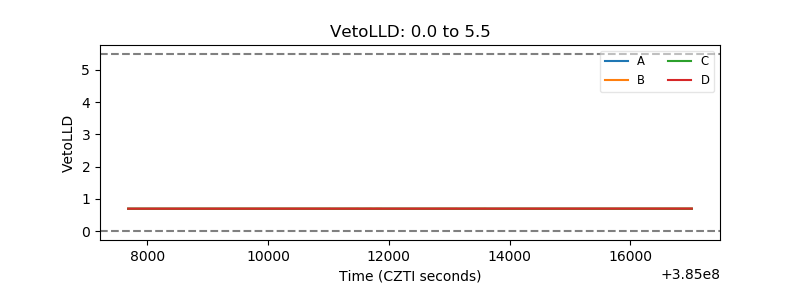 |
| Alpha Counter | 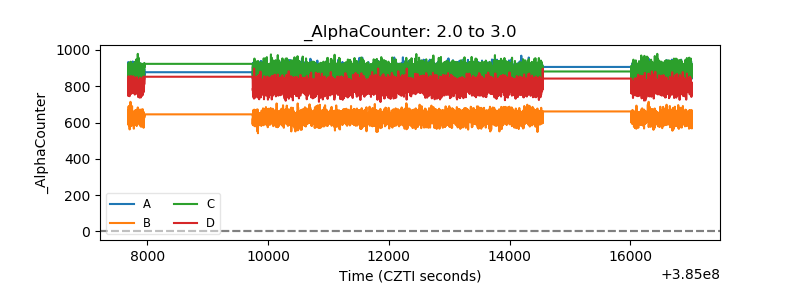 |
| _CPM_Rate | 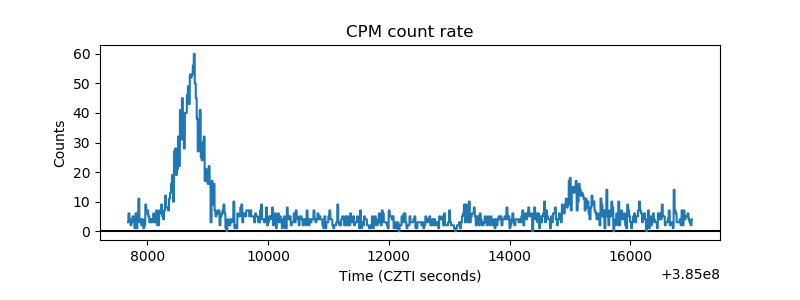 |
| CZT Counter | 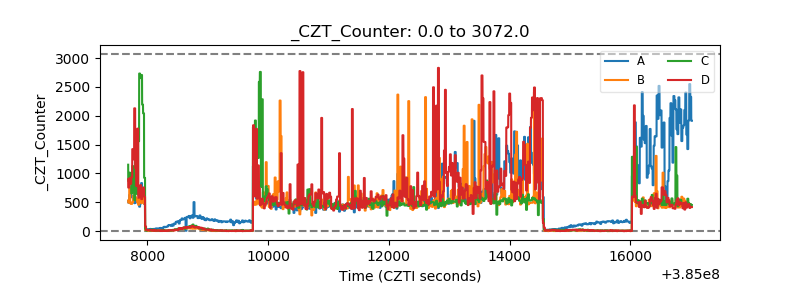 |
| +2.5 Volts monitor | 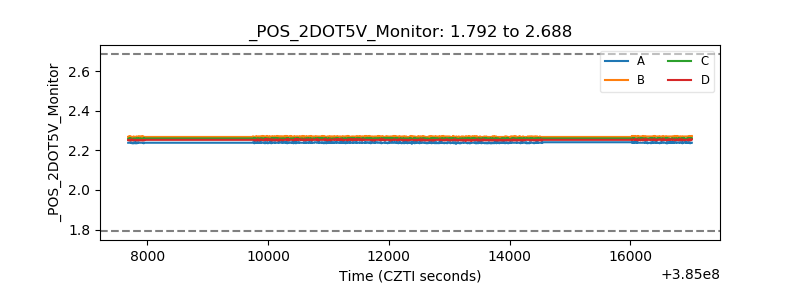 |
| +5 Volts monitor | 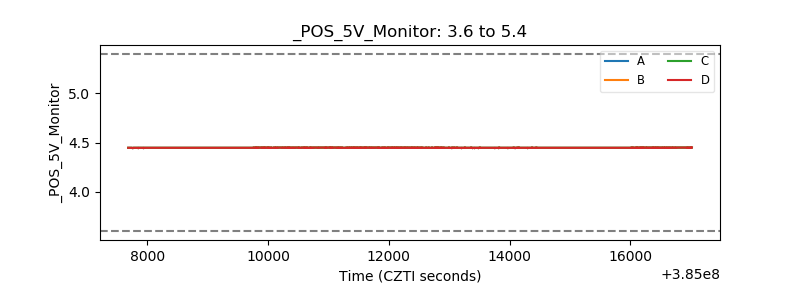 |
| _ROLL_ROT | 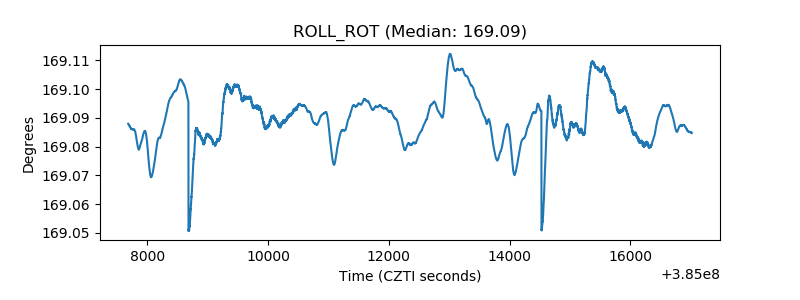 |
| _Roll_DEC | 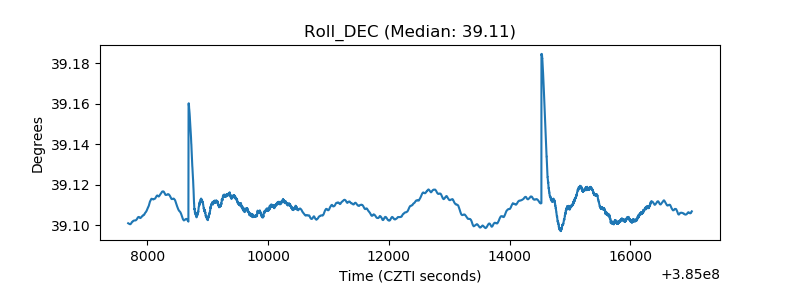 |
| _Roll_RA | 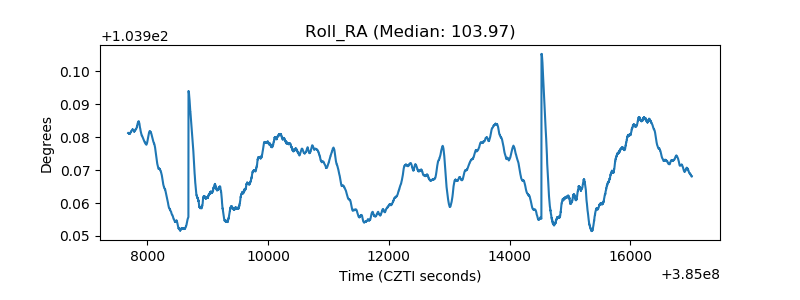 |
| Veto Counter | 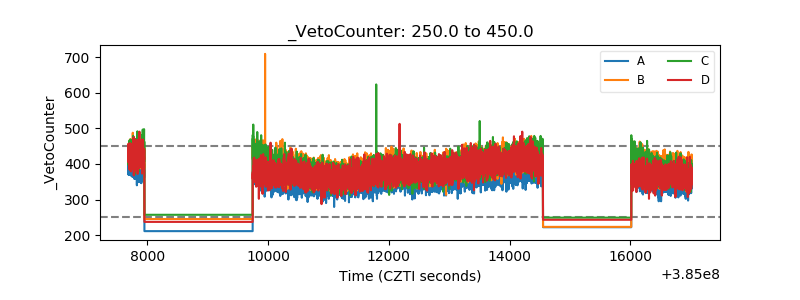 |