| Param | Original file | Final file |
|---|---|---|
| Filename | modeM0/AS1A11_065T12_9000005004_34931cztM0_level2.evt | modeM0/AS1A11_065T12_9000005004_34931cztM0_level2_quad_clean.evt |
| Size (bytes) | 482,647,680 | 53,435,520 |
| Size | 460.3 MB | 51.0 MB |
| Events in quadrant A | 4,732,934 | 314,921 |
| Events in quadrant B | 2,900,060 | 327,857 |
| Events in quadrant C | 2,826,397 | 323,168 |
| Events in quadrant D | 3,817,776 | 299,731 |
| Mode M9 | |||
|---|---|---|---|
| Quadrant | BADHDUFLAG | Total packets | Discarded packets |
| A | 0 | 35 | 0 |
| B | 0 | 35 | 0 |
| C | 0 | 35 | 0 |
| D | 0 | 36 | 0 |
| Mode SS | |||
|---|---|---|---|
| Quadrant | BADHDUFLAG | Total packets | Discarded packets |
| A | 0 | 102 | 0 |
| B | 0 | 102 | 0 |
| C | 0 | 102 | 0 |
| D | 0 | 102 | 0 |
| Mode M0 | |||
|---|---|---|---|
| Quadrant | BADHDUFLAG | Total packets | Discarded packets |
| A | 0 | 17542 | 3 |
| B | 0 | 11886 | 2 |
| C | 0 | 11311 | 2 |
| D | 0 | 14824 | 2 |
| Quadrant | Total seconds | Saturated seconds | Saturation percentage |
|---|---|---|---|
| A | 5021 | 165 | 3.286198% |
| B | 5021 | 128 | 2.549293% |
| C | 5021 | 79 | 1.573392% |
| D | 5021 | 151 | 3.007369% |
Noise dominated data is calculated using 1-second bins in cleaned event files. If a bin has >2000 counts, and if more than 50% of those come from <1% of pixels, then it is considered to be noise-dominated and hence unusable.
| Quadrant | # 1 sec bins | Bins with >0 counts | Bins with >2000 counts | High rate bins dominated by noise | Noise dominated (total time) | Noise dominated (detector-on time) | Marked lightcurve |
|---|---|---|---|---|---|---|---|
| A | 7084 | 5022 | 121 | 121 | 1.71% | 2.41% | 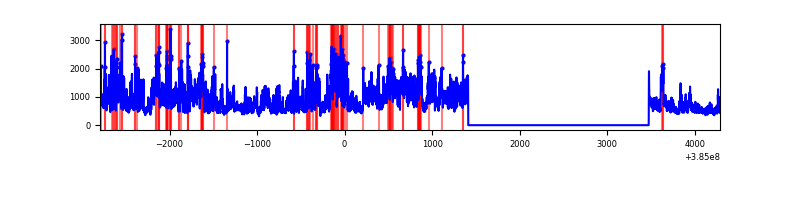 |
| B | 7084 | 5022 | 91 | 91 | 1.28% | 1.81% | 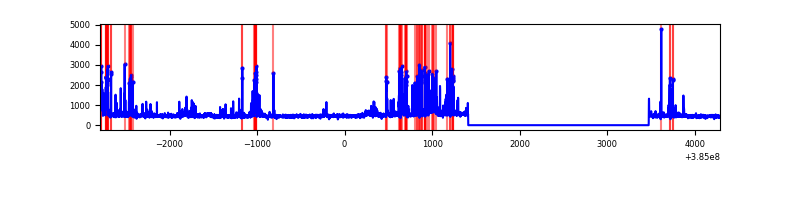 |
| C | 7084 | 5022 | 68 | 68 | 0.96% | 1.35% | 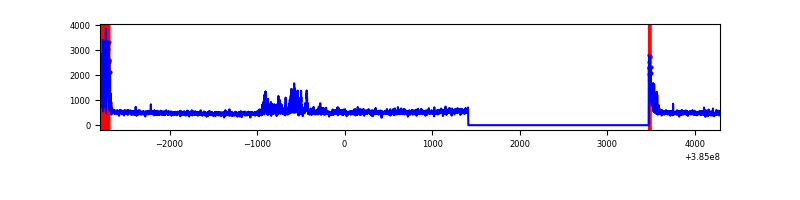 |
| D | 7084 | 5022 | 161 | 161 | 2.27% | 3.21% | 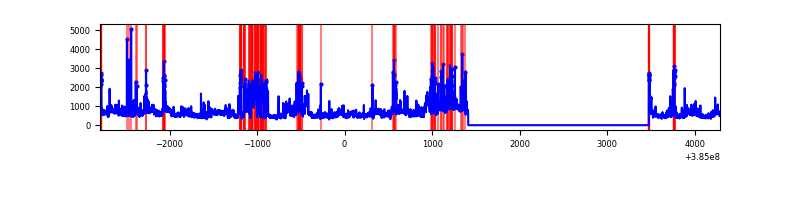 |
Top three noisy pixels from each quadrant. If the there are fewer than three noisy pixels in the level2.evt file, extra rows are filled as -1
| Pixel properties | Quadrant properties | ||||||
|---|---|---|---|---|---|---|---|
| Quadrant | DetID | PixID | Counts | Sigma | Mean | Median | Sigma |
| A | 15 | 169 | 2437891 | 21154.28 | 571 | 560 | 115.2 |
| A | 10 | 83 | 62427 | 536.96 | 571 | 560 | 115.2 |
| A | 7 | 16 | 12379 | 102.58 | 571 | 560 | 115.2 |
| B | 5 | 172 | 381584 | 3507.8 | 573 | 558 | 108.6 |
| B | 0 | 190 | 69103 | 631.04 | 573 | 558 | 108.6 |
| B | 5 | 255 | 62211 | 567.59 | 573 | 558 | 108.6 |
| C | 0 | 10 | 334376 | 2516.61 | 566 | 569 | 132.6 |
| C | 15 | 214 | 210160 | 1580.13 | 566 | 569 | 132.6 |
| C | 8 | 111 | 62679 | 468.25 | 566 | 569 | 132.6 |
| D | 8 | 195 | 863868 | 6391.47 | 553 | 538 | 135.1 |
| D | 2 | 31 | 163718 | 1208.06 | 553 | 538 | 135.1 |
| D | 13 | 249 | 162971 | 1202.53 | 553 | 538 | 135.1 |
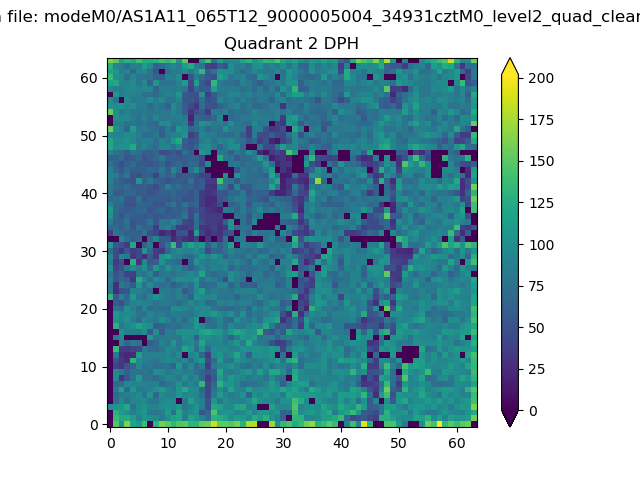
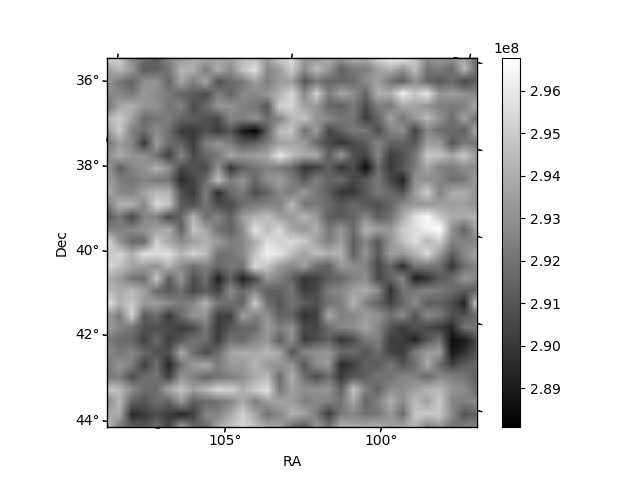
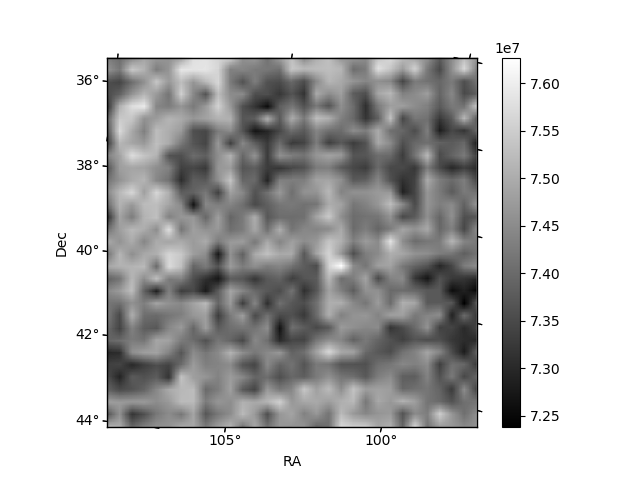
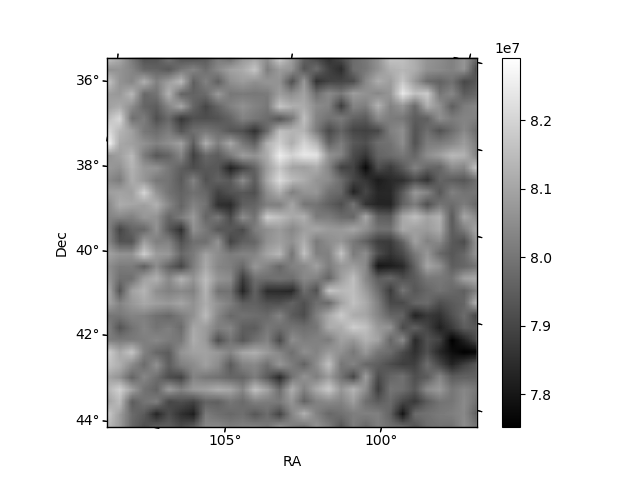
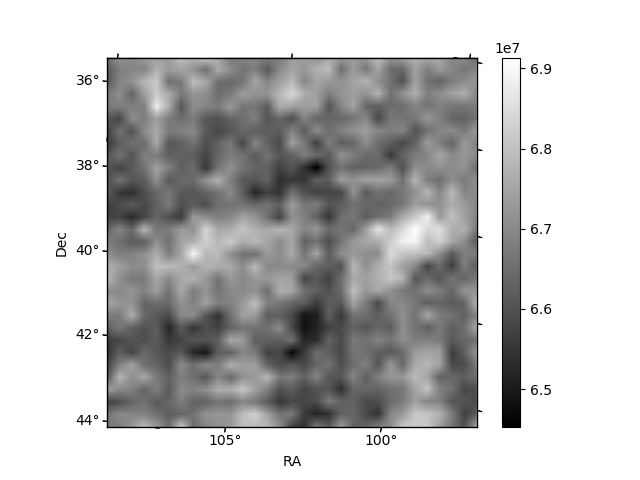
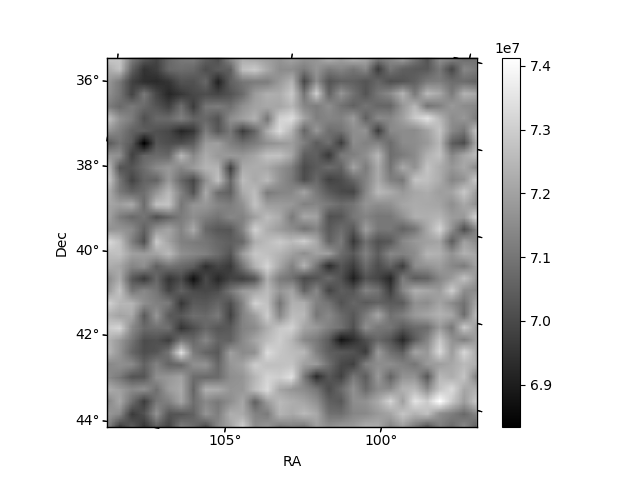
Histogram calculated using DETX and DETY for each event in the final _common_clean file
| Quadrant A | 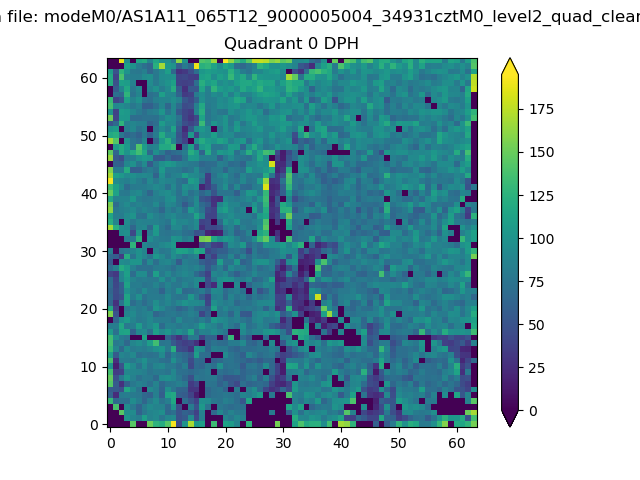 |
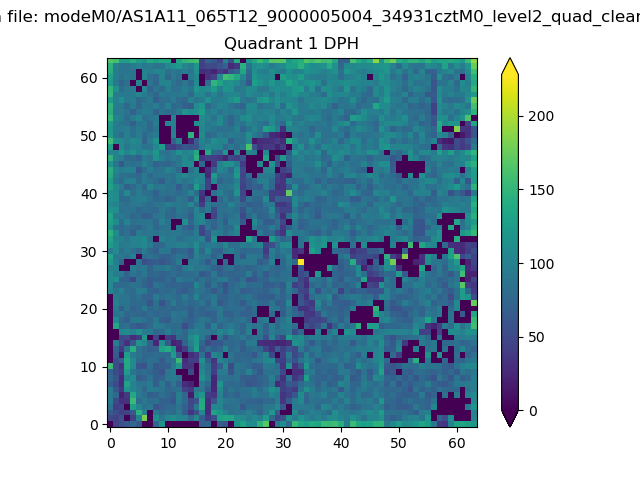 |
Quadrant B |
|---|---|---|---|
| Quadrant D | 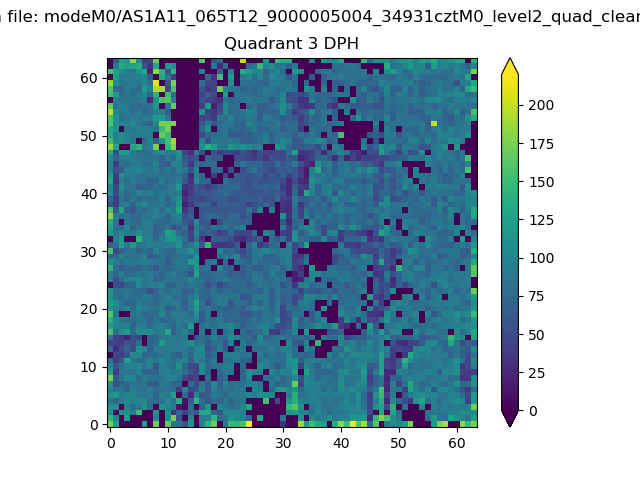 |
 |
Quadrant C |
| Plot type | Count rate plots | Images |
|---|---|---|
| Comparison with Poisson distribution Blue bars denote a histogram of data divided into 1 sec bins. Red curve is a Poisson curve with rate = median count rate of data. |
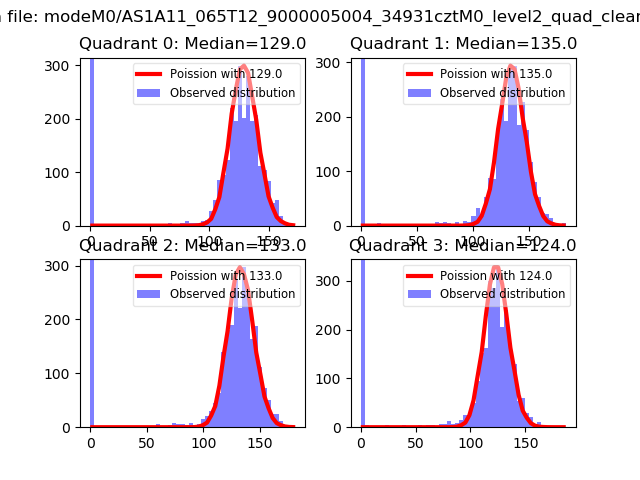 |
 |
| Quadrant-wise count rates Data is divided into 100 sec bins |
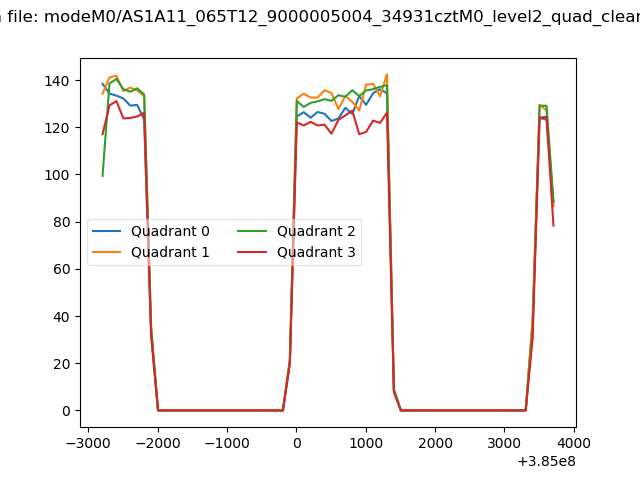 |
|
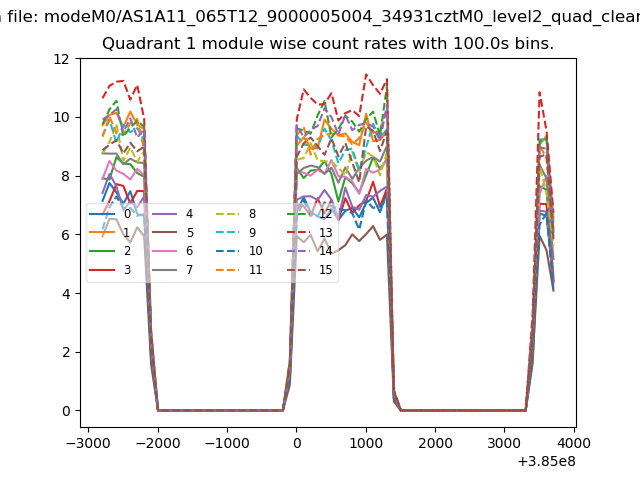
| Module-wise count rates for Quadrant A Data is divided into 100 sec bins |
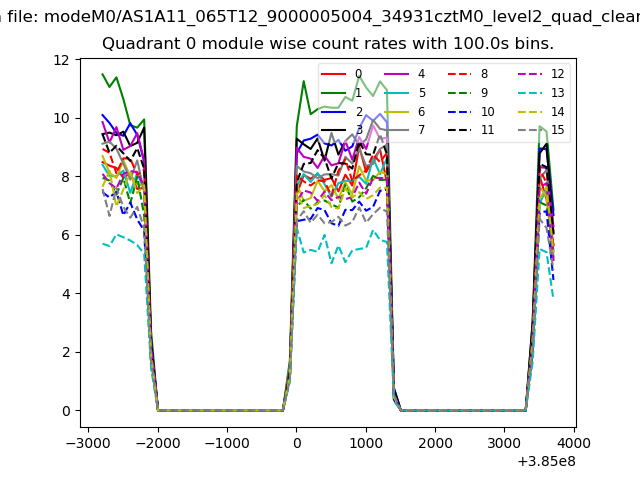 |
 |
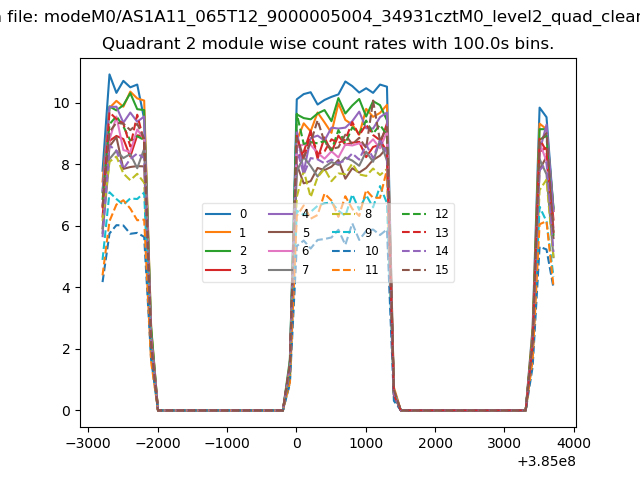
| Module-wise count rates for Quadrant B Data is divided into 100 sec bins |
 |
 |
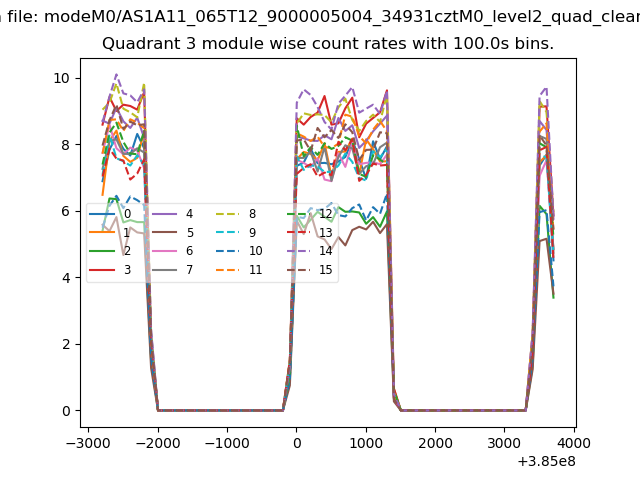
| Module-wise count rates for Quadrant C Data is divided into 100 sec bins |
 |
 |
| Module-wise count rates for Quadrant D Data is divided into 100 sec bins |
 |
 |
| Parameter | Plot |
|---|---|
| CZT HV Monitor | 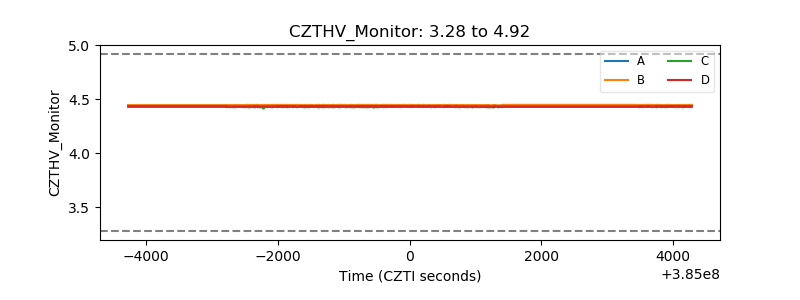 |
| D_VDD | 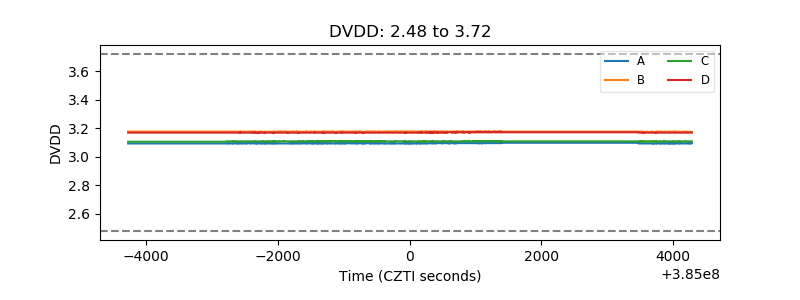 |
| Temperature 1 | 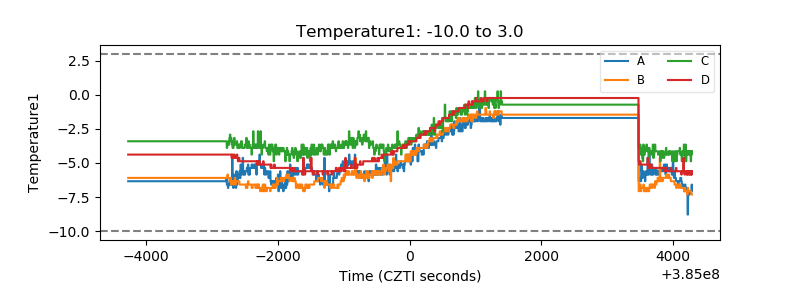 |
| Veto HV Monitor | 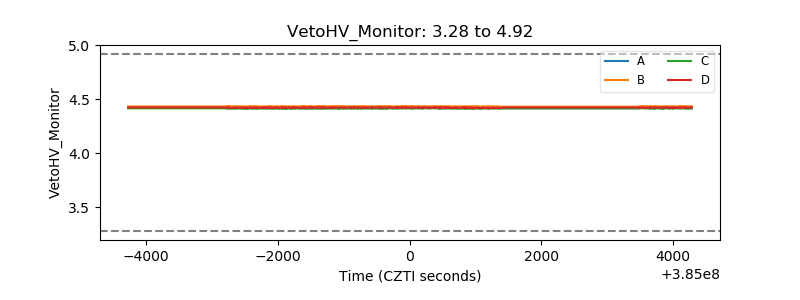 |
| Veto LLD | 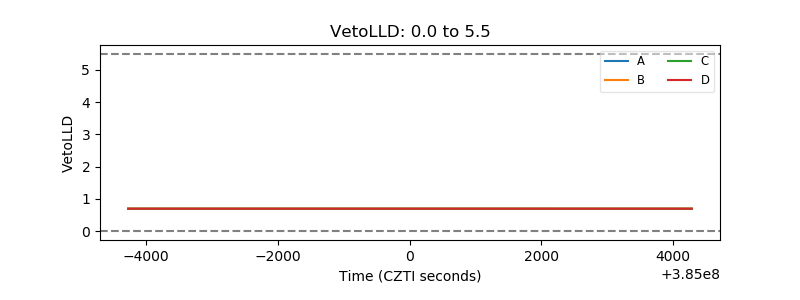 |
| Alpha Counter | 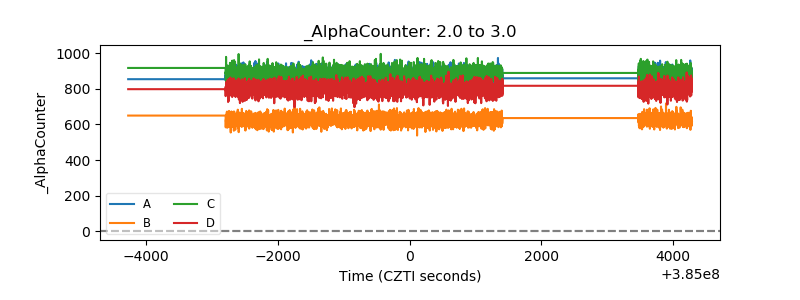 |
| _CPM_Rate | 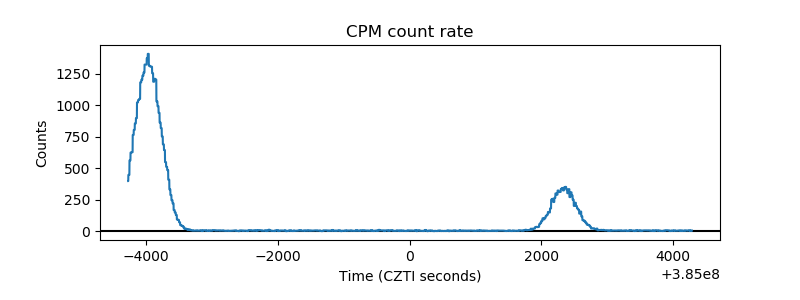 |
| CZT Counter | 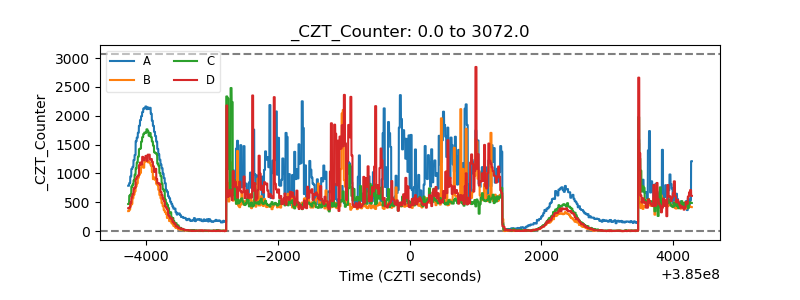 |
| +2.5 Volts monitor | 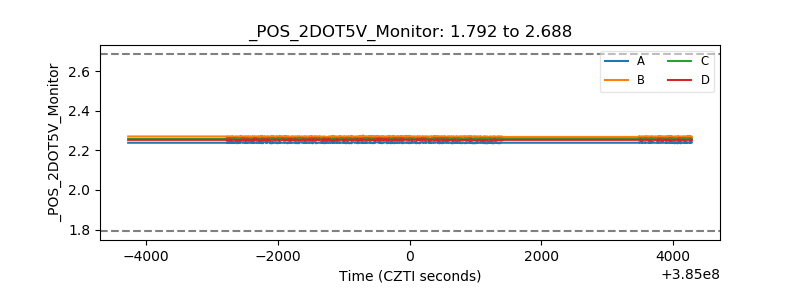 |
| +5 Volts monitor | 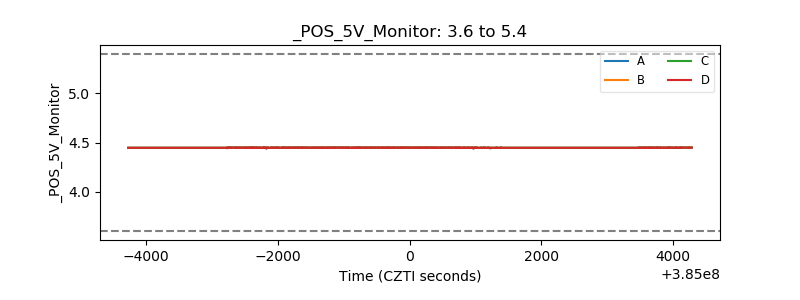 |
| _ROLL_ROT | 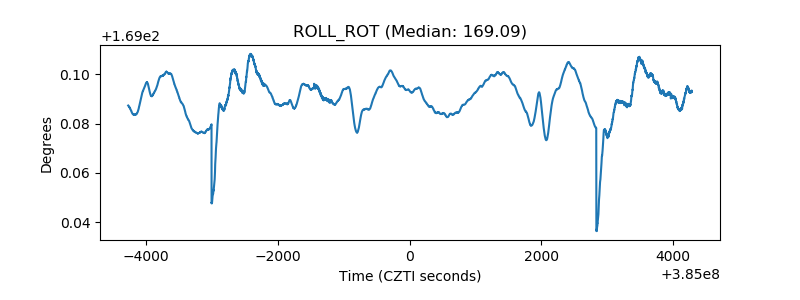 |
| _Roll_DEC | 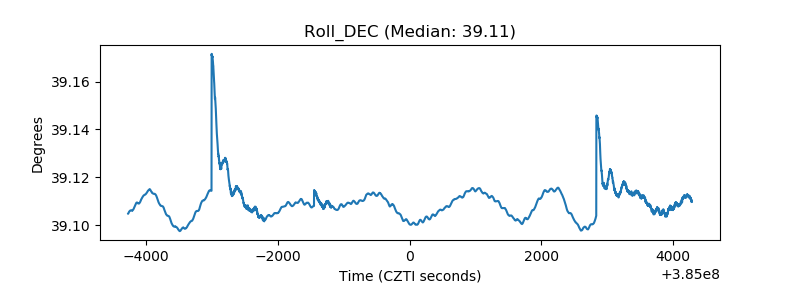 |
| _Roll_RA | 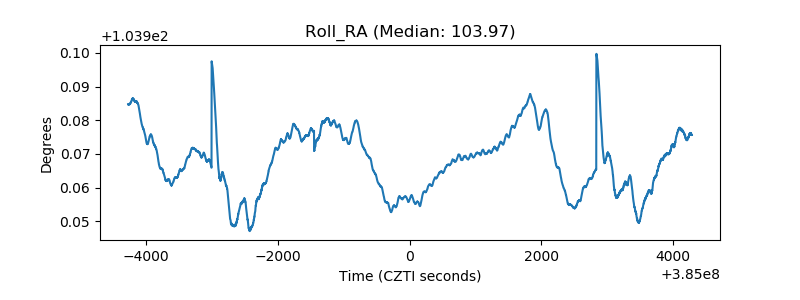 |
| Veto Counter | 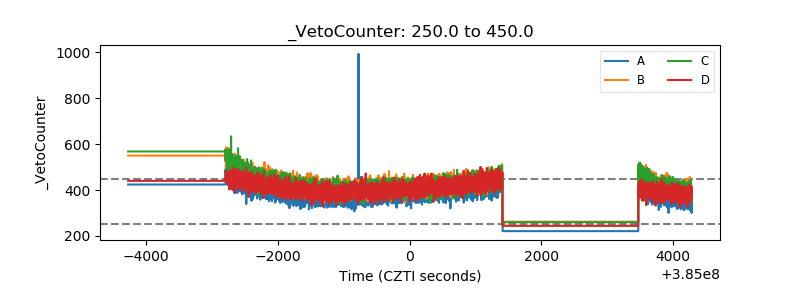 |