| Param | Original file | Final file |
|---|---|---|
| Filename | modeM0/AS1A11_065T12_9000005004_34930cztM0_level2.evt | modeM0/AS1A11_065T12_9000005004_34930cztM0_level2_quad_clean.evt |
| Size (bytes) | 573,768,000 | 58,901,760 |
| Size | 547.2 MB | 56.2 MB |
| Events in quadrant A | 7,097,422 | 322,803 |
| Events in quadrant B | 3,322,491 | 378,001 |
| Events in quadrant C | 2,759,716 | 383,960 |
| Events in quadrant D | 3,865,271 | 353,743 |
| Mode M9 | |||
|---|---|---|---|
| Quadrant | BADHDUFLAG | Total packets | Discarded packets |
| A | 0 | 27 | 0 |
| B | 0 | 27 | 0 |
| C | 0 | 27 | 0 |
| D | 0 | 28 | 0 |
| Mode SS | |||
|---|---|---|---|
| Quadrant | BADHDUFLAG | Total packets | Discarded packets |
| A | 0 | 100 | 0 |
| B | 0 | 100 | 0 |
| C | 0 | 100 | 0 |
| D | 0 | 100 | 0 |
| Mode M0 | |||
|---|---|---|---|
| Quadrant | BADHDUFLAG | Total packets | Discarded packets |
| A | 0 | 24566 | 3 |
| B | 0 | 13036 | 2 |
| C | 0 | 10946 | 2 |
| D | 0 | 14938 | 2 |
| Quadrant | Total seconds | Saturated seconds | Saturation percentage |
|---|---|---|---|
| A | 4909 | 1261 | 25.687513% |
| B | 4909 | 292 | 5.948258% |
| C | 4909 | 125 | 2.546343% |
| D | 4909 | 181 | 3.687105% |
Noise dominated data is calculated using 1-second bins in cleaned event files. If a bin has >2000 counts, and if more than 50% of those come from <1% of pixels, then it is considered to be noise-dominated and hence unusable.
| Quadrant | # 1 sec bins | Bins with >0 counts | Bins with >2000 counts | High rate bins dominated by noise | Noise dominated (total time) | Noise dominated (detector-on time) | Marked lightcurve |
|---|---|---|---|---|---|---|---|
| A | 7062 | 4910 | 1207 | 1207 | 17.09% | 24.58% | 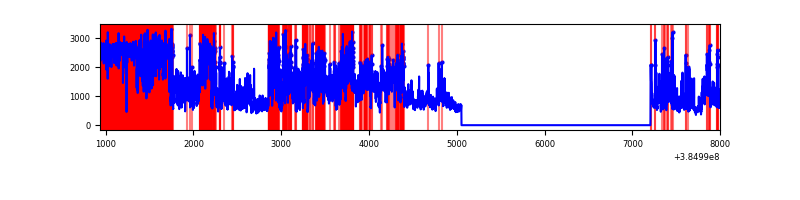 |
| B | 7062 | 4910 | 250 | 250 | 3.54% | 5.09% | 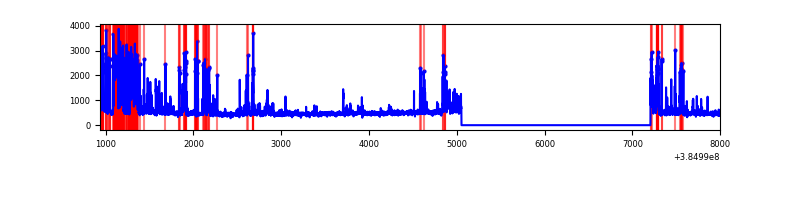 |
| C | 7062 | 4910 | 103 | 103 | 1.46% | 2.10% | 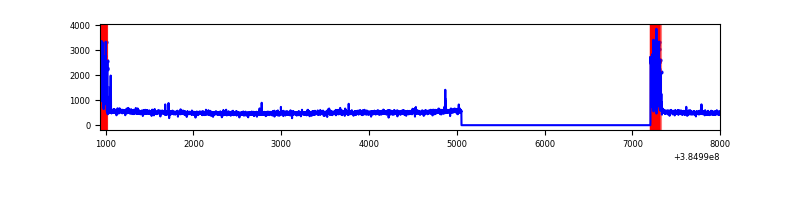 |
| D | 7062 | 4910 | 197 | 197 | 2.79% | 4.01% | 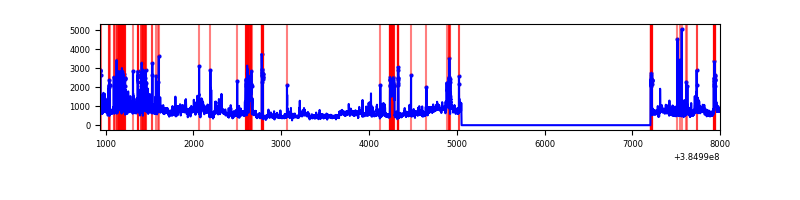 |
Top three noisy pixels from each quadrant. If the there are fewer than three noisy pixels in the level2.evt file, extra rows are filled as -1
| Pixel properties | Quadrant properties | ||||||
|---|---|---|---|---|---|---|---|
| Quadrant | DetID | PixID | Counts | Sigma | Mean | Median | Sigma |
| A | 15 | 169 | 5009984 | 47684.21 | 522 | 512 | 105.1 |
| A | 10 | 83 | 49298 | 464.38 | 522 | 512 | 105.1 |
| A | 7 | 16 | 8487 | 75.91 | 522 | 512 | 105.1 |
| B | 5 | 172 | 830438 | 7771.88 | 565 | 552 | 106.8 |
| B | 5 | 255 | 136934 | 1277.22 | 565 | 552 | 106.8 |
| B | 4 | 232 | 58788 | 545.38 | 565 | 552 | 106.8 |
| C | 0 | 10 | 339715 | 2567.04 | 566 | 570 | 132.1 |
| C | 15 | 214 | 204945 | 1546.95 | 566 | 570 | 132.1 |
| C | 14 | 67 | 6271 | 43.15 | 566 | 570 | 132.1 |
| D | 8 | 195 | 742305 | 5508.38 | 552 | 537 | 134.7 |
| D | 2 | 31 | 221668 | 1642.12 | 552 | 537 | 134.7 |
| D | 13 | 249 | 188550 | 1396.19 | 552 | 537 | 134.7 |
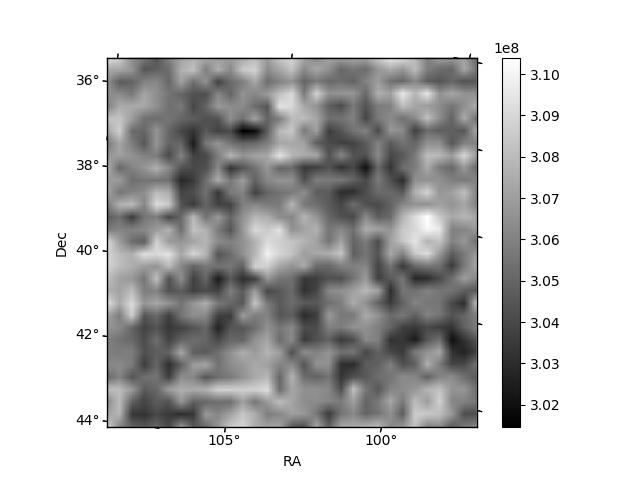
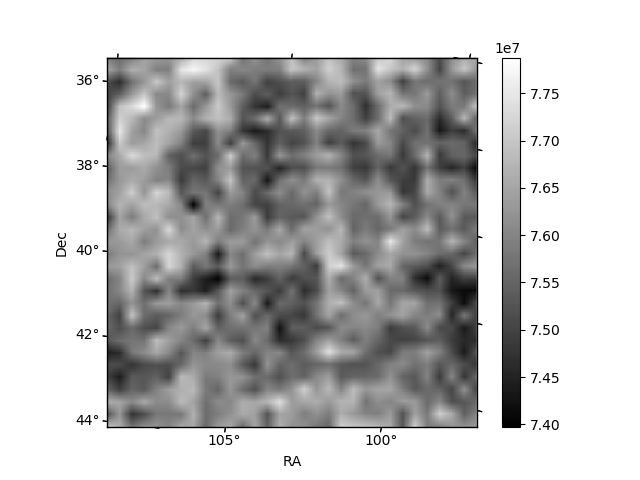
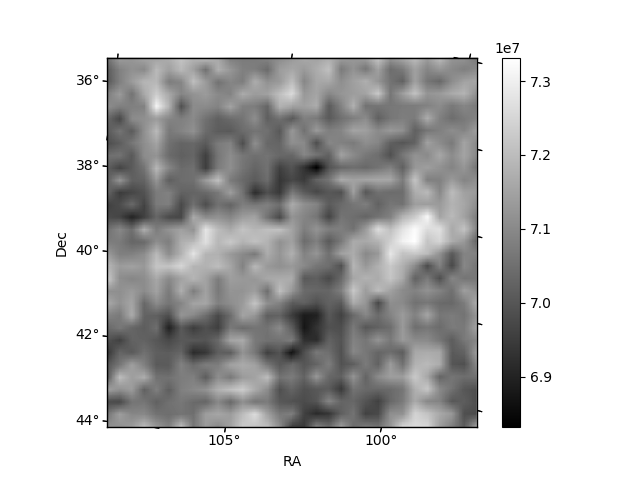
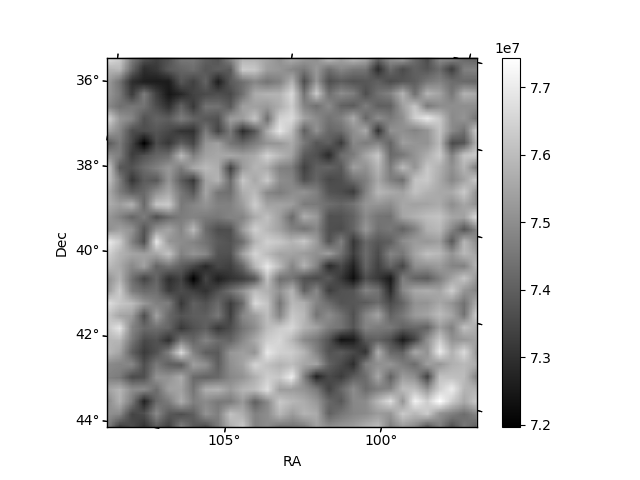
Histogram calculated using DETX and DETY for each event in the final _common_clean file
| Quadrant A | 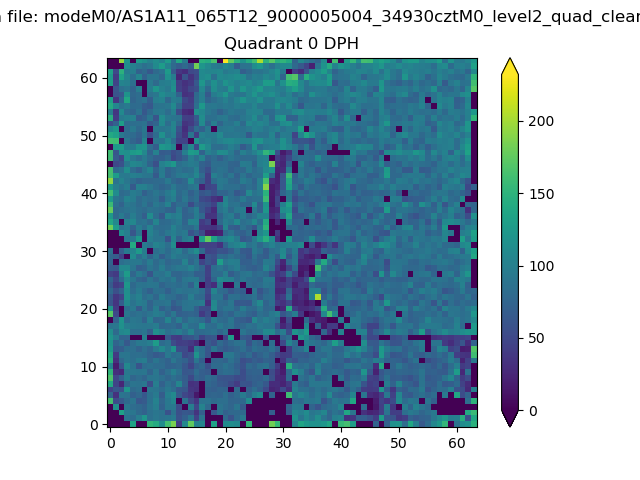 |
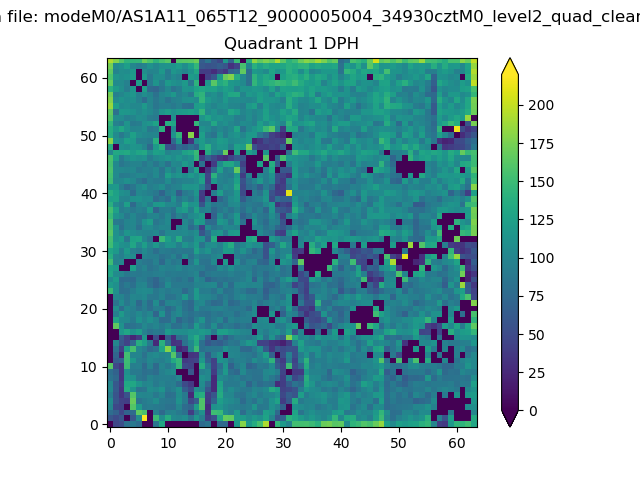 |
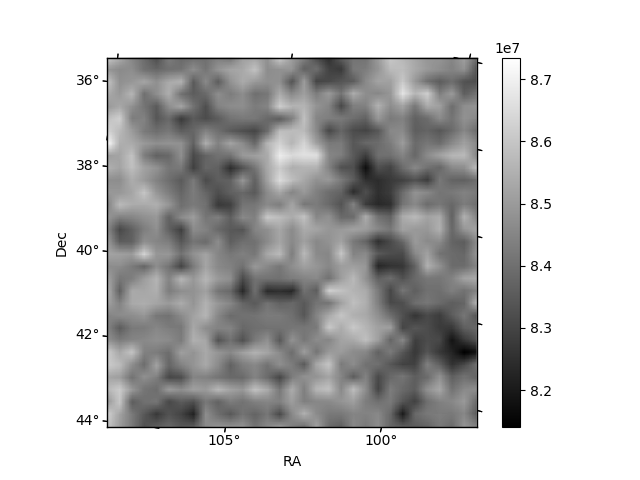
Quadrant B |
|---|---|---|---|
| Quadrant D | 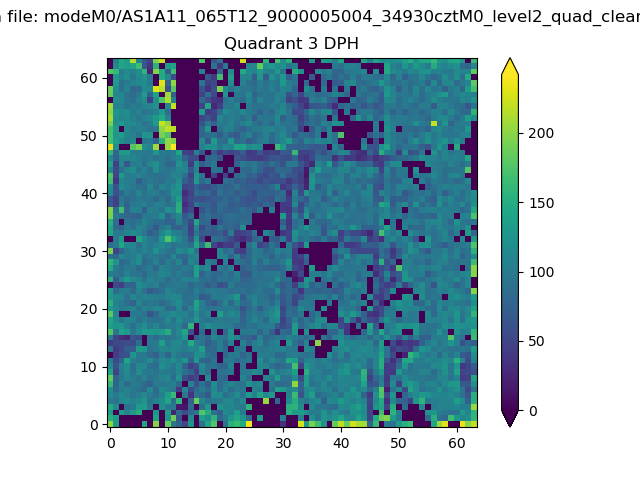 |
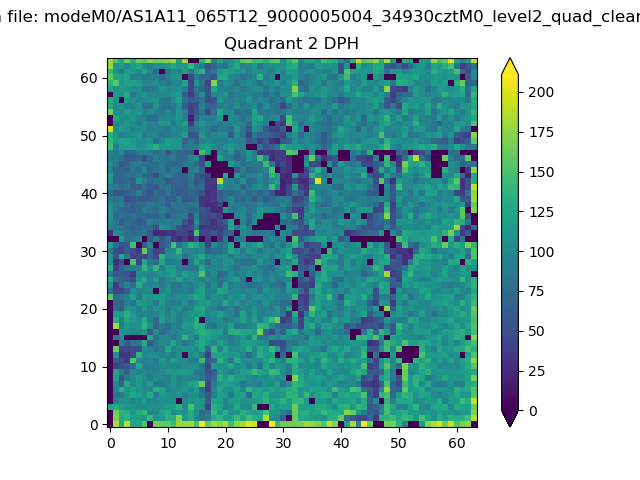 |
Quadrant C |
| Plot type | Count rate plots | Images |
|---|---|---|
| Comparison with Poisson distribution Blue bars denote a histogram of data divided into 1 sec bins. Red curve is a Poisson curve with rate = median count rate of data. |
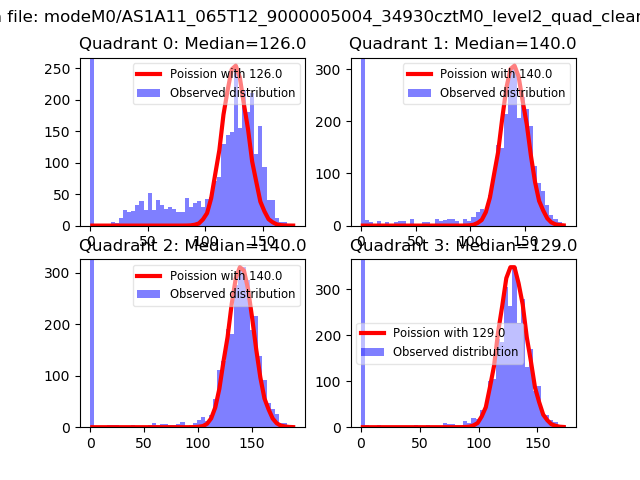 |
 |
| Quadrant-wise count rates Data is divided into 100 sec bins |
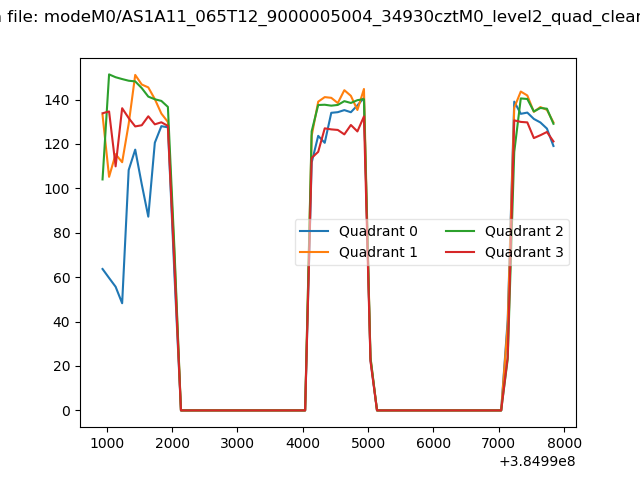 |
|
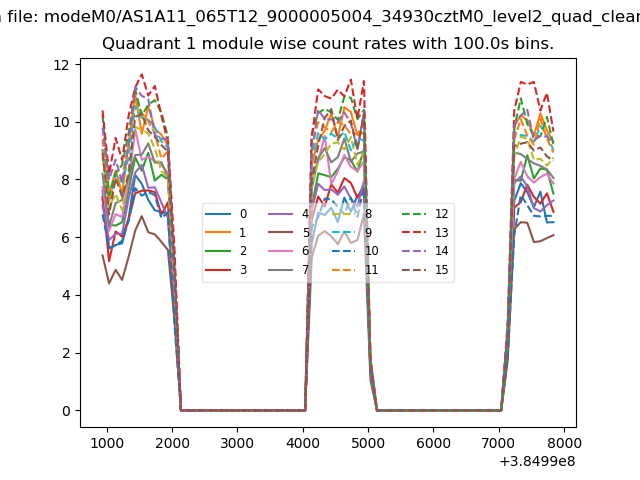
| Module-wise count rates for Quadrant A Data is divided into 100 sec bins |
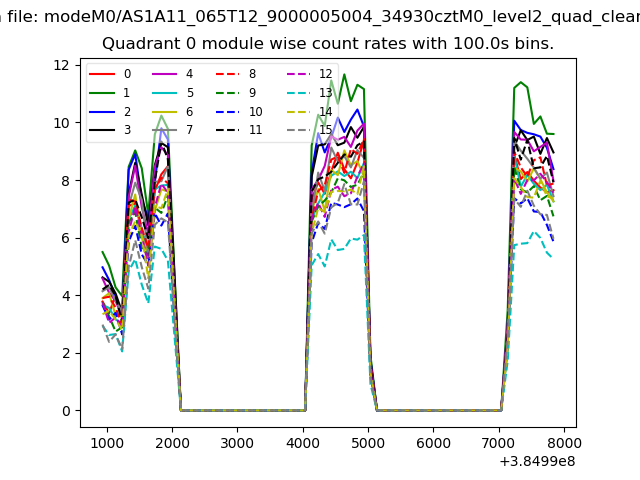 |
 |
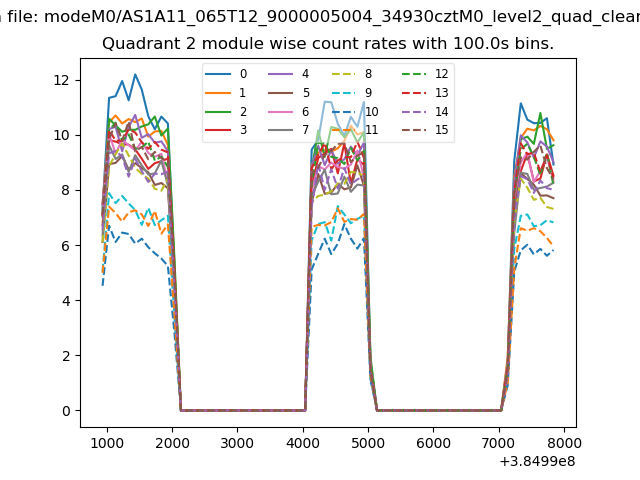
| Module-wise count rates for Quadrant B Data is divided into 100 sec bins |
 |
 |
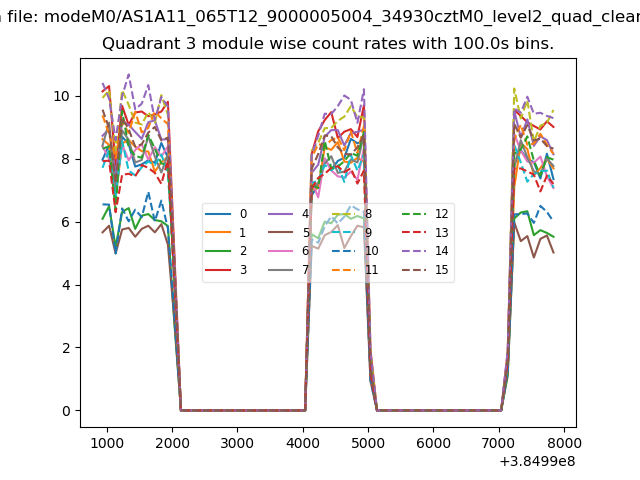
| Module-wise count rates for Quadrant C Data is divided into 100 sec bins |
 |
 |
| Module-wise count rates for Quadrant D Data is divided into 100 sec bins |
 |
 |
| Parameter | Plot |
|---|---|
| CZT HV Monitor | 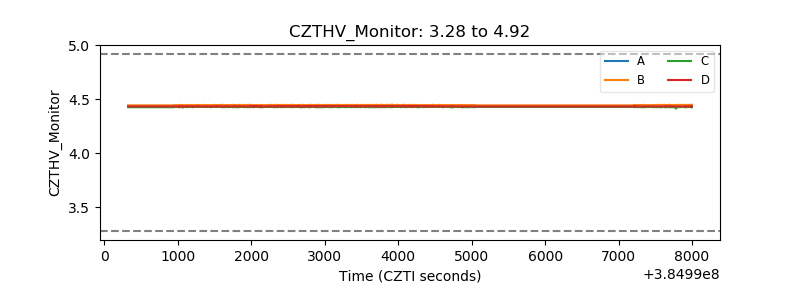 |
| D_VDD | 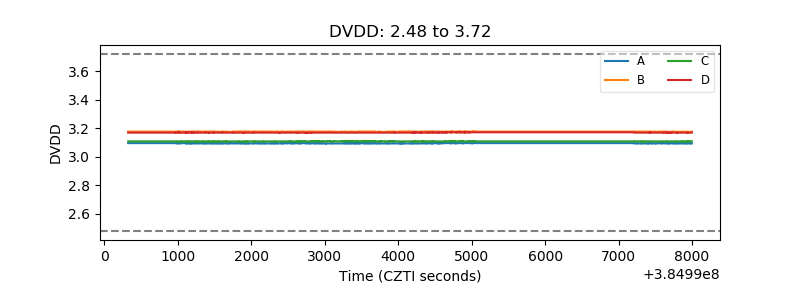 |
| Temperature 1 | 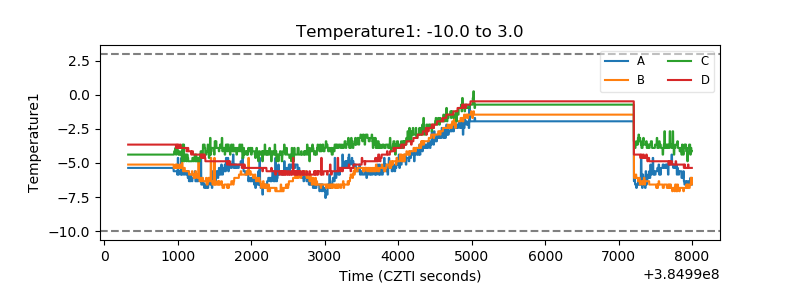 |
| Veto HV Monitor | 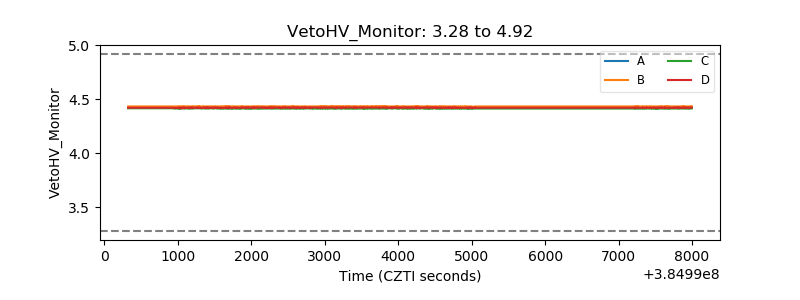 |
| Veto LLD | 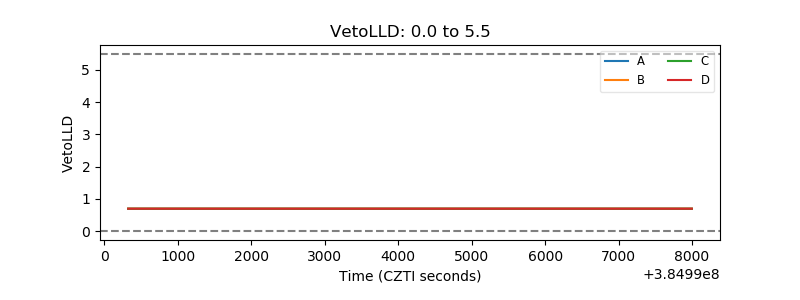 |
| Alpha Counter | 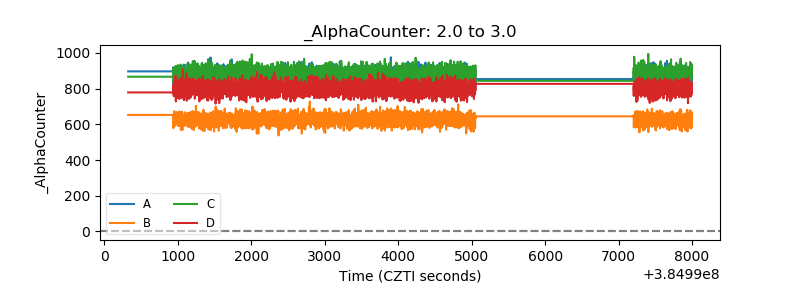 |
| _CPM_Rate | 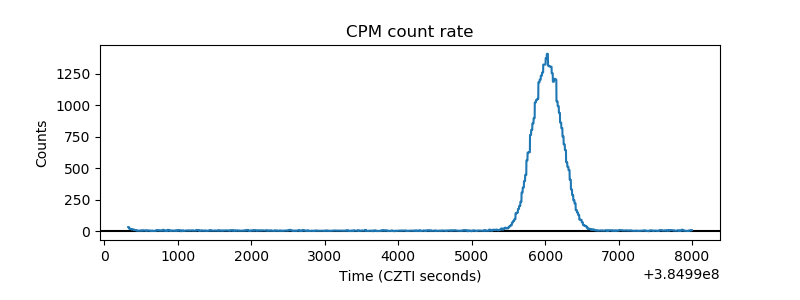 |
| CZT Counter | 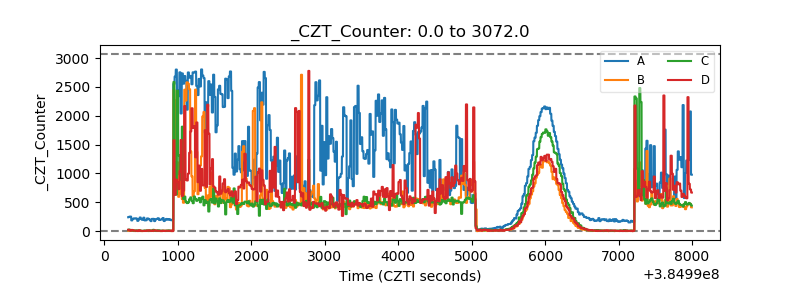 |
| +2.5 Volts monitor | 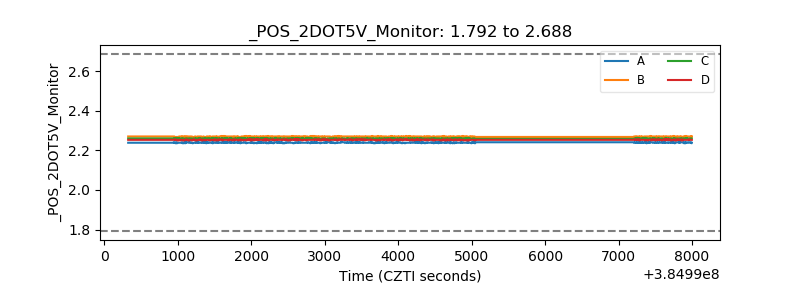 |
| +5 Volts monitor | 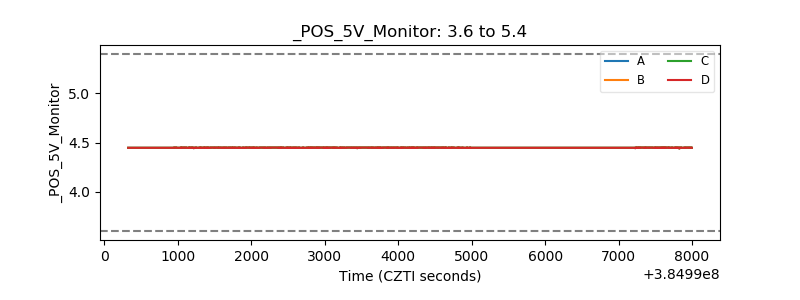 |
| _ROLL_ROT | 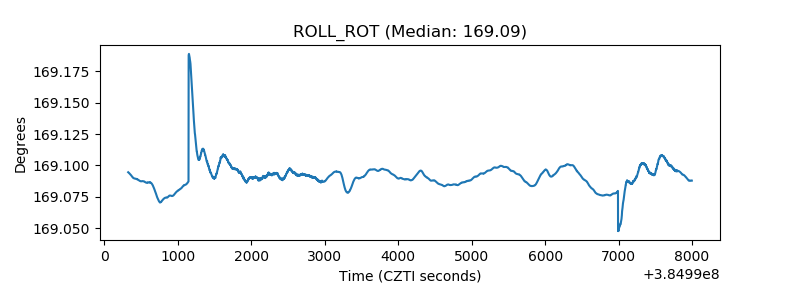 |
| _Roll_DEC | 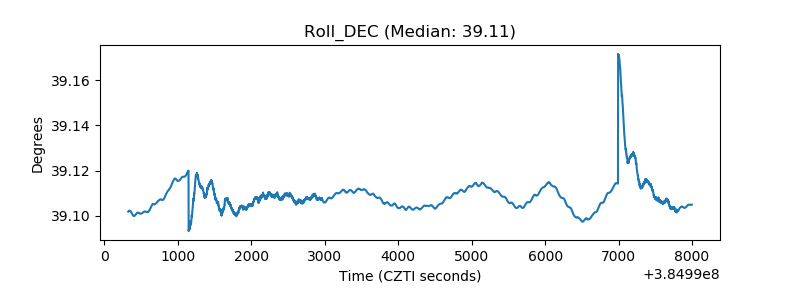 |
| _Roll_RA | 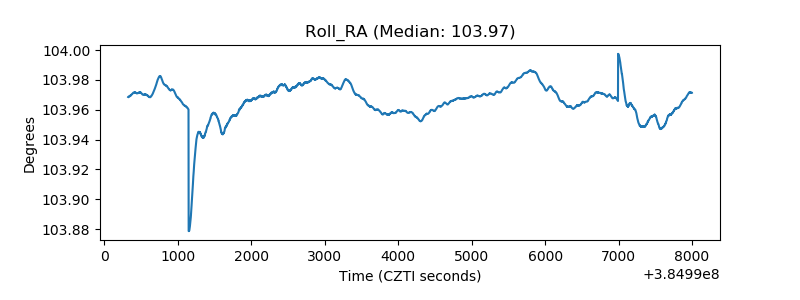 |
| Veto Counter | 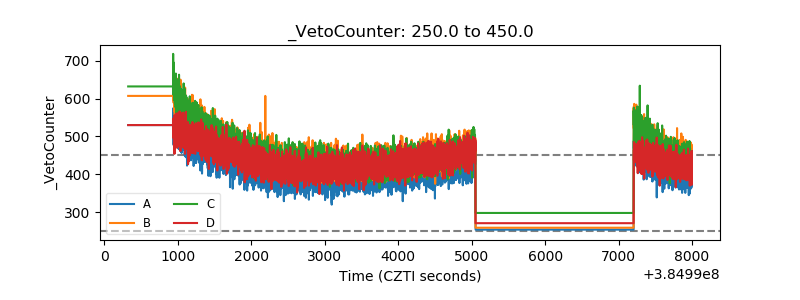 |