| Param | Original file | Final file |
|---|---|---|
| Filename | modeM0/AS1A11_065T12_9000005004_34929cztM0_level2.evt | modeM0/AS1A11_065T12_9000005004_34929cztM0_level2_quad_clean.evt |
| Size (bytes) | 241,804,800 | 23,644,800 |
| Size | 230.6 MB | 22.5 MB |
| Events in quadrant A | 3,144,361 | 85,726 |
| Events in quadrant B | 1,710,526 | 166,594 |
| Events in quadrant C | 1,003,497 | 179,171 |
| Events in quadrant D | 1,352,698 | 164,046 |
| Mode M9 | |||
|---|---|---|---|
| Quadrant | BADHDUFLAG | Total packets | Discarded packets |
| A | 0 | 22 | 0 |
| B | 0 | 22 | 0 |
| C | 0 | 22 | 0 |
| D | 0 | 22 | 0 |
| Mode SS | |||
|---|---|---|---|
| Quadrant | BADHDUFLAG | Total packets | Discarded packets |
| A | 0 | 32 | 0 |
| B | 0 | 32 | 0 |
| C | 0 | 32 | 0 |
| D | 0 | 32 | 0 |
| Mode M0 | |||
|---|---|---|---|
| Quadrant | BADHDUFLAG | Total packets | Discarded packets |
| A | 0 | 10521 | 2 |
| B | 0 | 6162 | 1 |
| C | 0 | 3835 | 1 |
| D | 0 | 5128 | 1 |
| Quadrant | Total seconds | Saturated seconds | Saturation percentage |
|---|---|---|---|
| A | 1628 | 1410 | 86.609337% |
| B | 1628 | 305 | 18.734644% |
| C | 1628 | 58 | 3.562654% |
| D | 1628 | 78 | 4.791155% |
Noise dominated data is calculated using 1-second bins in cleaned event files. If a bin has >2000 counts, and if more than 50% of those come from <1% of pixels, then it is considered to be noise-dominated and hence unusable.
| Quadrant | # 1 sec bins | Bins with >0 counts | Bins with >2000 counts | High rate bins dominated by noise | Noise dominated (total time) | Noise dominated (detector-on time) | Marked lightcurve |
|---|---|---|---|---|---|---|---|
| A | 3751 | 1628 | 752 | 752 | 20.05% | 46.19% | 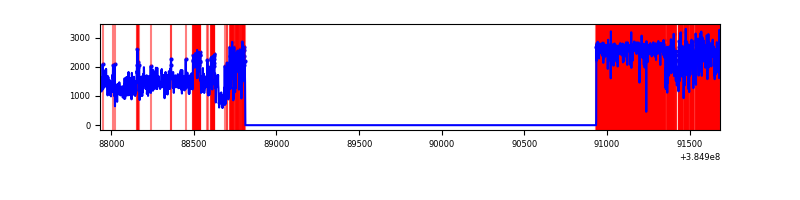 |
| B | 3752 | 1629 | 241 | 241 | 6.42% | 14.79% | 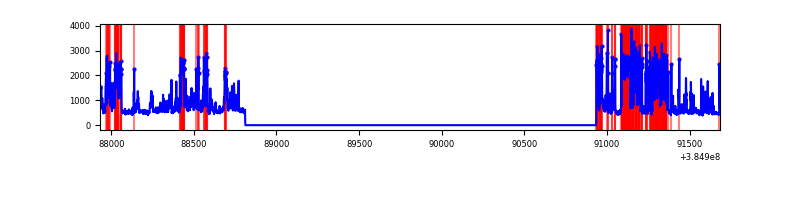 |
| C | 3752 | 1629 | 44 | 44 | 1.17% | 2.70% | 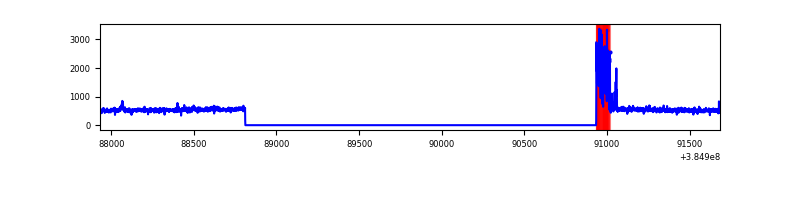 |
| D | 3752 | 1629 | 78 | 78 | 2.08% | 4.79% | 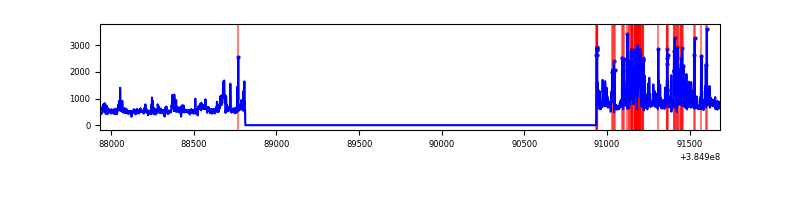 |
Top three noisy pixels from each quadrant. If the there are fewer than three noisy pixels in the level2.evt file, extra rows are filled as -1
| Pixel properties | Quadrant properties | ||||||
|---|---|---|---|---|---|---|---|
| Quadrant | DetID | PixID | Counts | Sigma | Mean | Median | Sigma |
| A | 15 | 169 | 2799007 | 147827.38 | 84 | 82 | 18.9 |
| A | 10 | 83 | 13929 | 731.34 | 84 | 82 | 18.9 |
| A | 13 | 254 | 1348 | 66.86 | 84 | 82 | 18.9 |
| B | 5 | 172 | 858544 | 22573.9 | 190 | 185 | 38.0 |
| B | 5 | 255 | 68694 | 1801.71 | 190 | 185 | 38.0 |
| B | 0 | 245 | 21832 | 569.29 | 190 | 185 | 38.0 |
| C | 0 | 10 | 147450 | 3073.22 | 199 | 200 | 47.9 |
| C | 15 | 214 | 70246 | 1461.92 | 199 | 200 | 47.9 |
| C | 8 | 111 | 6492 | 131.32 | 199 | 200 | 47.9 |
| D | 2 | 31 | 105671 | 2149.56 | 196 | 191 | 49.1 |
| D | 10 | 118 | 104555 | 2126.82 | 196 | 191 | 49.1 |
| D | 2 | 249 | 98975 | 2013.1 | 196 | 191 | 49.1 |
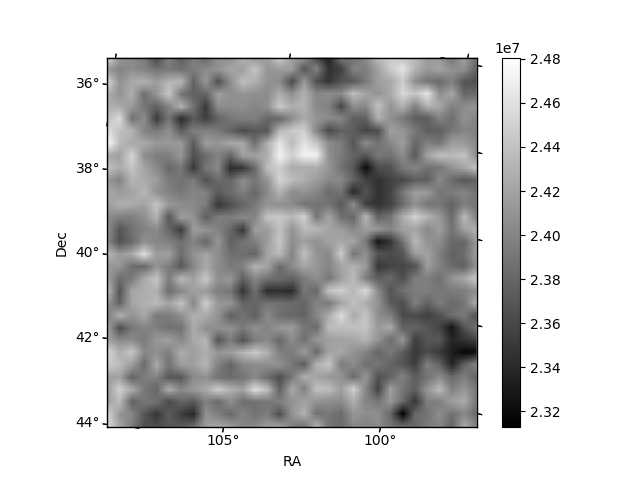
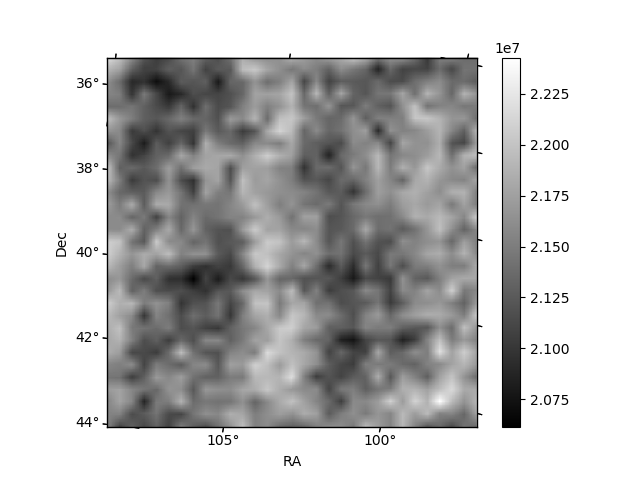
Histogram calculated using DETX and DETY for each event in the final _common_clean file
| Quadrant A | 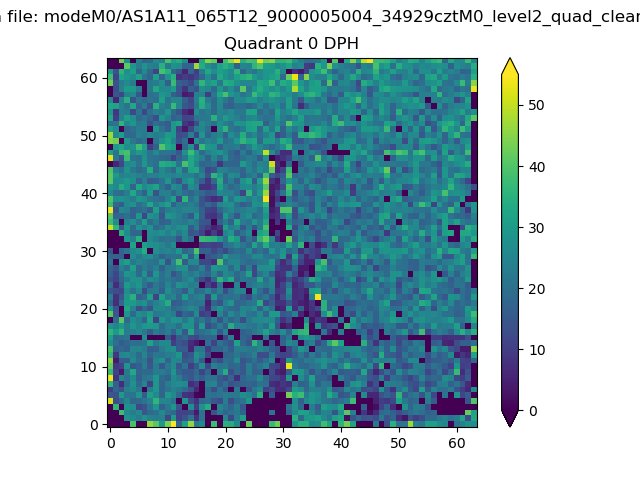 |
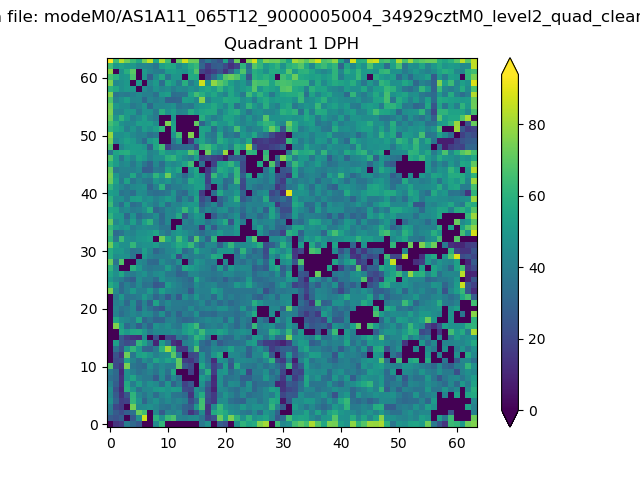 |
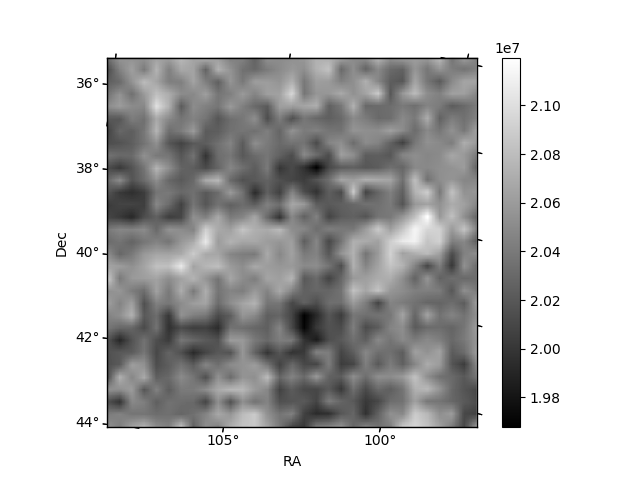
Quadrant B |
|---|---|---|---|
| Quadrant D | 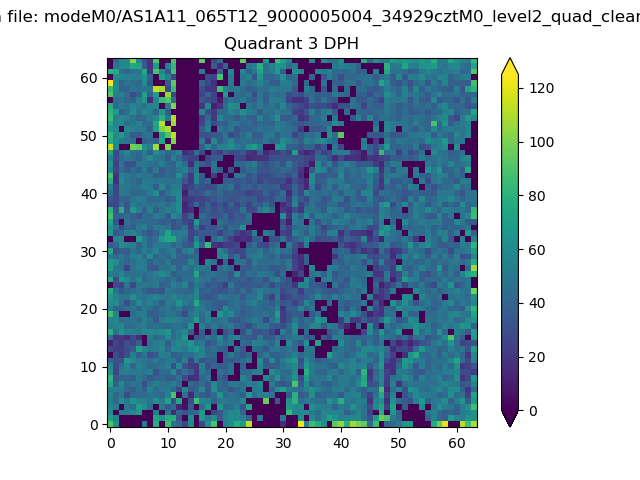 |
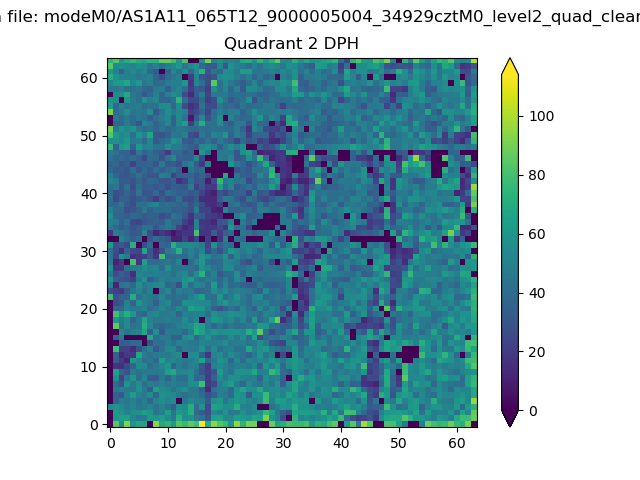 |
Quadrant C |
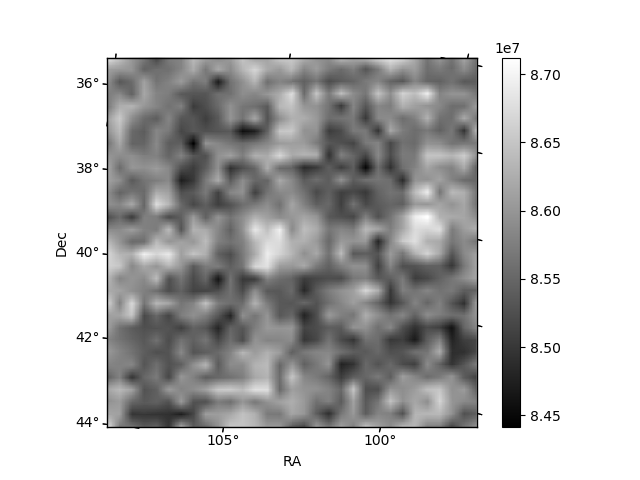
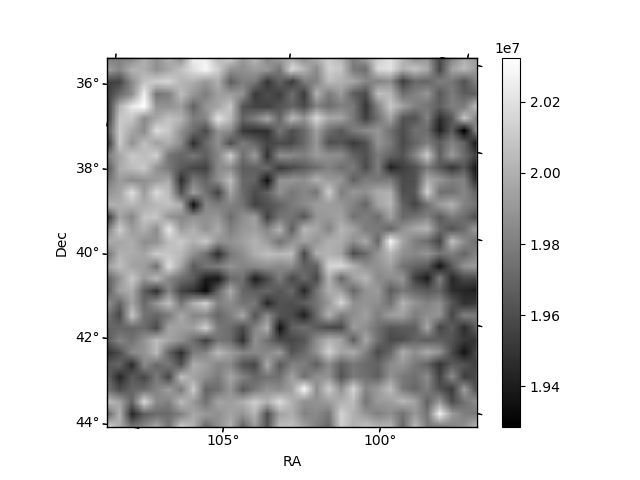
| Plot type | Count rate plots | Images |
|---|---|---|
| Comparison with Poisson distribution Blue bars denote a histogram of data divided into 1 sec bins. Red curve is a Poisson curve with rate = median count rate of data. |
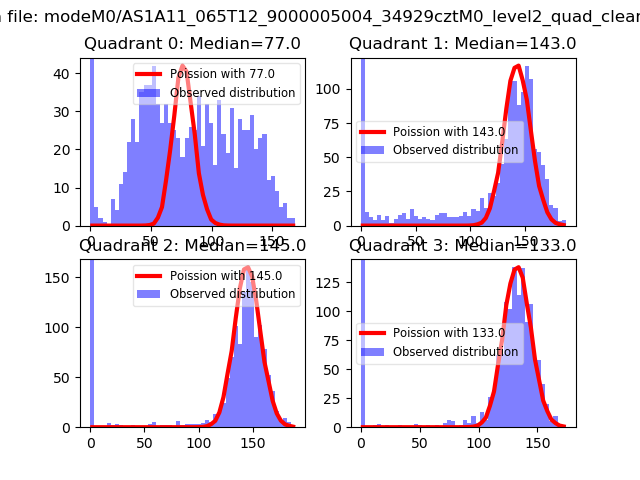 |
 |
| Quadrant-wise count rates Data is divided into 100 sec bins |
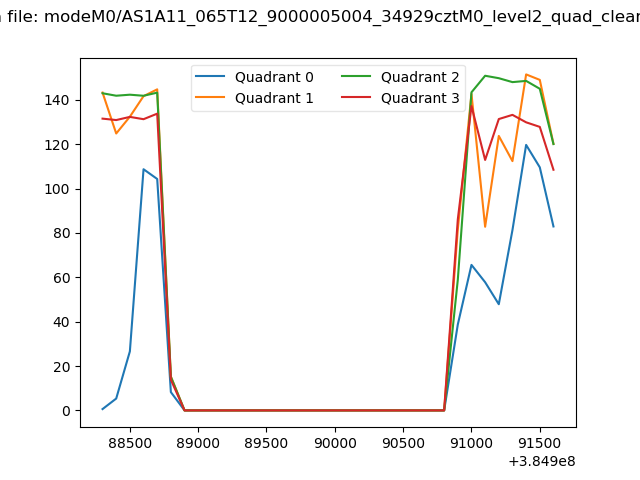 |
|
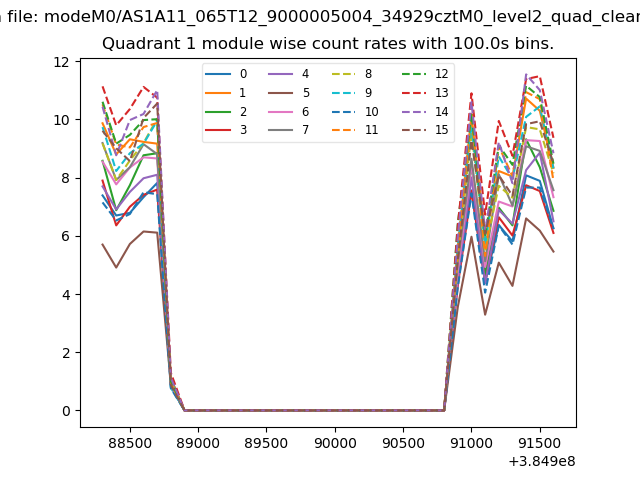
| Module-wise count rates for Quadrant A Data is divided into 100 sec bins |
 |
 |
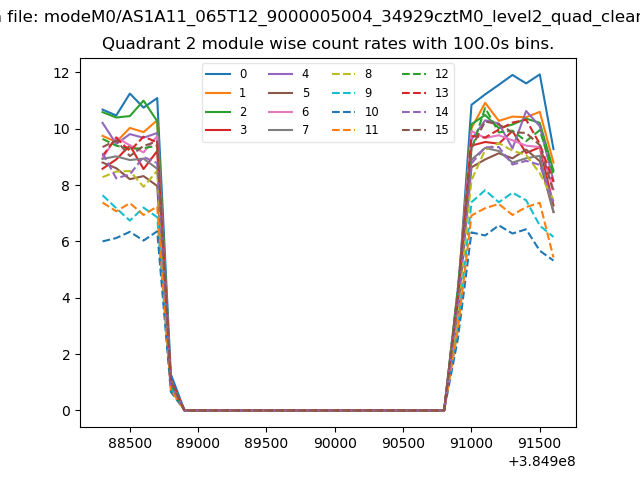
| Module-wise count rates for Quadrant B Data is divided into 100 sec bins |
 |
 |
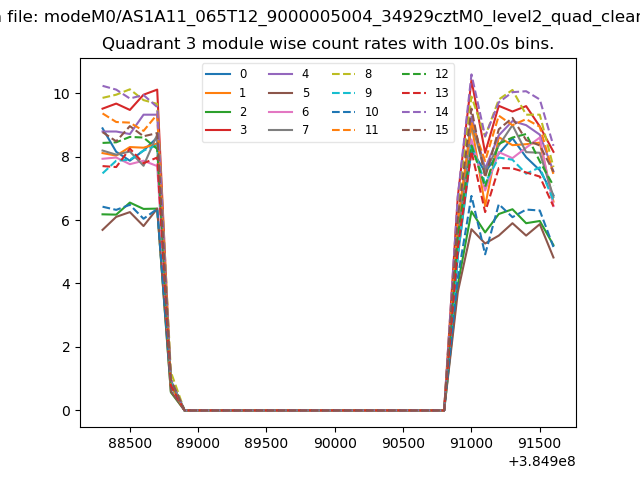
| Module-wise count rates for Quadrant C Data is divided into 100 sec bins |
 |
 |
| Module-wise count rates for Quadrant D Data is divided into 100 sec bins |
 |
 |
| Parameter | Plot |
|---|---|
| CZT HV Monitor | 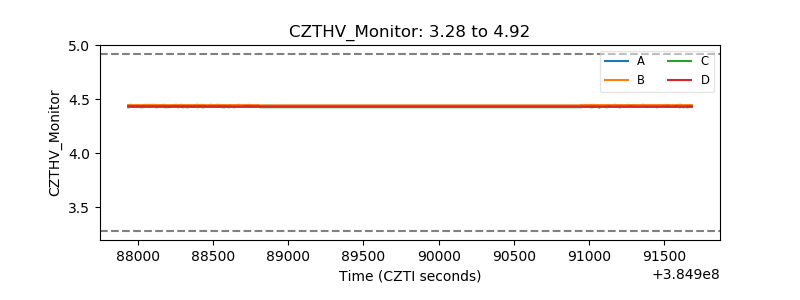 |
| D_VDD | 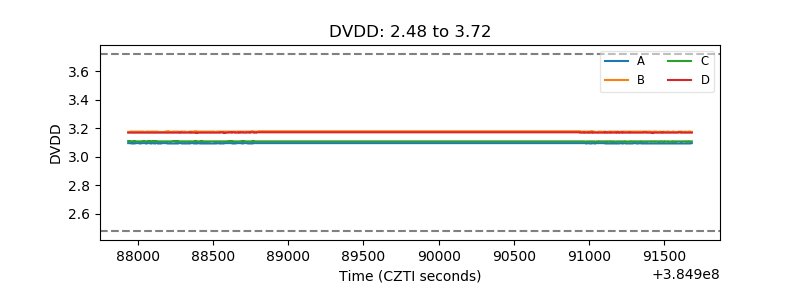 |
| Temperature 1 | 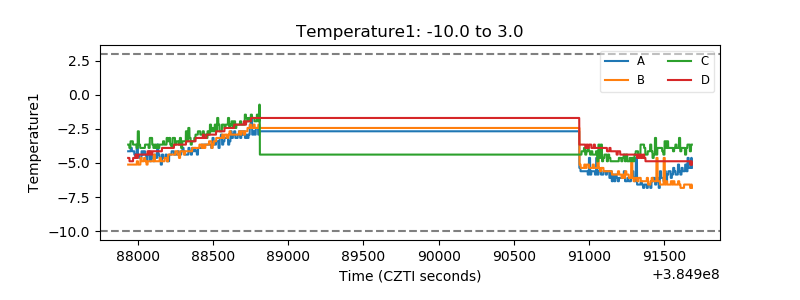 |
| Veto HV Monitor | 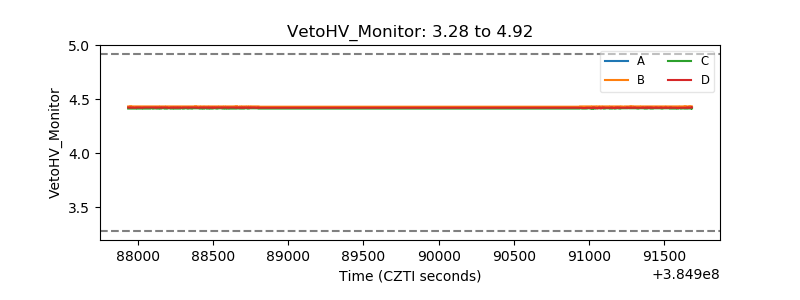 |
| Veto LLD | 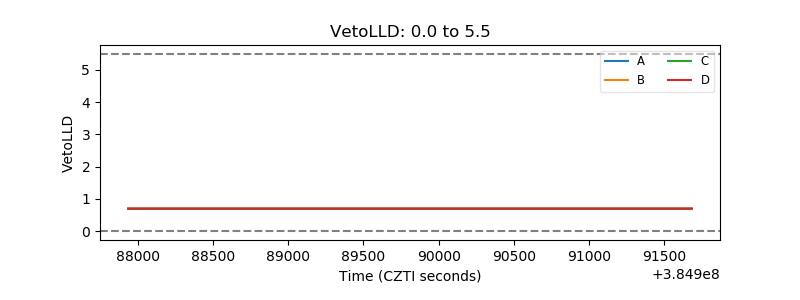 |
| Alpha Counter | 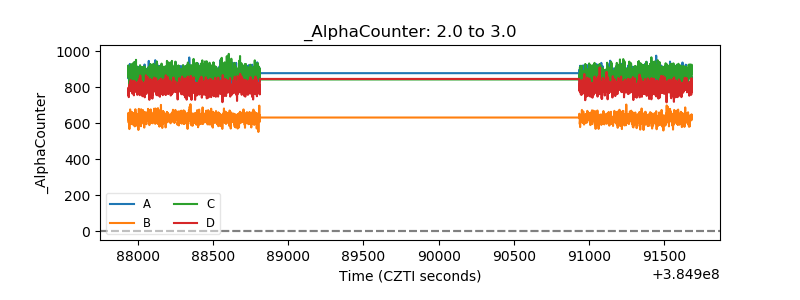 |
| _CPM_Rate | 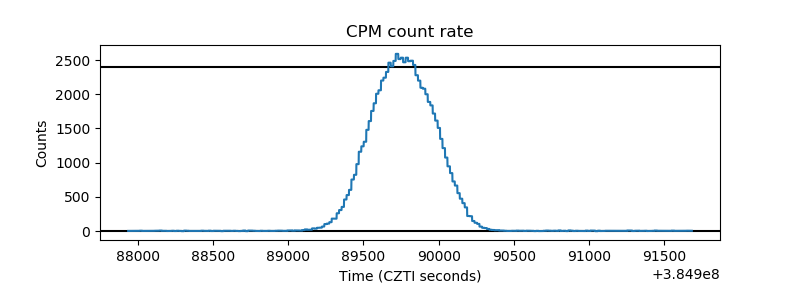 |
| CZT Counter | 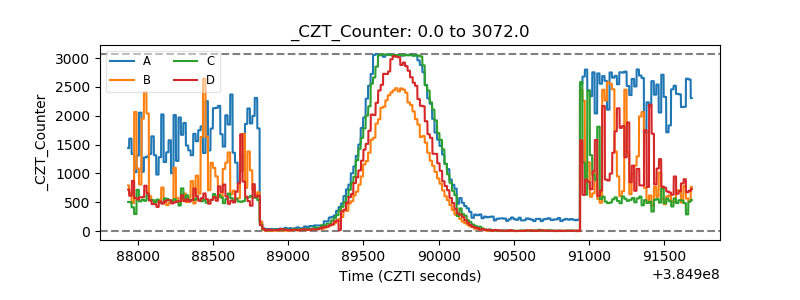 |
| +2.5 Volts monitor | 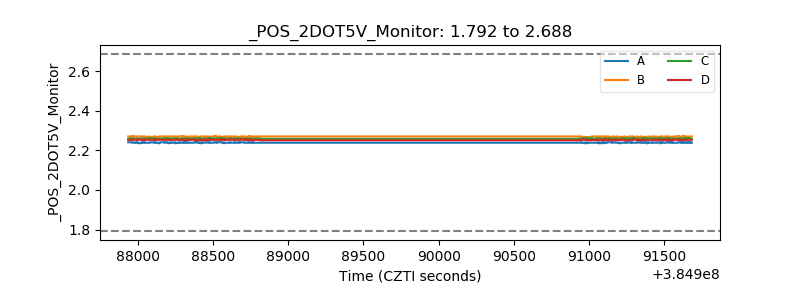 |
| +5 Volts monitor | 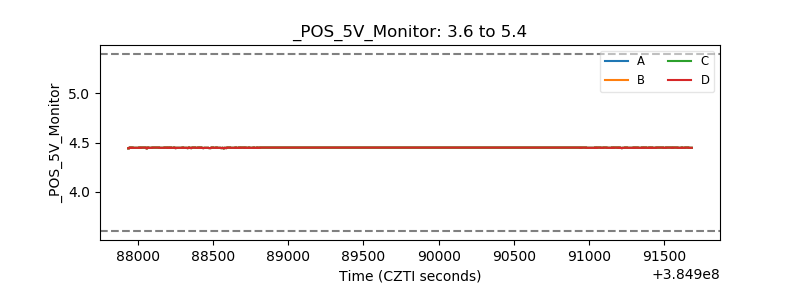 |
| _ROLL_ROT | 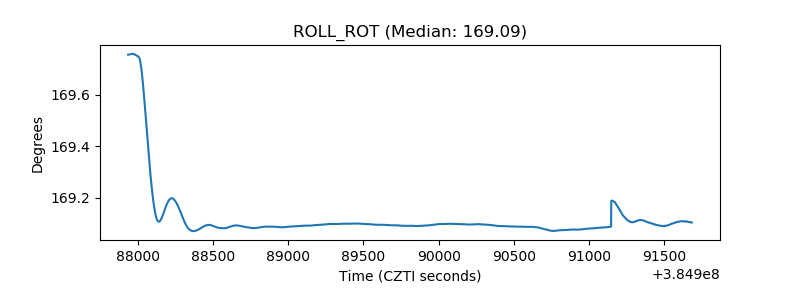 |
| _Roll_DEC | 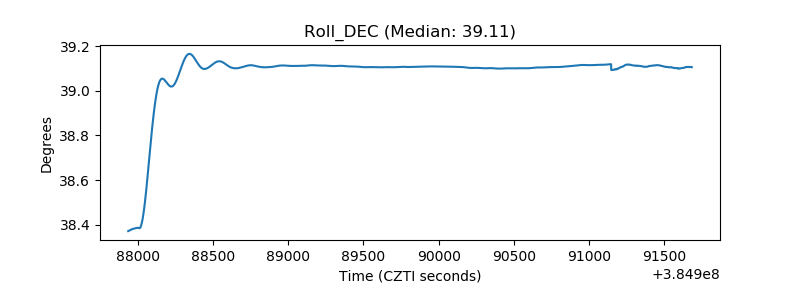 |
| _Roll_RA | 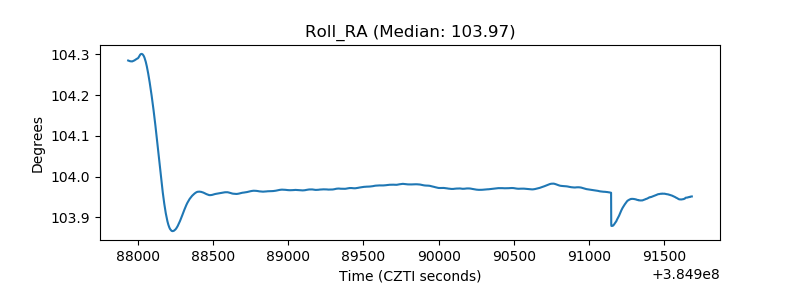 |
| Veto Counter | 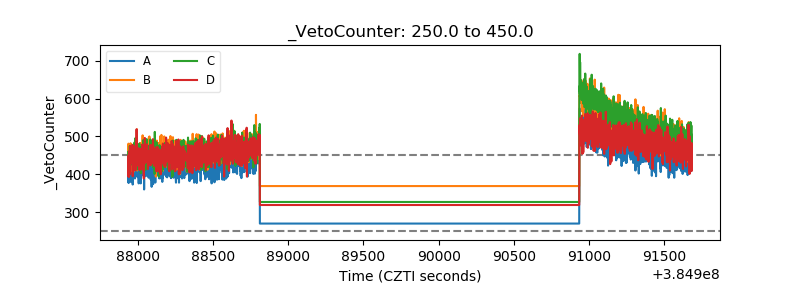 |