| Param | Original file | Final file |
|---|---|---|
| Filename | modeM0/AS1A11_065T12_9000005004cztM0_level2_bc.evt | modeM0/AS1A11_065T12_9000005004cztM0_level2_quad_clean.evt |
| Size (bytes) | 1,981,088,640 | 407,998,080 |
| Size | 1.8 GB | 389.1 MB |
| Events in quadrant A | 22,849,588 | 2,405,416 |
| Events in quadrant B | 9,991,086 | 2,654,950 |
| Events in quadrant C | 9,525,653 | 2,639,892 |
| Events in quadrant D | 15,417,185 | 2,418,895 |
| Mode M9 | |||
|---|---|---|---|
| Quadrant | BADHDUFLAG | Total packets | Discarded packets |
| A | 0 | 122 | 0 |
| B | 0 | 122 | 0 |
| C | 0 | 122 | 0 |
| D | 0 | 122 | 0 |
| Mode SS | |||
|---|---|---|---|
| Quadrant | BADHDUFLAG | Total packets | Discarded packets |
| A | 0 | 664 | 0 |
| B | 0 | 664 | 0 |
| C | 0 | 664 | 0 |
| D | 0 | 664 | 0 |
| Mode M0 | |||
|---|---|---|---|
| Quadrant | BADHDUFLAG | Total packets | Discarded packets |
| A | 0 | 127812 | 0 |
| B | 0 | 79635 | 0 |
| C | 0 | 72080 | 0 |
| D | 0 | 95845 | 0 |
| Quadrant | Total seconds | Saturated seconds | Saturation percentage |
|---|---|---|---|
| A | 32549 | 5852 | 17.979047% |
| B | 32549 | 935 | 2.872592% |
| C | 32549 | 423 | 1.299579% |
| D | 32549 | 1341 | 4.119942% |
Noise dominated data is calculated using 1-second bins in cleaned event files. If a bin has >2000 counts, and if more than 50% of those come from <1% of pixels, then it is considered to be noise-dominated and hence unusable.
| Quadrant | # 1 sec bins | Bins with >0 counts | Bins with >2000 counts | High rate bins dominated by noise | Noise dominated (total time) | Noise dominated (detector-on time) | Marked lightcurve |
|---|---|---|---|---|---|---|---|
| A | 44769 | 32422 | 477 | 477 | 1.07% | 1.47% | 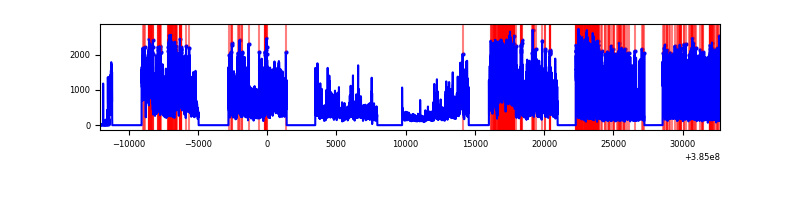 |
| B | 44770 | 32549 | 56 | 56 | 0.13% | 0.17% | 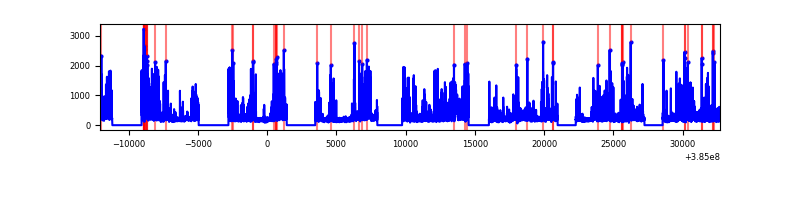 |
| C | 44770 | 32549 | 97 | 97 | 0.22% | 0.30% | 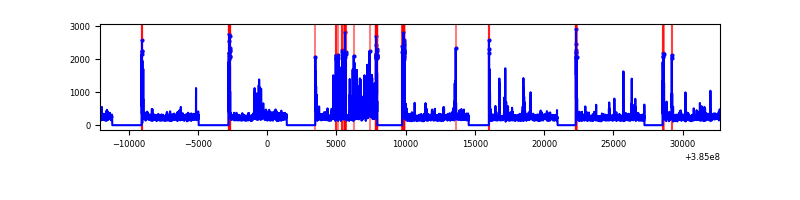 |
| D | 44770 | 32548 | 243 | 243 | 0.54% | 0.75% | 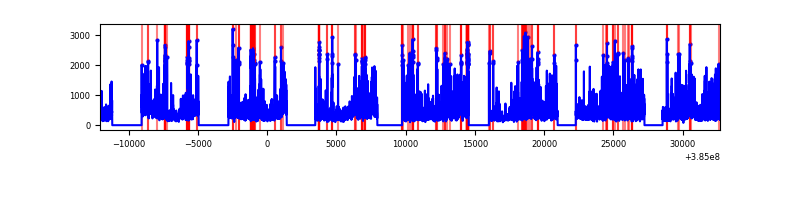 |
Top three noisy pixels from each quadrant. If the there are fewer than three noisy pixels in the level2.evt file, extra rows are filled as -1
| Pixel properties | Quadrant properties | ||||||
|---|---|---|---|---|---|---|---|
| Quadrant | DetID | PixID | Counts | Sigma | Mean | Median | Sigma |
| A | 15 | 169 | 16686547 | 49250.53 | 1500 | 1472 | 338.8 |
| A | 10 | 83 | 236881 | 694.87 | 1500 | 1472 | 338.8 |
| A | 13 | 6 | 54470 | 156.44 | 1500 | 1472 | 338.8 |
| B | 5 | 172 | 2441454 | 7488.56 | 1641 | 1603 | 325.8 |
| B | 0 | 190 | 435569 | 1331.96 | 1641 | 1603 | 325.8 |
| B | 4 | 232 | 228362 | 695.98 | 1641 | 1603 | 325.8 |
| C | 15 | 214 | 1285561 | 3433.54 | 1622 | 1607 | 373.9 |
| C | 0 | 10 | 756221 | 2017.98 | 1622 | 1607 | 373.9 |
| C | 4 | 254 | 742716 | 1981.87 | 1622 | 1607 | 373.9 |
| D | 8 | 195 | 4345868 | 11396.65 | 1584 | 1533 | 381.2 |
| D | 7 | 38 | 660290 | 1728.14 | 1584 | 1533 | 381.2 |
| D | 2 | 249 | 513897 | 1344.1 | 1584 | 1533 | 381.2 |
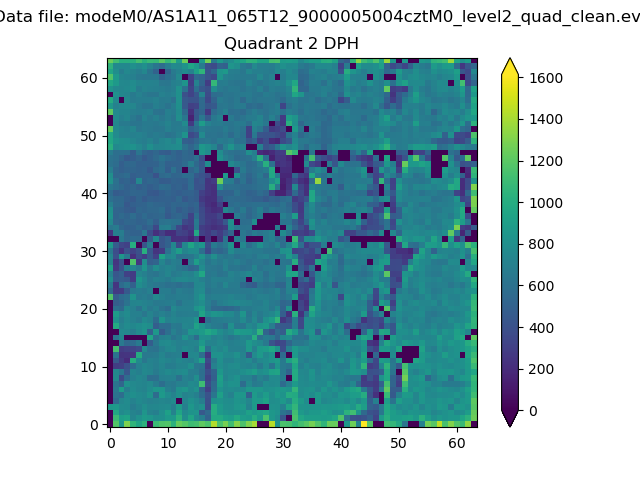
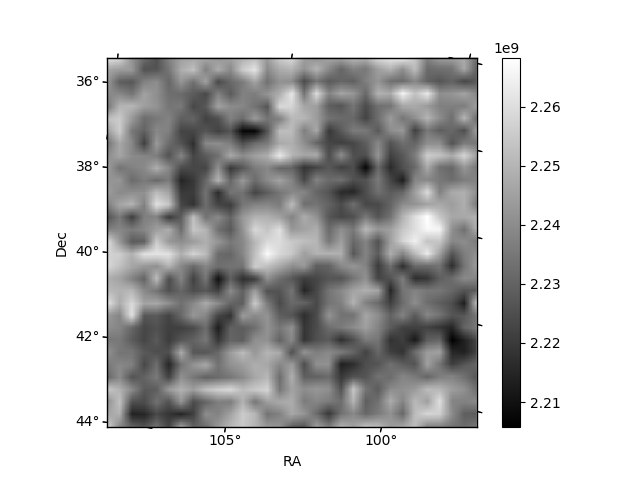
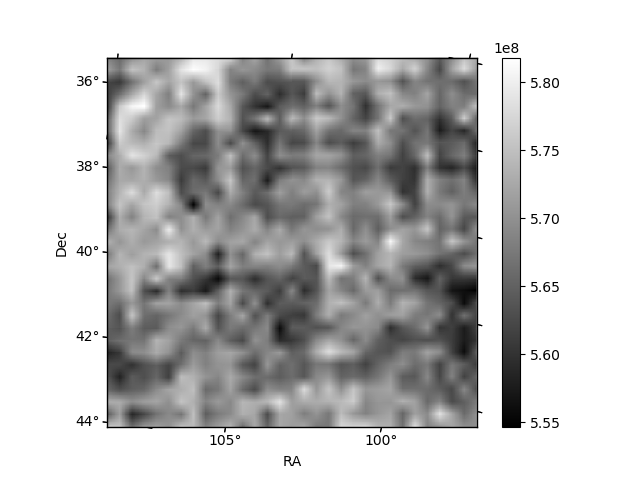
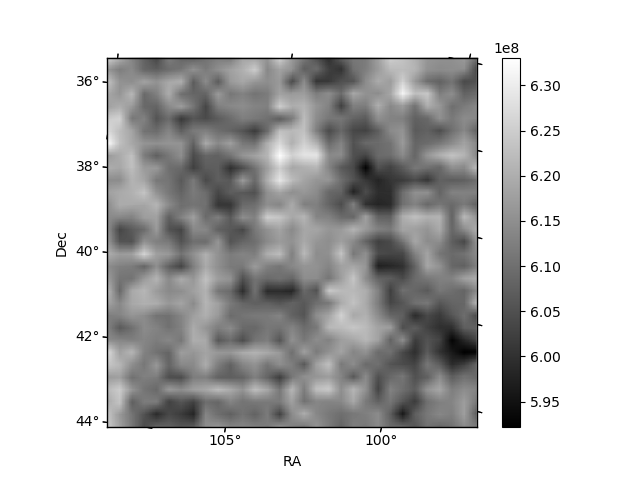
Histogram calculated using DETX and DETY for each event in the final _common_clean file
| Quadrant A | 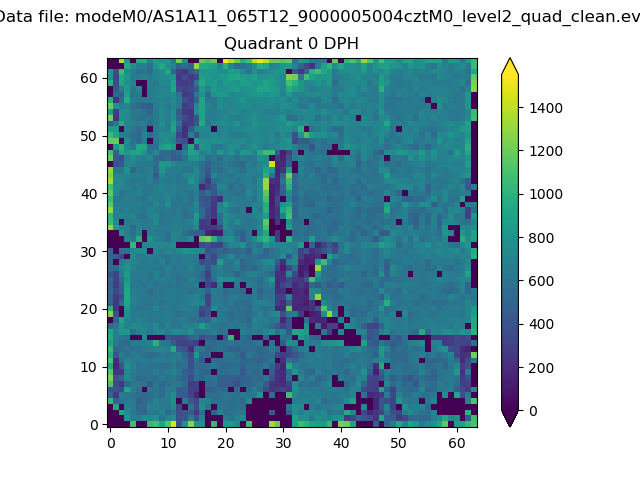 |
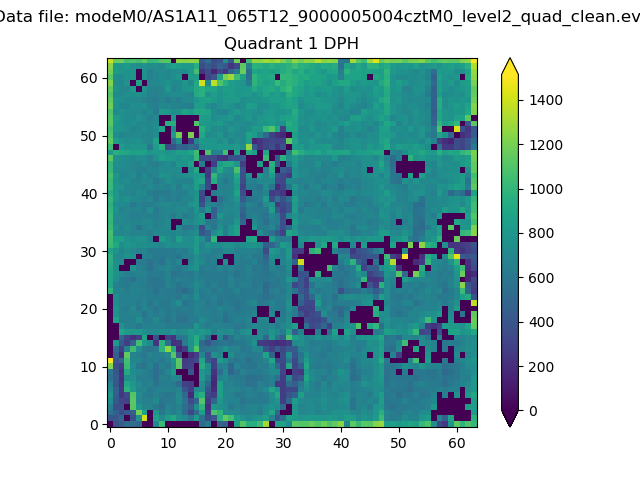 |
Quadrant B |
|---|---|---|---|
| Quadrant D | 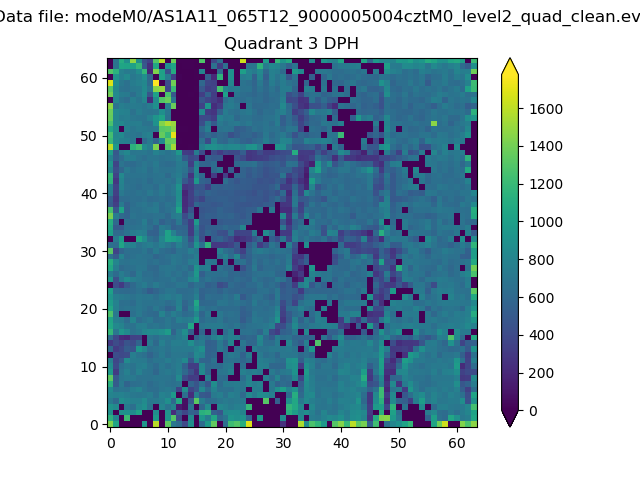 |
 |
Quadrant C |
| Plot type | Count rate plots | Images |
|---|---|---|
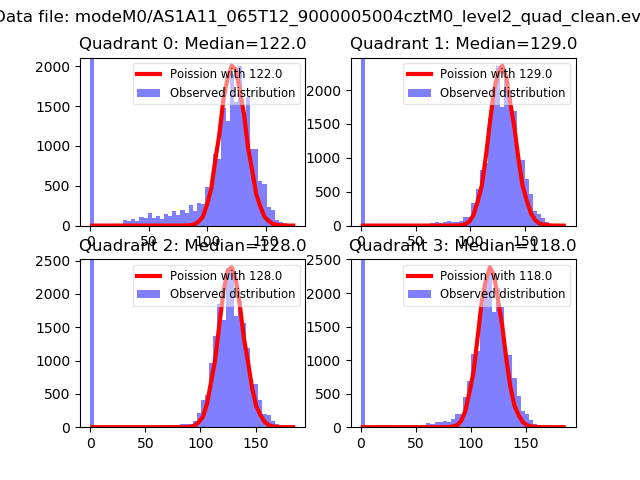
| Comparison with Poisson distribution Blue bars denote a histogram of data divided into 1 sec bins. Red curve is a Poisson curve with rate = median count rate of data. |
 |
 |
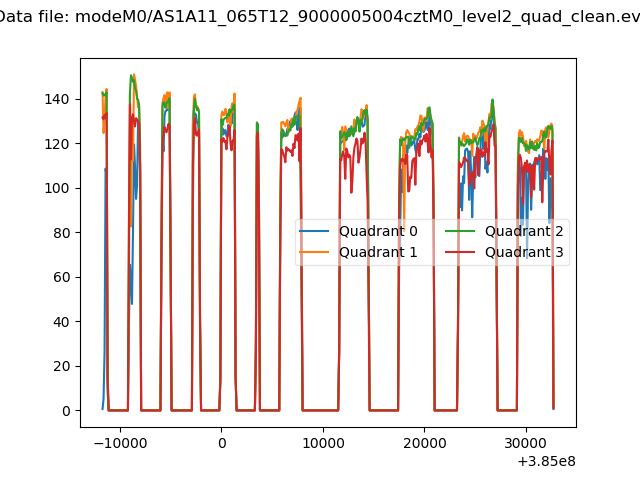
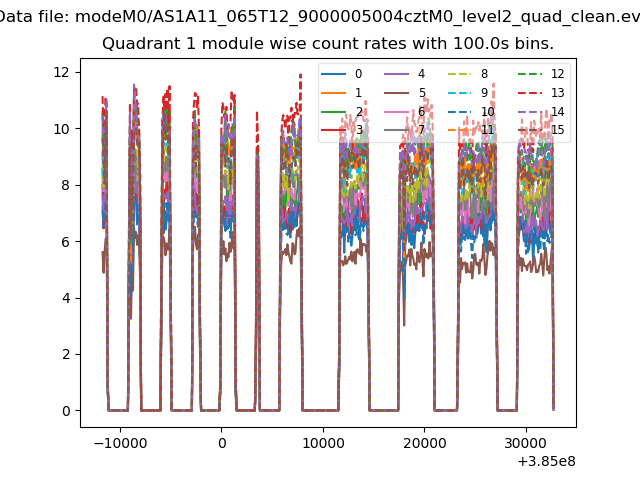
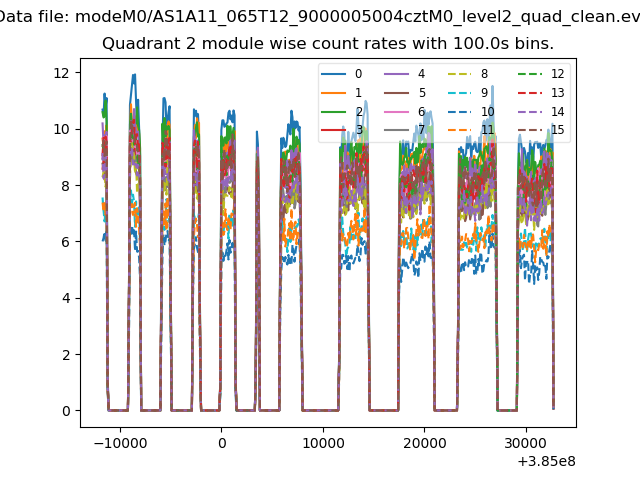
| Quadrant-wise count rates Data is divided into 100 sec bins |
 |
|
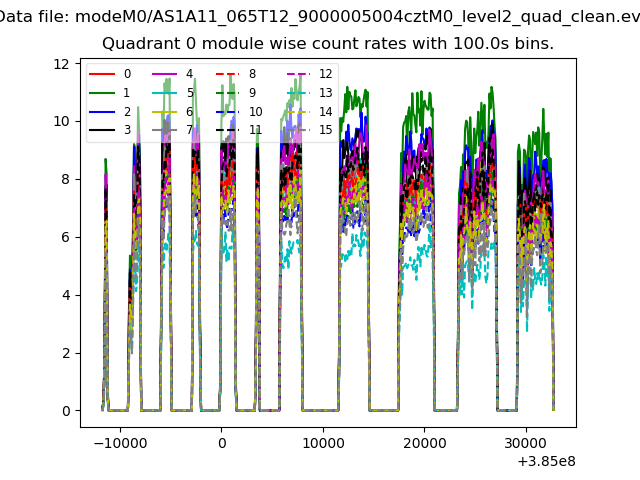
| Module-wise count rates for Quadrant A Data is divided into 100 sec bins |
 |
 |
| Module-wise count rates for Quadrant B Data is divided into 100 sec bins |
 |
 |
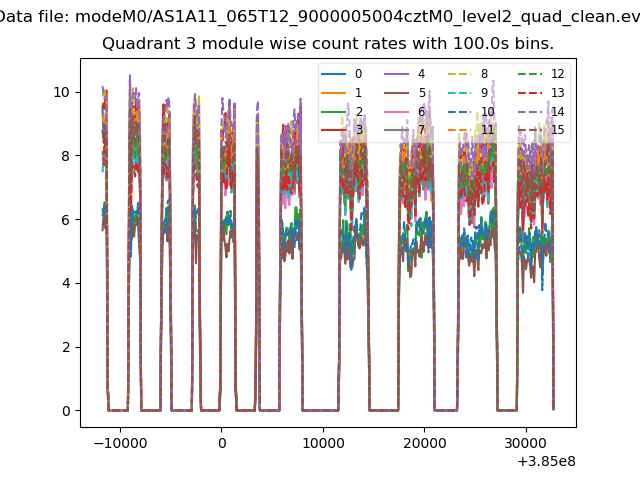
| Module-wise count rates for Quadrant C Data is divided into 100 sec bins |
 |
 |
| Module-wise count rates for Quadrant D Data is divided into 100 sec bins |
 |
 |
| Parameter | Plot |
|---|---|
| CZT HV Monitor | 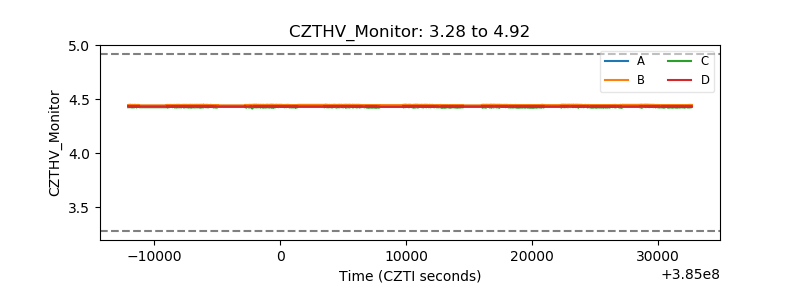 |
| D_VDD | 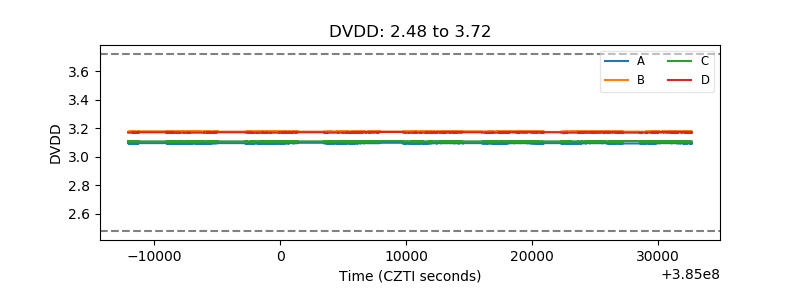 |
| Temperature 1 | 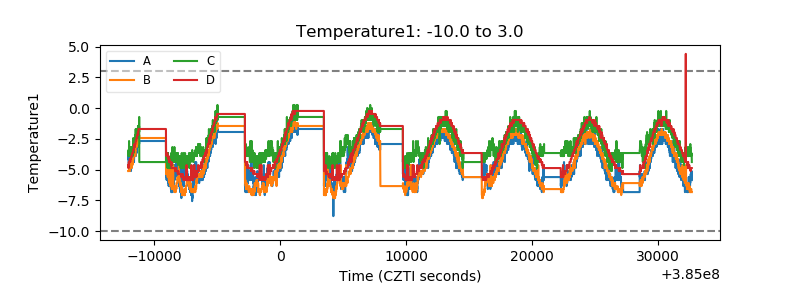 |
| Veto HV Monitor | 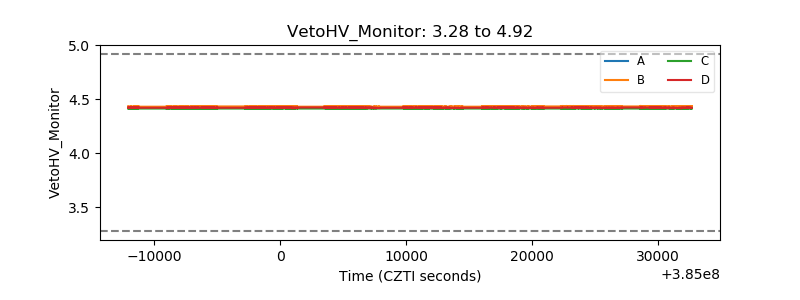 |
| Veto LLD | 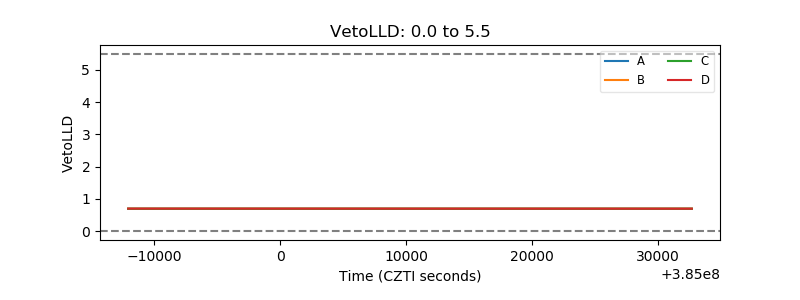 |
| Alpha Counter | 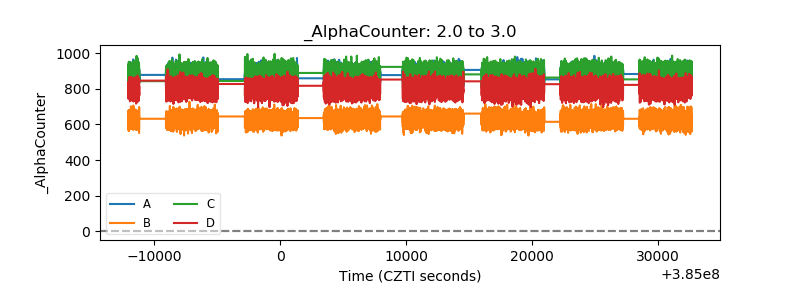 |
| _CPM_Rate | 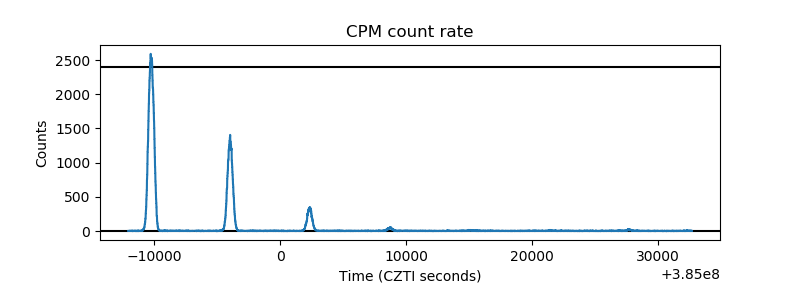 |
| CZT Counter | 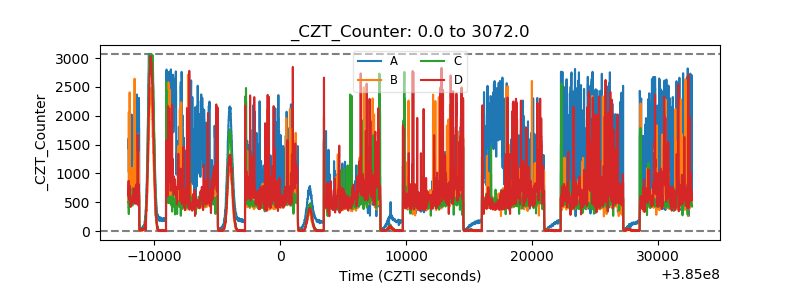 |
| +2.5 Volts monitor | 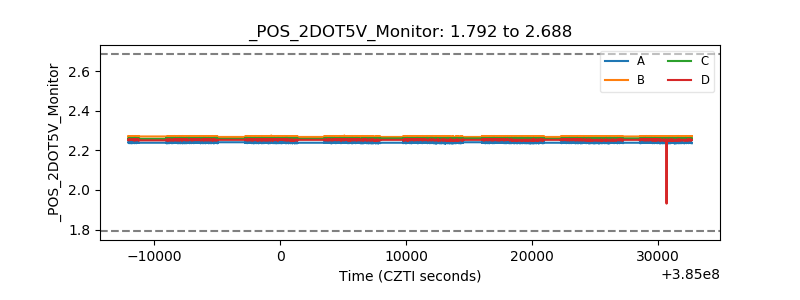 |
| +5 Volts monitor | 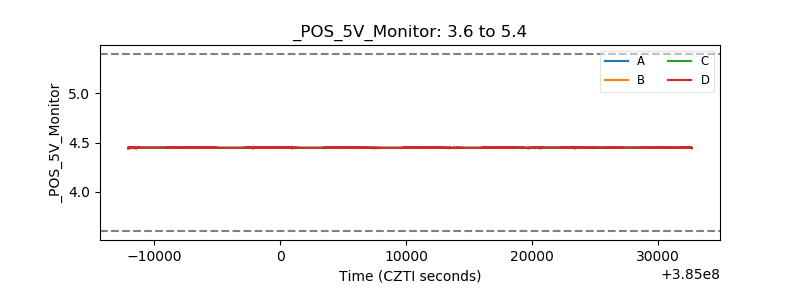 |
| _ROLL_ROT | 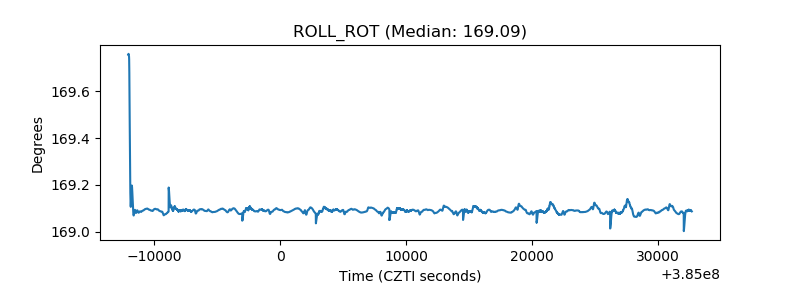 |
| _Roll_DEC | 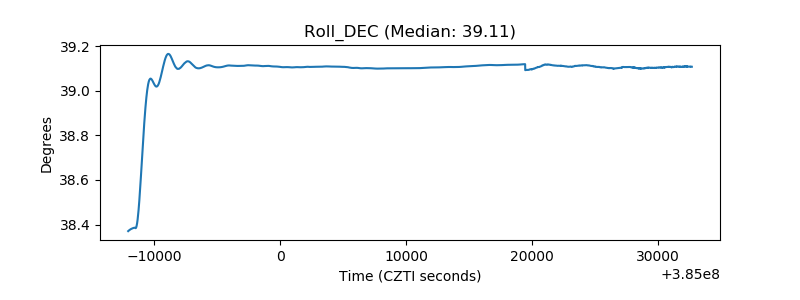 |
| _Roll_RA | 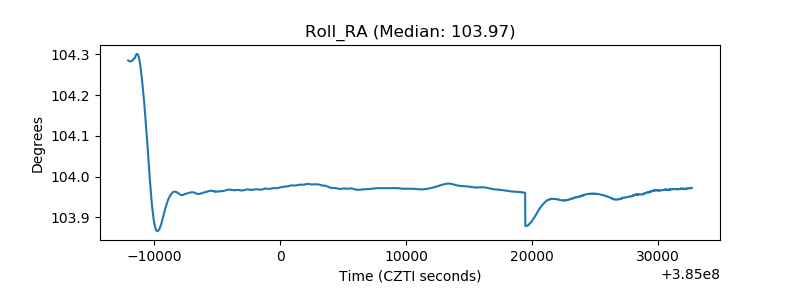 |
| Veto Counter | 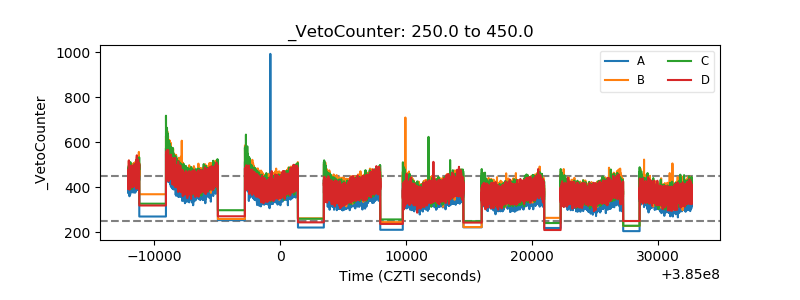 |