| Param | Original file | Final file |
|---|---|---|
| Filename | modeM0/AS1A11_086T01_9000005002_34924cztM0_level2.evt | modeM0/AS1A11_086T01_9000005002_34924cztM0_level2_quad_clean.evt |
| Size (bytes) | 487,984,320 | 85,213,440 |
| Size | 465.4 MB | 81.3 MB |
| Events in quadrant A | 2,572,252 | 575,715 |
| Events in quadrant B | 3,924,951 | 560,936 |
| Events in quadrant C | 2,913,981 | 565,777 |
| Events in quadrant D | 4,998,749 | 497,398 |
| Mode M9 | |||
|---|---|---|---|
| Quadrant | BADHDUFLAG | Total packets | Discarded packets |
| A | 0 | 23 | 0 |
| B | 0 | 23 | 0 |
| C | 0 | 23 | 0 |
| D | 0 | 24 | 0 |
| Mode SS | |||
|---|---|---|---|
| Quadrant | BADHDUFLAG | Total packets | Discarded packets |
| A | 0 | 110 | 0 |
| B | 0 | 110 | 0 |
| C | 0 | 110 | 0 |
| D | 0 | 110 | 0 |
| Mode M0 | |||
|---|---|---|---|
| Quadrant | BADHDUFLAG | Total packets | Discarded packets |
| A | 0 | 11224 | 3 |
| B | 0 | 15162 | 2 |
| C | 0 | 11857 | 2 |
| D | 0 | 18692 | 2 |
| Quadrant | Total seconds | Saturated seconds | Saturation percentage |
|---|---|---|---|
| A | 5435 | 6 | 0.110396% |
| B | 5435 | 402 | 7.396504% |
| C | 5435 | 109 | 2.005520% |
| D | 5435 | 527 | 9.696412% |
Noise dominated data is calculated using 1-second bins in cleaned event files. If a bin has >2000 counts, and if more than 50% of those come from <1% of pixels, then it is considered to be noise-dominated and hence unusable.
| Quadrant | # 1 sec bins | Bins with >0 counts | Bins with >2000 counts | High rate bins dominated by noise | Noise dominated (total time) | Noise dominated (detector-on time) | Marked lightcurve |
|---|---|---|---|---|---|---|---|
| A | 7079 | 5436 | 1 | 1 | 0.01% | 0.02% | 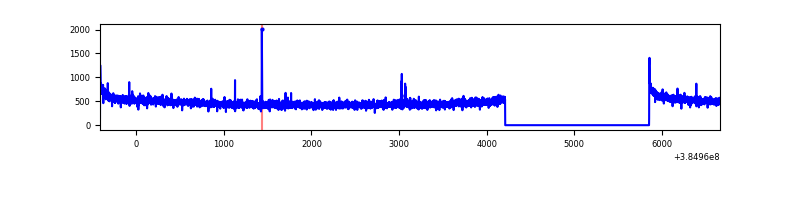 |
| B | 7079 | 5436 | 315 | 315 | 4.45% | 5.79% | 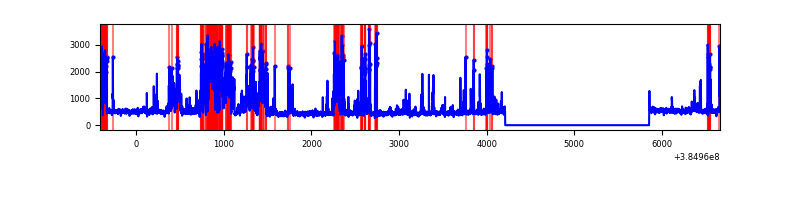 |
| C | 7079 | 5436 | 83 | 83 | 1.17% | 1.53% | 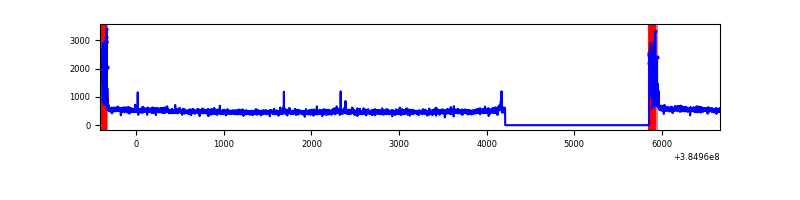 |
| D | 7079 | 5436 | 475 | 475 | 6.71% | 8.74% | 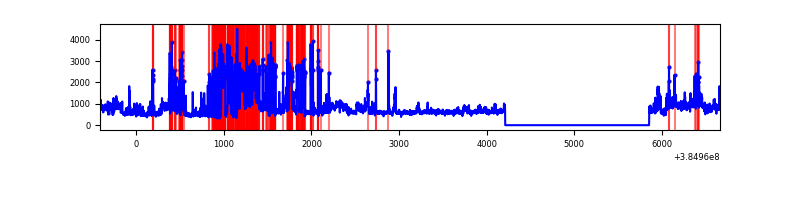 |
Top three noisy pixels from each quadrant. If the there are fewer than three noisy pixels in the level2.evt file, extra rows are filled as -1
| Pixel properties | Quadrant properties | ||||||
|---|---|---|---|---|---|---|---|
| Quadrant | DetID | PixID | Counts | Sigma | Mean | Median | Sigma |
| A | 10 | 83 | 63086 | 488.21 | 636 | 624 | 127.9 |
| A | 15 | 169 | 22180 | 168.49 | 636 | 624 | 127.9 |
| A | 7 | 16 | 14140 | 105.64 | 636 | 624 | 127.9 |
| B | 5 | 172 | 1316502 | 10993.37 | 612 | 595 | 119.7 |
| B | 0 | 190 | 155695 | 1295.74 | 612 | 595 | 119.7 |
| B | 4 | 232 | 31057 | 254.49 | 612 | 595 | 119.7 |
| C | 0 | 10 | 261152 | 1836.49 | 613 | 618 | 141.9 |
| C | 15 | 214 | 227828 | 1601.59 | 613 | 618 | 141.9 |
| C | 14 | 67 | 15508 | 104.96 | 613 | 618 | 141.9 |
| D | 7 | 38 | 1188404 | 8414.25 | 584 | 570 | 141.2 |
| D | 8 | 195 | 702678 | 4973.51 | 584 | 570 | 141.2 |
| D | 2 | 31 | 467509 | 3307.65 | 584 | 570 | 141.2 |
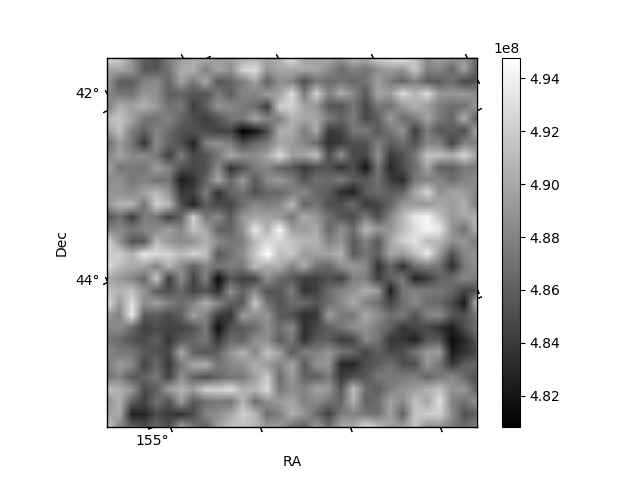
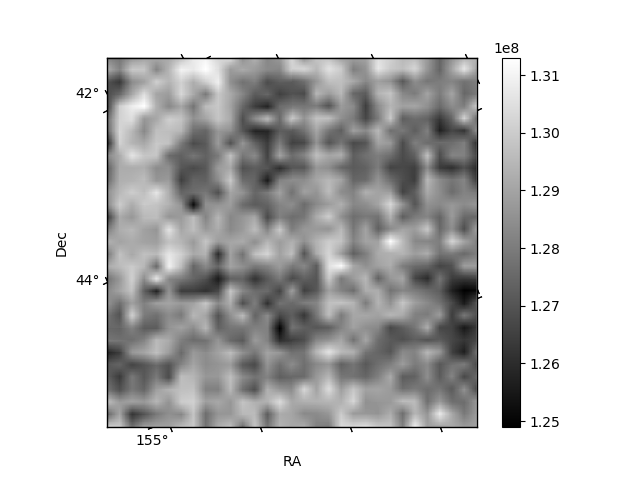
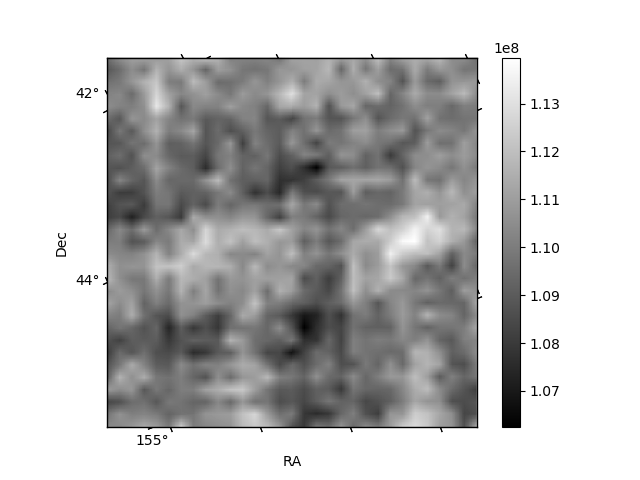
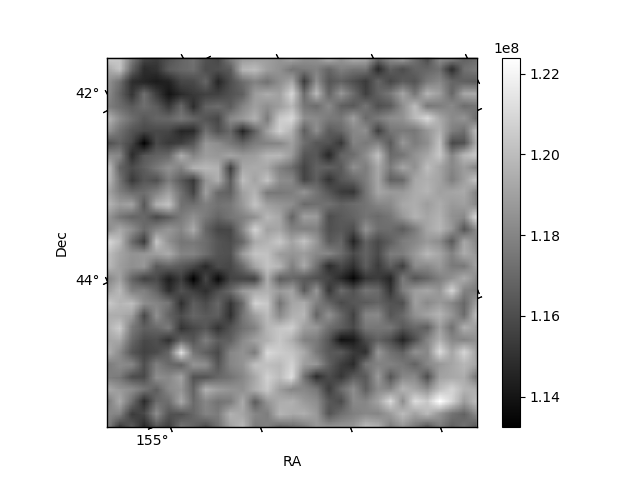
Histogram calculated using DETX and DETY for each event in the final _common_clean file
| Quadrant A | 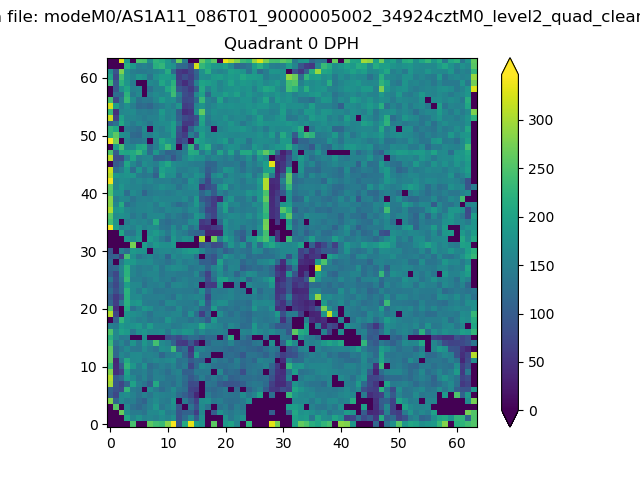 |
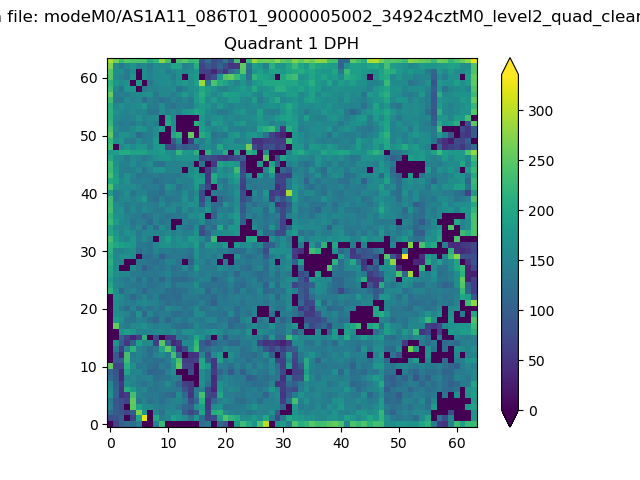 |
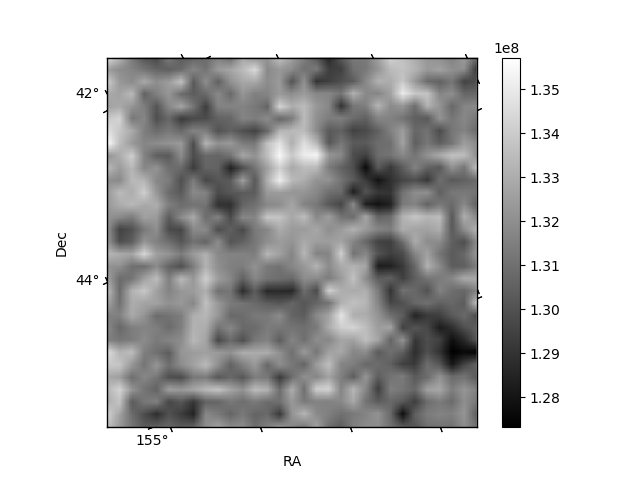
Quadrant B |
|---|---|---|---|
| Quadrant D | 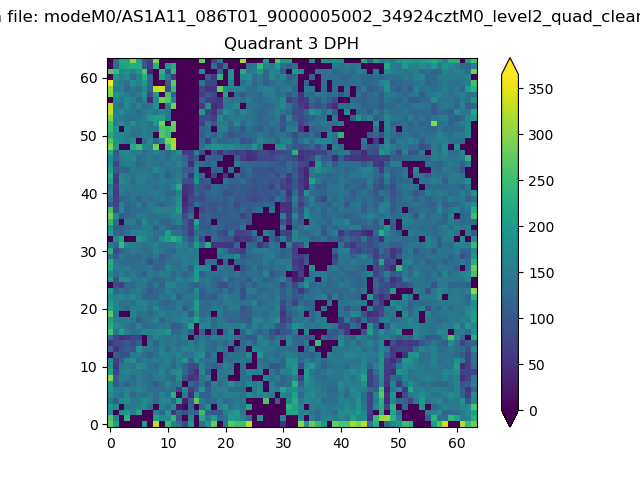 |
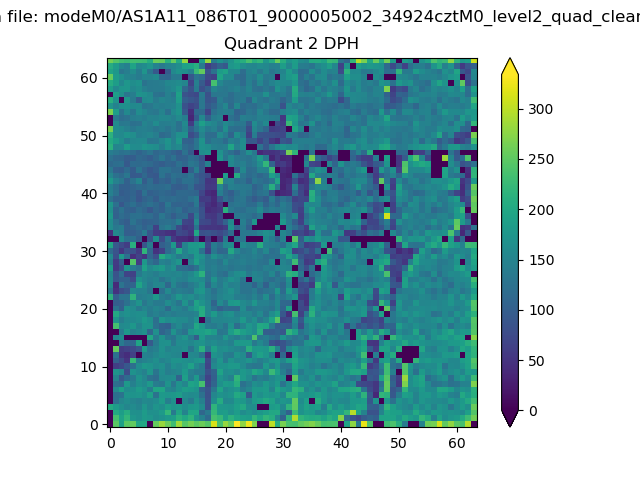 |
Quadrant C |
| Plot type | Count rate plots | Images |
|---|---|---|
| Comparison with Poisson distribution Blue bars denote a histogram of data divided into 1 sec bins. Red curve is a Poisson curve with rate = median count rate of data. |
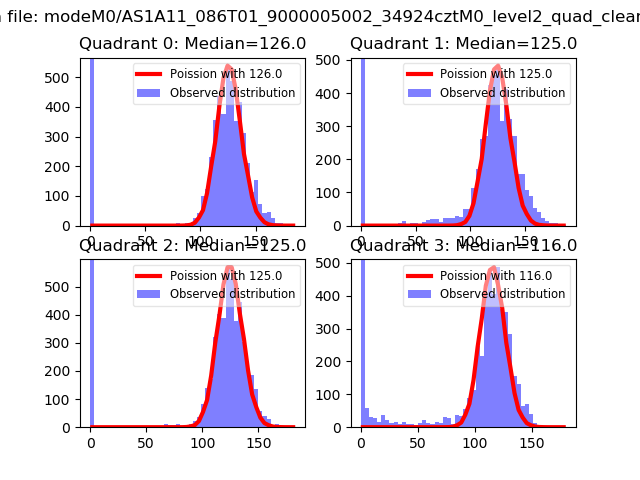 |
 |
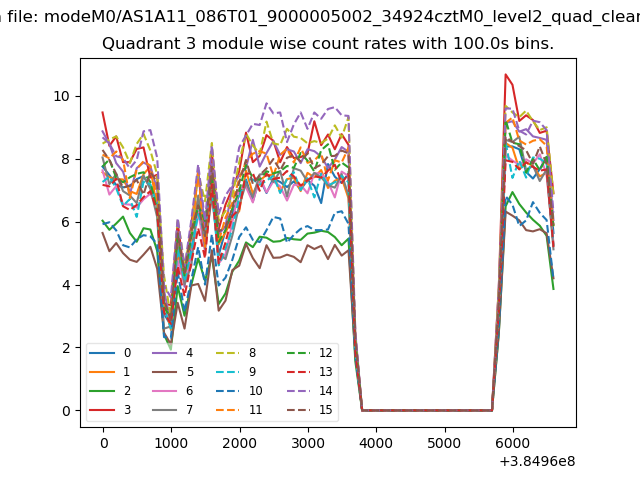
| Quadrant-wise count rates Data is divided into 100 sec bins |
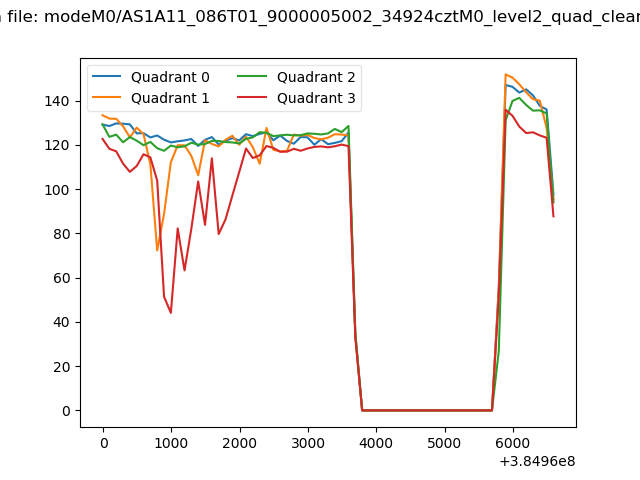 |
|
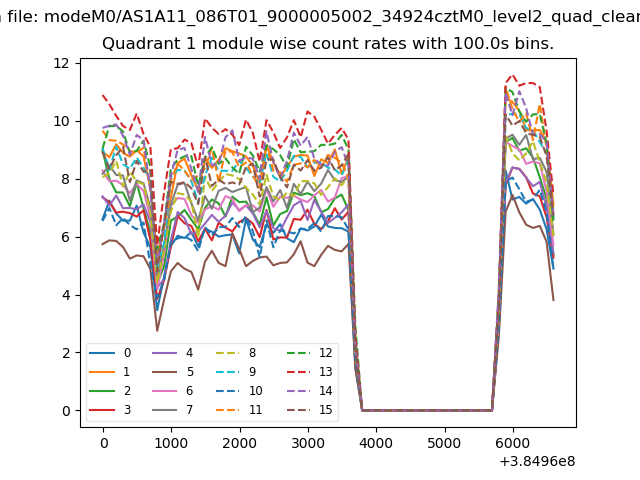
| Module-wise count rates for Quadrant A Data is divided into 100 sec bins |
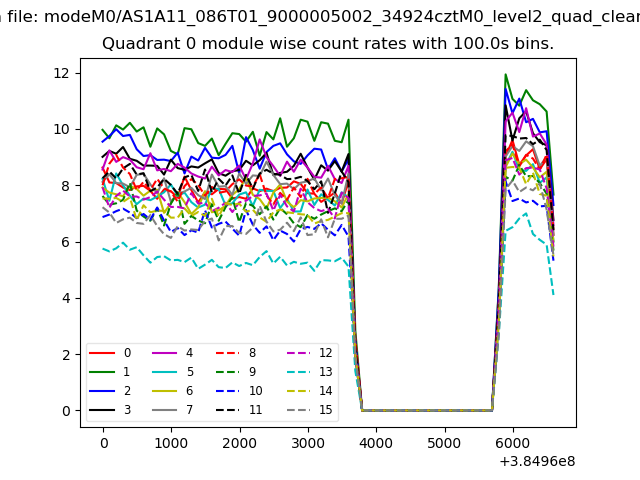 |
 |
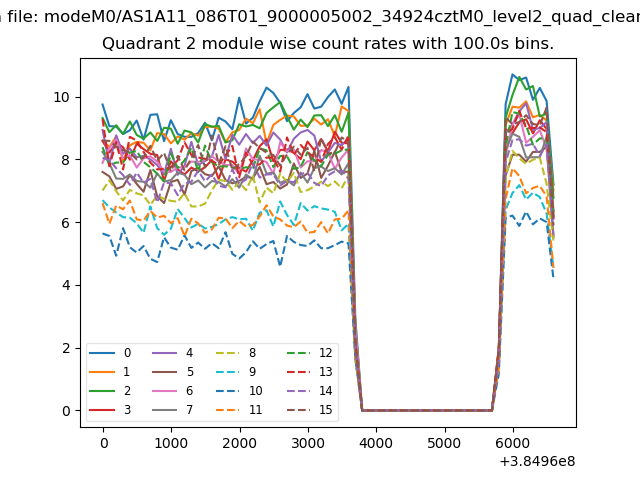
| Module-wise count rates for Quadrant B Data is divided into 100 sec bins |
 |
 |
| Module-wise count rates for Quadrant C Data is divided into 100 sec bins |
 |
 |
| Module-wise count rates for Quadrant D Data is divided into 100 sec bins |
 |
 |
| Parameter | Plot |
|---|---|
| CZT HV Monitor | 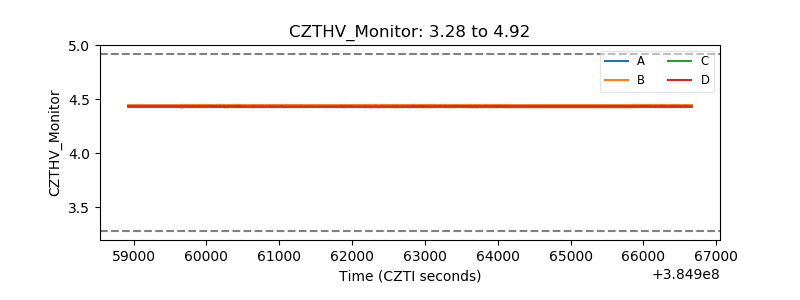 |
| D_VDD | 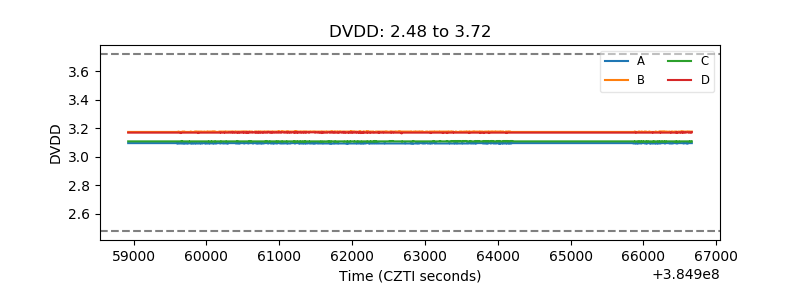 |
| Temperature 1 | 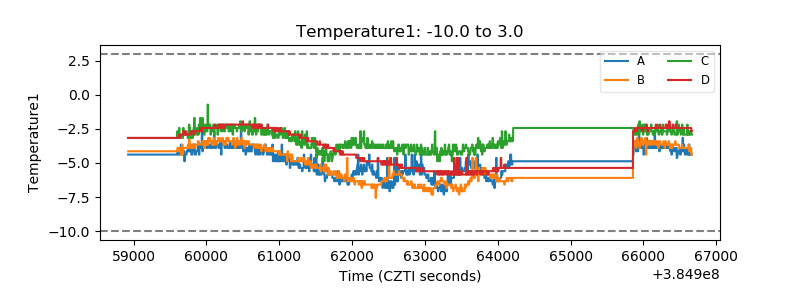 |
| Veto HV Monitor | 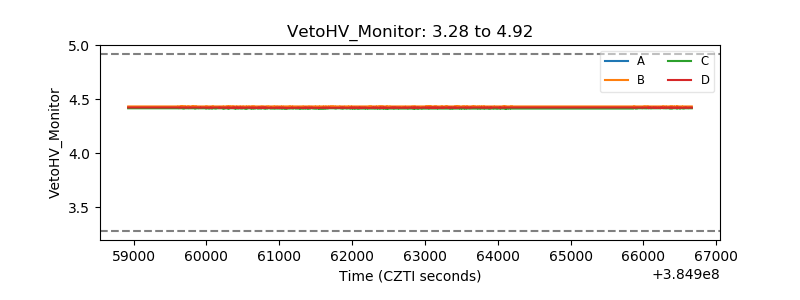 |
| Veto LLD | 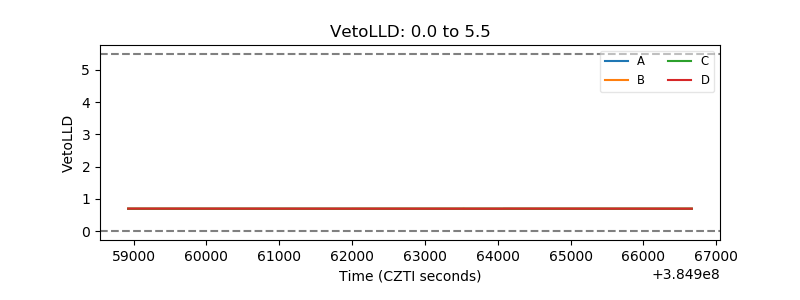 |
| Alpha Counter | 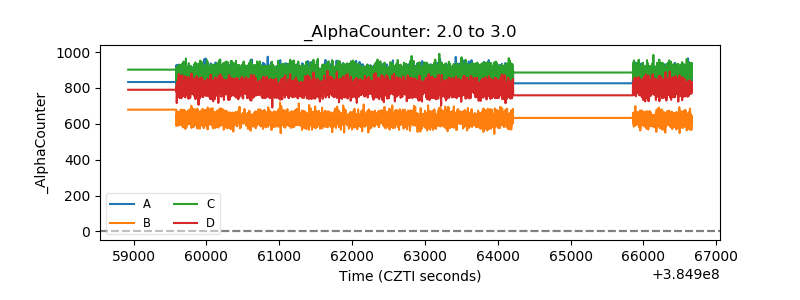 |
| _CPM_Rate | 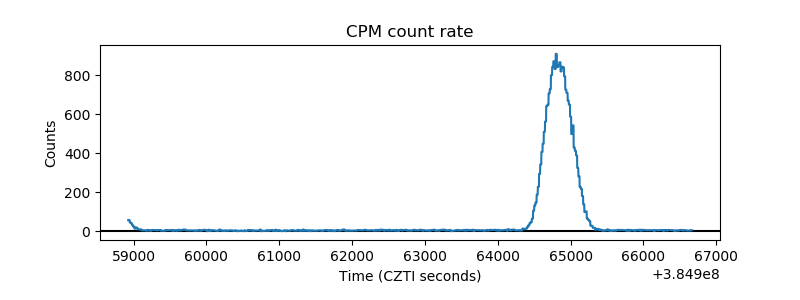 |
| CZT Counter | 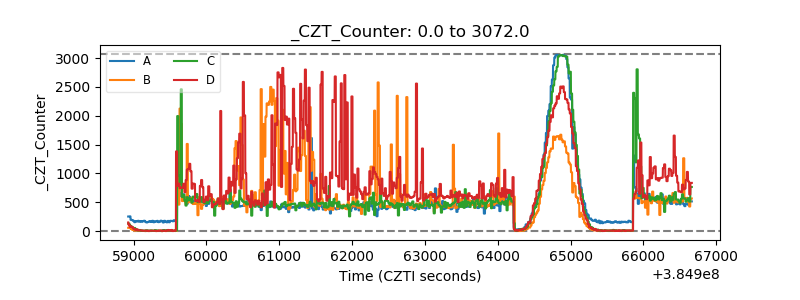 |
| +2.5 Volts monitor | 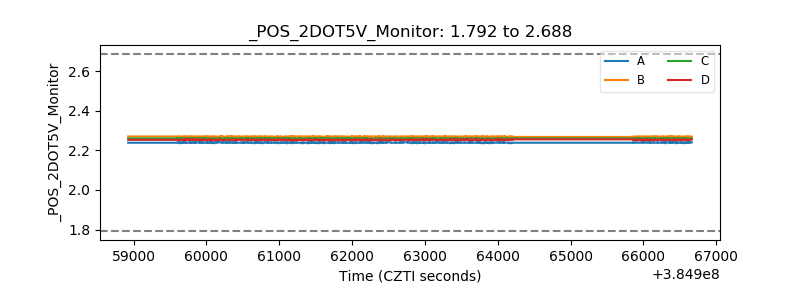 |
| +5 Volts monitor | 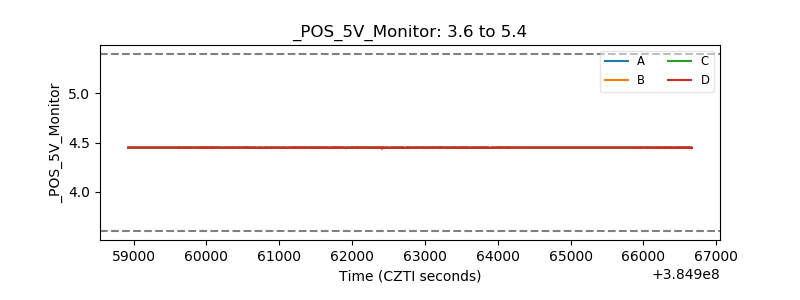 |
| _ROLL_ROT | 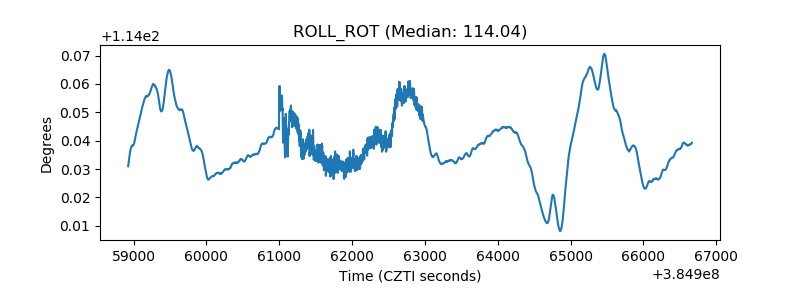 |
| _Roll_DEC | 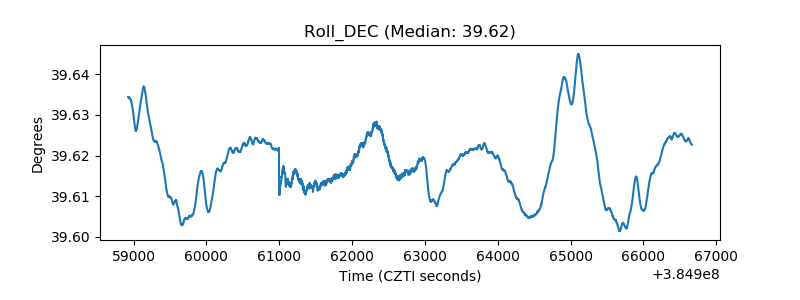 |
| _Roll_RA | 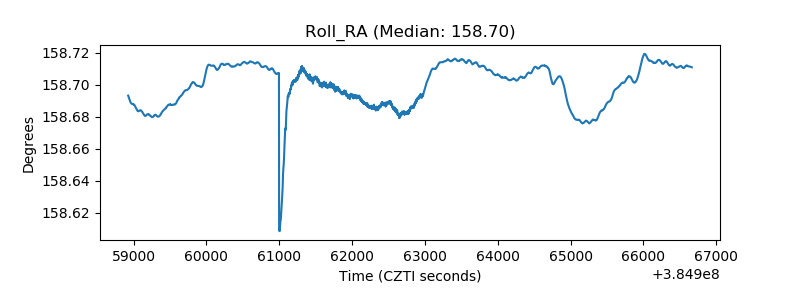 |
| Veto Counter | 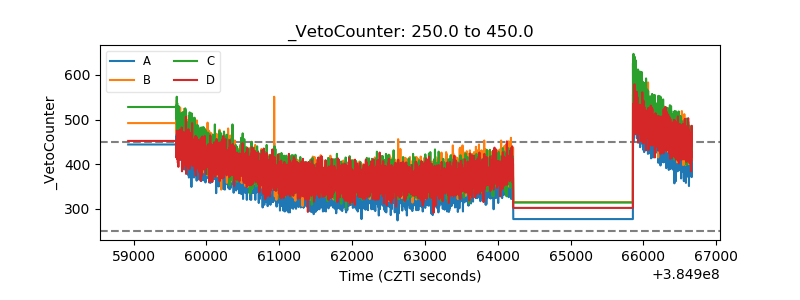 |