| Param | Original file | Final file |
|---|---|---|
| Filename | modeM0/AS1A11_086T01_9000005002_34916cztM0_level2.evt | modeM0/AS1A11_086T01_9000005002_34916cztM0_level2_quad_clean.evt |
| Size (bytes) | 400,331,520 | 62,176,320 |
| Size | 381.8 MB | 59.3 MB |
| Events in quadrant A | 2,449,639 | 388,290 |
| Events in quadrant B | 2,980,953 | 390,110 |
| Events in quadrant C | 2,715,097 | 388,404 |
| Events in quadrant D | 3,637,277 | 363,888 |
| Mode M9 | |||
|---|---|---|---|
| Quadrant | BADHDUFLAG | Total packets | Discarded packets |
| A | 0 | 30 | 0 |
| B | 0 | 30 | 0 |
| C | 0 | 30 | 0 |
| D | 0 | 31 | 0 |
| Mode SS | |||
|---|---|---|---|
| Quadrant | BADHDUFLAG | Total packets | Discarded packets |
| A | 0 | 102 | 0 |
| B | 0 | 102 | 0 |
| C | 0 | 102 | 0 |
| D | 0 | 102 | 0 |
| Mode M0 | |||
|---|---|---|---|
| Quadrant | BADHDUFLAG | Total packets | Discarded packets |
| A | 0 | 10589 | 3 |
| B | 0 | 12156 | 2 |
| C | 0 | 11042 | 2 |
| D | 0 | 14196 | 2 |
| Quadrant | Total seconds | Saturated seconds | Saturation percentage |
|---|---|---|---|
| A | 5018 | 5 | 0.099641% |
| B | 5018 | 179 | 3.567158% |
| C | 5018 | 88 | 1.753687% |
| D | 5018 | 178 | 3.547230% |
Noise dominated data is calculated using 1-second bins in cleaned event files. If a bin has >2000 counts, and if more than 50% of those come from <1% of pixels, then it is considered to be noise-dominated and hence unusable.
| Quadrant | # 1 sec bins | Bins with >0 counts | Bins with >2000 counts | High rate bins dominated by noise | Noise dominated (total time) | Noise dominated (detector-on time) | Marked lightcurve |
|---|---|---|---|---|---|---|---|
| A | 7111 | 5019 | 0 | 0 | 0.00% | 0.00% | 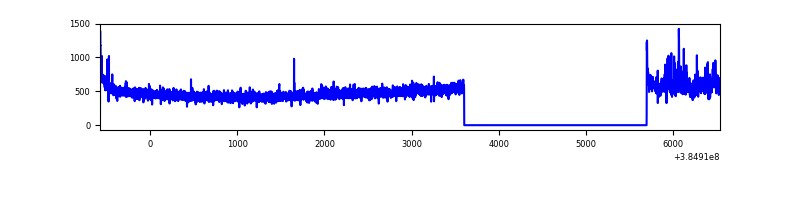 |
| B | 7111 | 5018 | 137 | 137 | 1.93% | 2.73% | 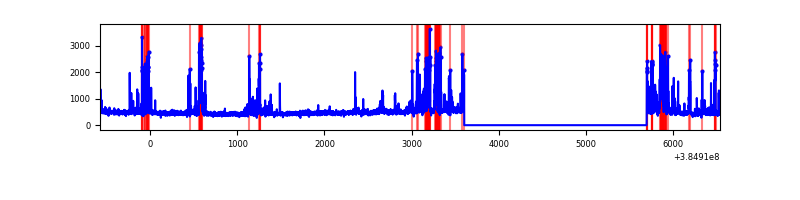 |
| C | 7111 | 5019 | 80 | 80 | 1.13% | 1.59% | 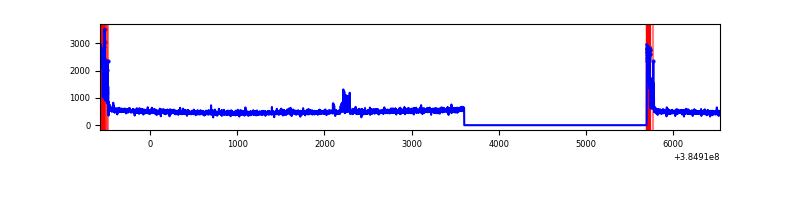 |
| D | 7111 | 5019 | 166 | 166 | 2.33% | 3.31% | 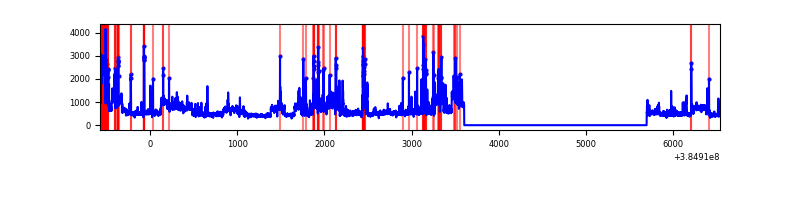 |
Top three noisy pixels from each quadrant. If the there are fewer than three noisy pixels in the level2.evt file, extra rows are filled as -1
| Pixel properties | Quadrant properties | ||||||
|---|---|---|---|---|---|---|---|
| Quadrant | DetID | PixID | Counts | Sigma | Mean | Median | Sigma |
| A | 15 | 169 | 130580 | 1123.87 | 580 | 570 | 115.7 |
| A | 10 | 83 | 59407 | 508.62 | 580 | 570 | 115.7 |
| A | 13 | 6 | 10161 | 82.91 | 580 | 570 | 115.7 |
| B | 5 | 172 | 697753 | 6416.23 | 572 | 559 | 108.7 |
| B | 12 | 111 | 13553 | 119.58 | 572 | 559 | 108.7 |
| B | 11 | 111 | 12275 | 107.82 | 572 | 559 | 108.7 |
| C | 0 | 10 | 264120 | 2021.11 | 564 | 568 | 130.4 |
| C | 15 | 214 | 211027 | 1613.96 | 564 | 568 | 130.4 |
| C | 8 | 111 | 32030 | 241.27 | 564 | 568 | 130.4 |
| D | 8 | 195 | 741546 | 5511.79 | 552 | 538 | 134.4 |
| D | 13 | 249 | 242453 | 1799.42 | 552 | 538 | 134.4 |
| D | 1 | 47 | 92772 | 686.06 | 552 | 538 | 134.4 |
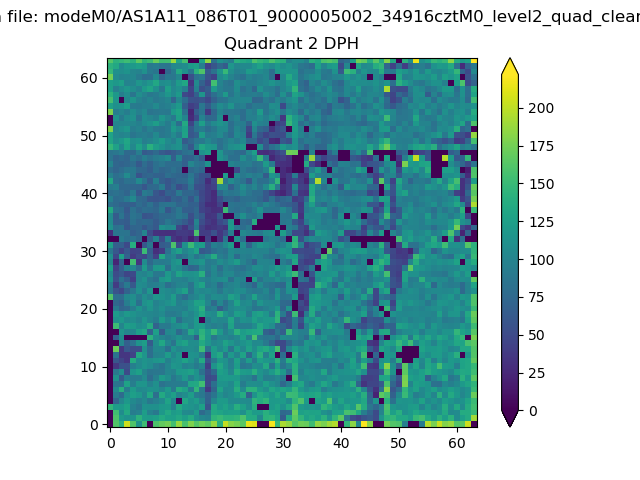
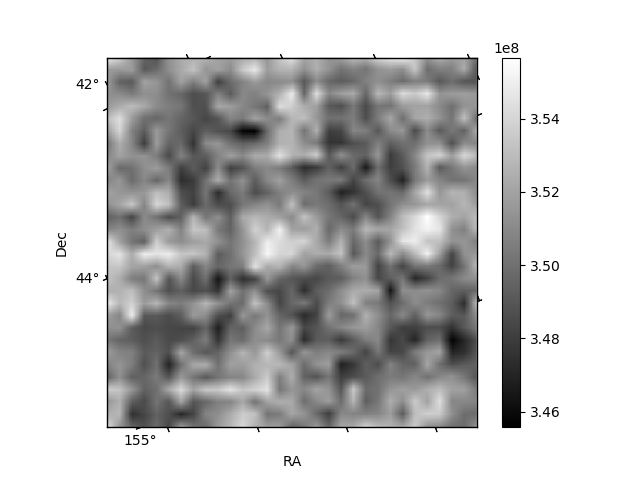
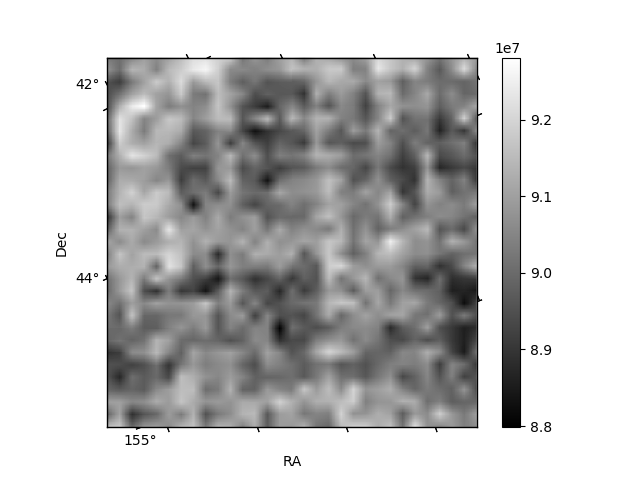
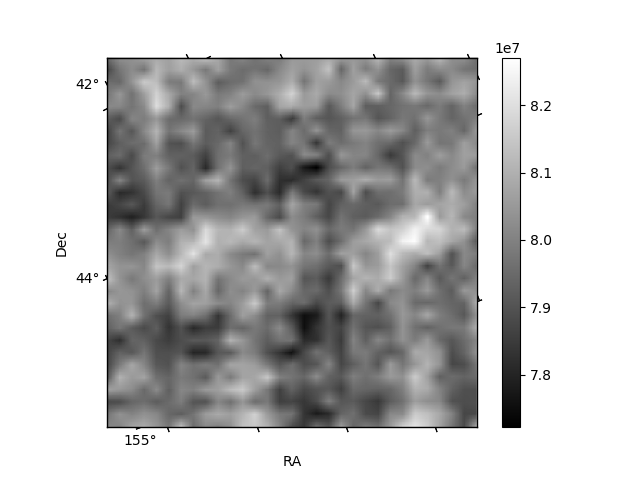
Histogram calculated using DETX and DETY for each event in the final _common_clean file
| Quadrant A | 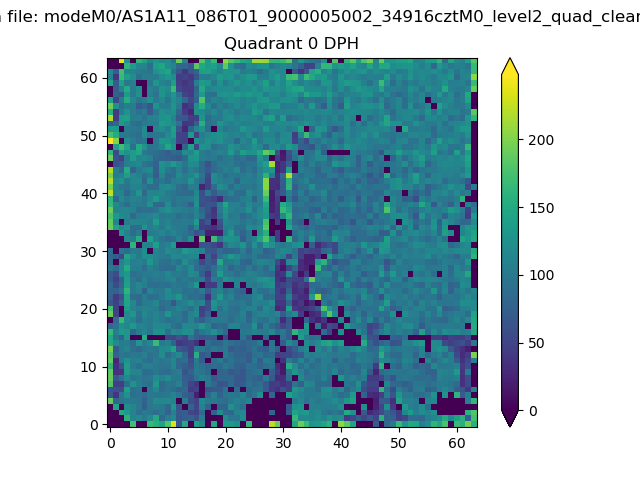 |
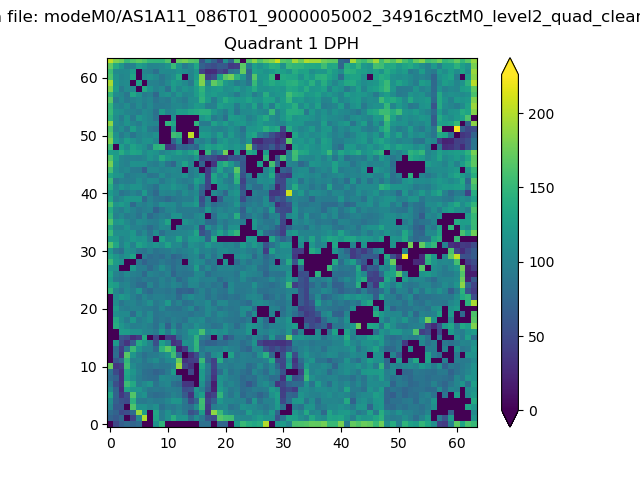 |
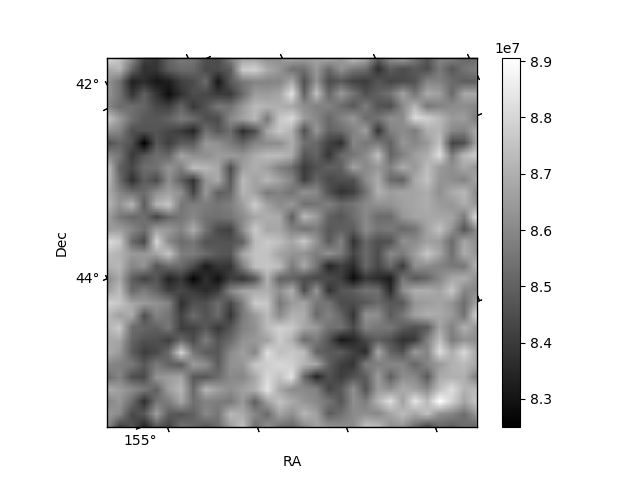
Quadrant B |
|---|---|---|---|
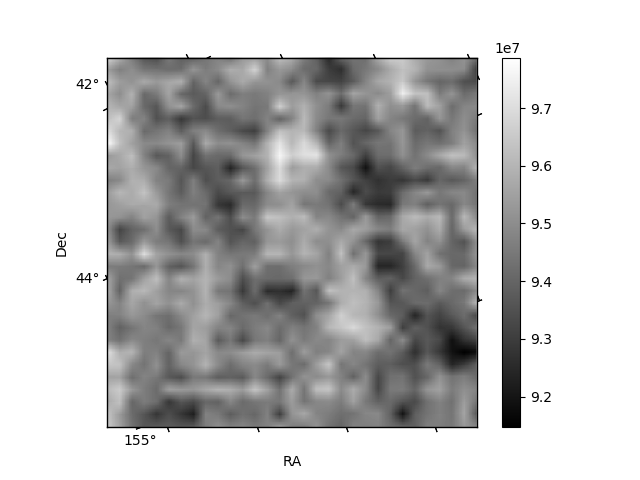
| Quadrant D | 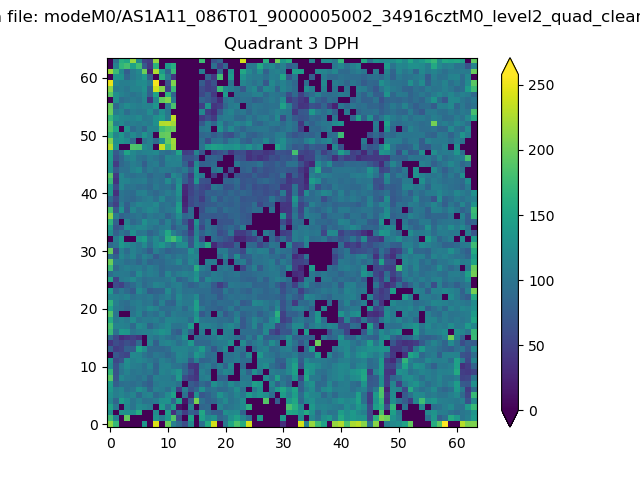 |
 |
Quadrant C |
| Plot type | Count rate plots | Images |
|---|---|---|
| Comparison with Poisson distribution Blue bars denote a histogram of data divided into 1 sec bins. Red curve is a Poisson curve with rate = median count rate of data. |
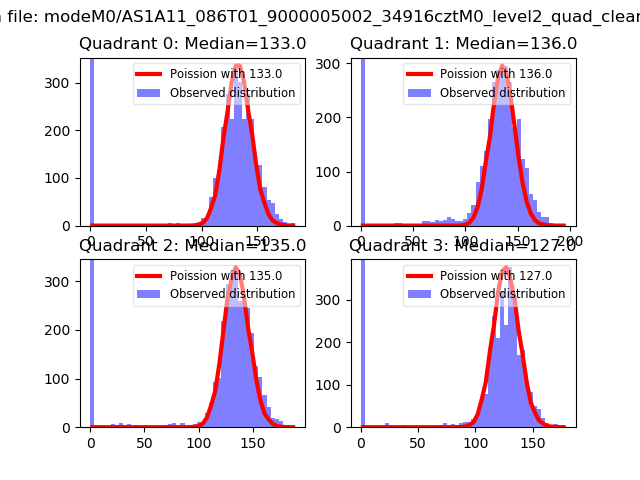 |
 |
| Quadrant-wise count rates Data is divided into 100 sec bins |
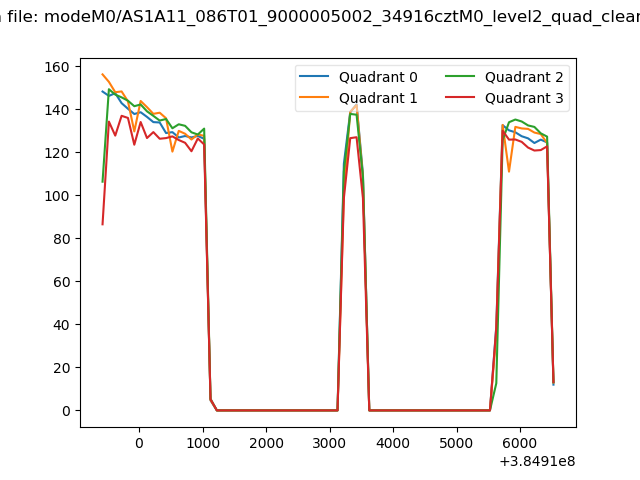 |
|
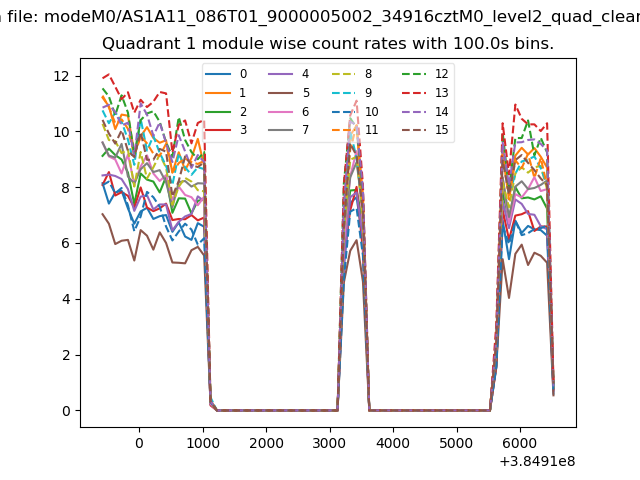
| Module-wise count rates for Quadrant A Data is divided into 100 sec bins |
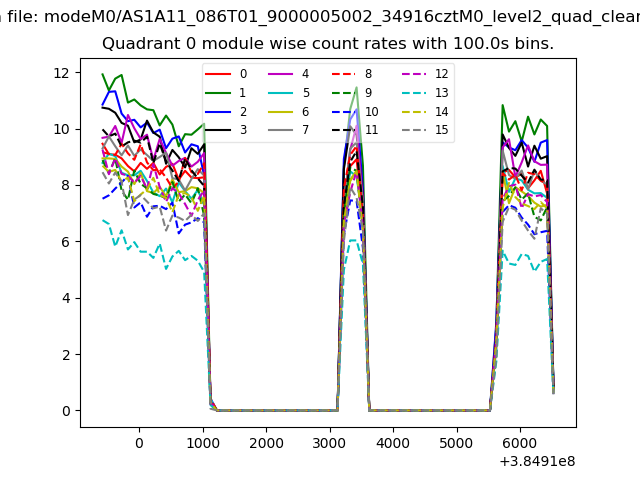 |
 |
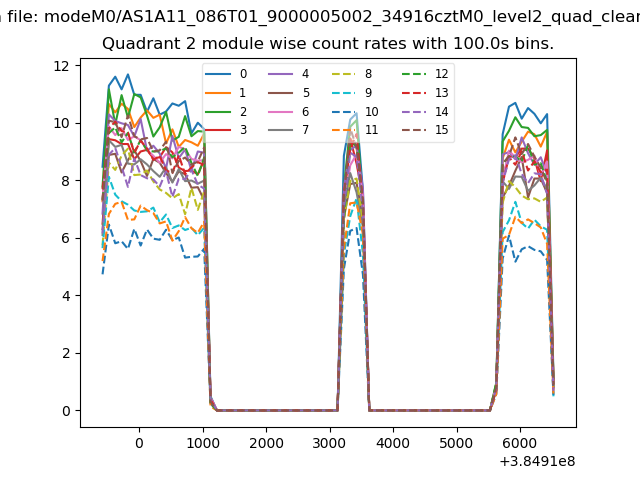
| Module-wise count rates for Quadrant B Data is divided into 100 sec bins |
 |
 |
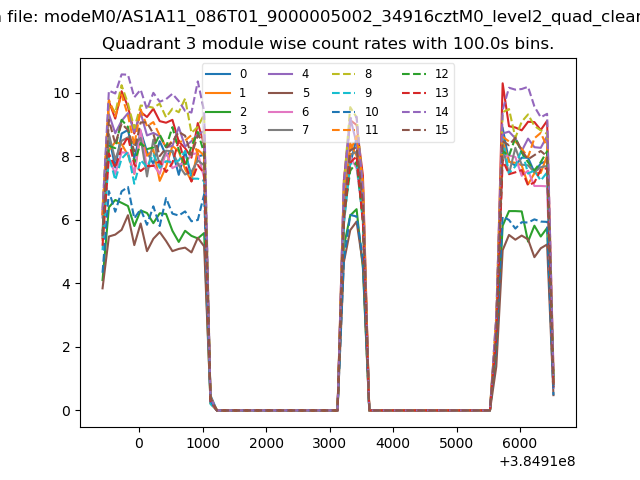
| Module-wise count rates for Quadrant C Data is divided into 100 sec bins |
 |
 |
| Module-wise count rates for Quadrant D Data is divided into 100 sec bins |
 |
 |
| Parameter | Plot |
|---|---|
| CZT HV Monitor | 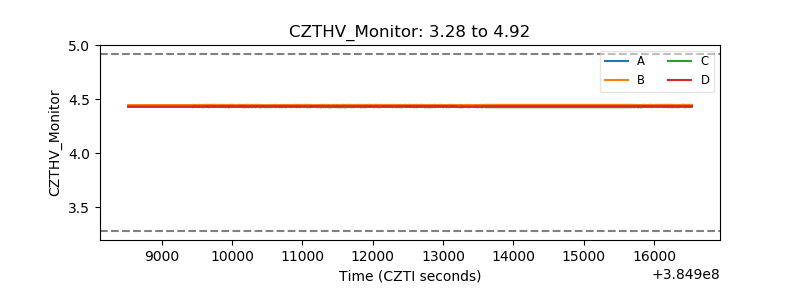 |
| D_VDD | 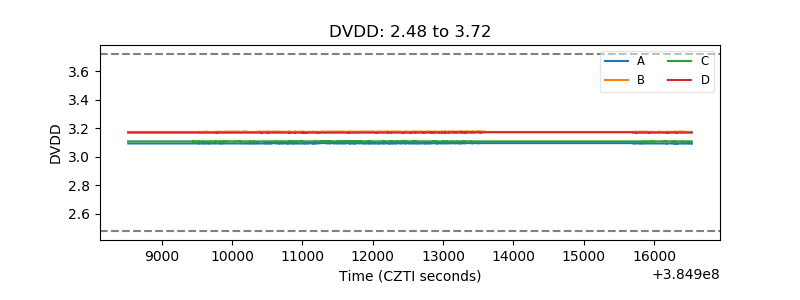 |
| Temperature 1 | 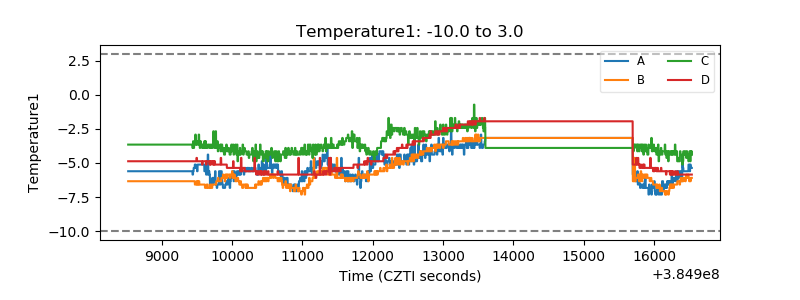 |
| Veto HV Monitor | 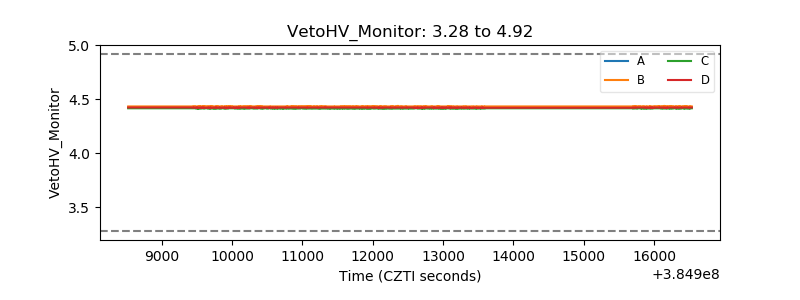 |
| Veto LLD | 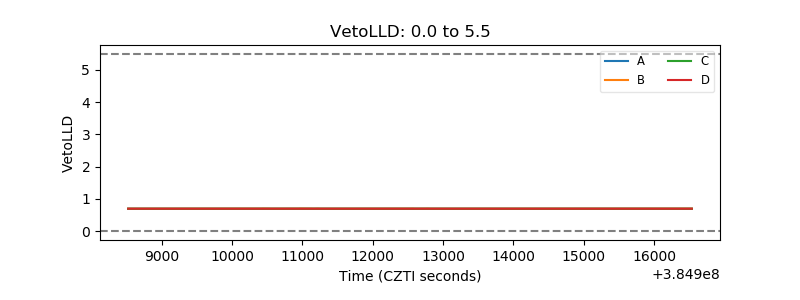 |
| Alpha Counter | 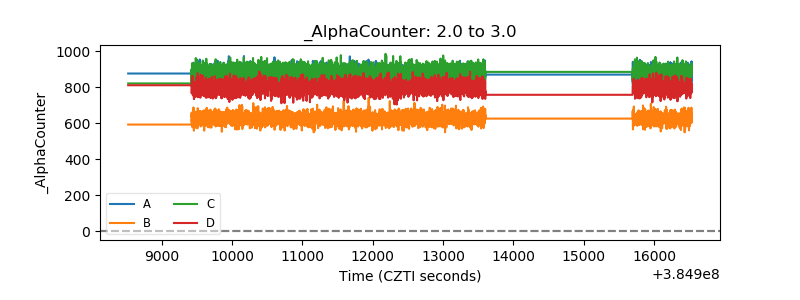 |
| _CPM_Rate | 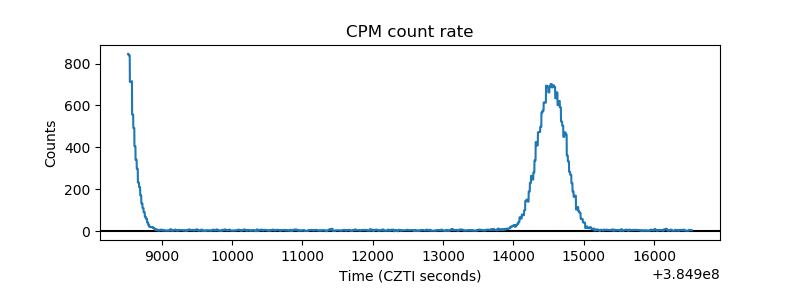 |
| CZT Counter | 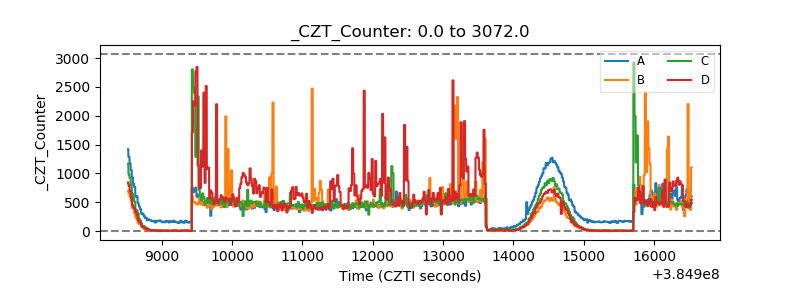 |
| +2.5 Volts monitor | 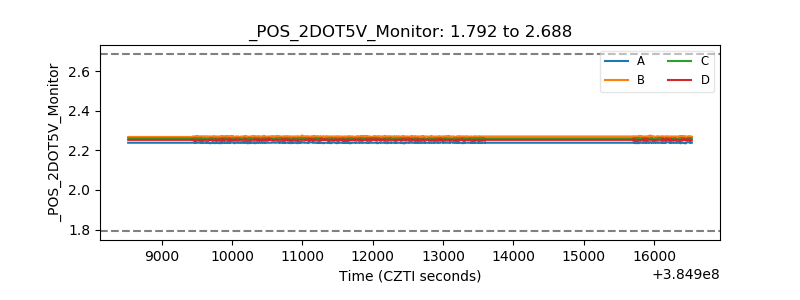 |
| +5 Volts monitor | 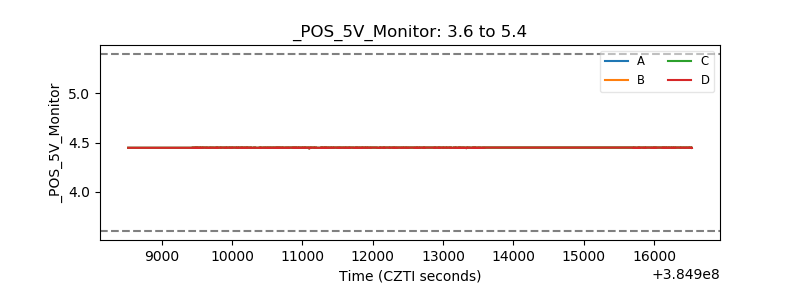 |
| _ROLL_ROT | 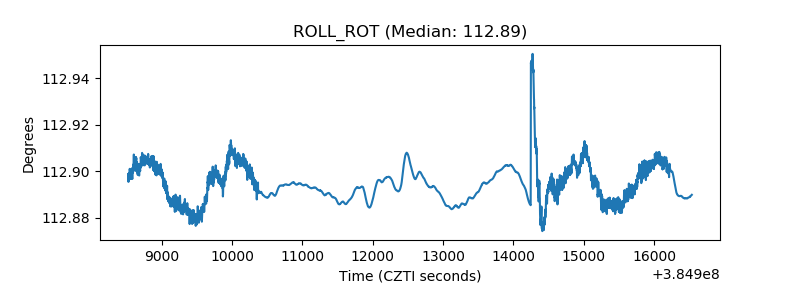 |
| _Roll_DEC | 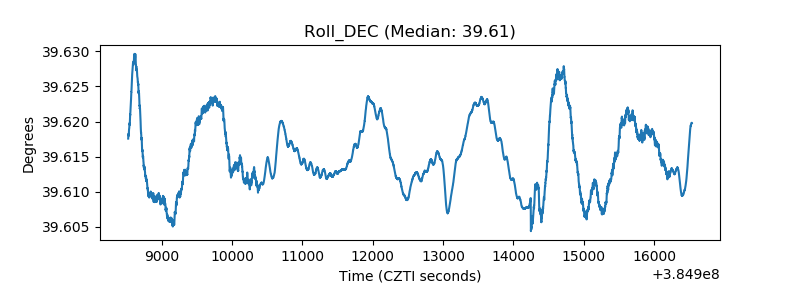 |
| _Roll_RA | 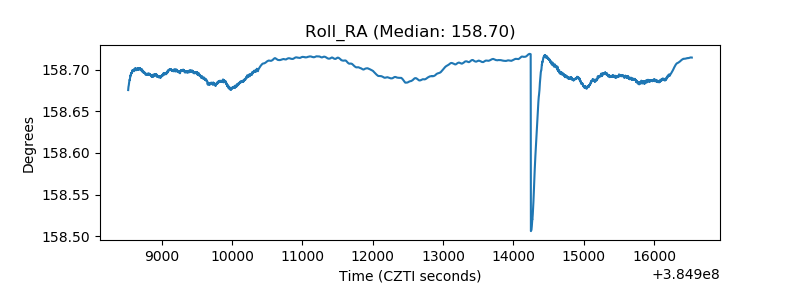 |
| Veto Counter | 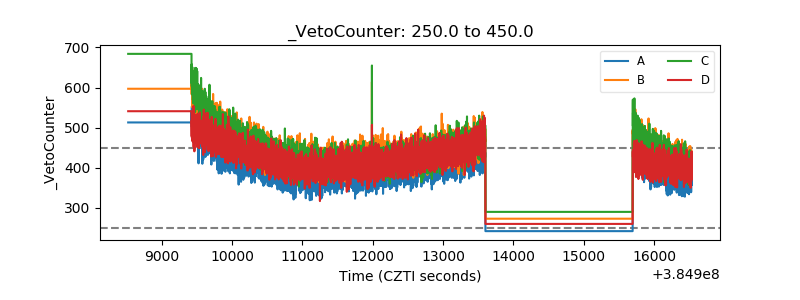 |