| Param | Original file | Final file |
|---|---|---|
| Filename | modeM0/AS1A11_086T01_9000005002_34915cztM0_level2.evt | modeM0/AS1A11_086T01_9000005002_34915cztM0_level2_quad_clean.evt |
| Size (bytes) | 450,803,520 | 62,717,760 |
| Size | 429.9 MB | 59.8 MB |
| Events in quadrant A | 2,329,065 | 405,429 |
| Events in quadrant B | 3,584,452 | 394,092 |
| Events in quadrant C | 2,710,511 | 408,973 |
| Events in quadrant D | 4,696,971 | 347,401 |
| Mode M9 | |||
|---|---|---|---|
| Quadrant | BADHDUFLAG | Total packets | Discarded packets |
| A | 0 | 35 | 0 |
| B | 0 | 35 | 0 |
| C | 0 | 35 | 0 |
| D | 0 | 36 | 0 |
| Mode SS | |||
|---|---|---|---|
| Quadrant | BADHDUFLAG | Total packets | Discarded packets |
| A | 0 | 98 | 0 |
| B | 0 | 98 | 0 |
| C | 0 | 98 | 0 |
| D | 0 | 98 | 0 |
| Mode M0 | |||
|---|---|---|---|
| Quadrant | BADHDUFLAG | Total packets | Discarded packets |
| A | 0 | 10024 | 3 |
| B | 0 | 13741 | 2 |
| C | 0 | 10844 | 2 |
| D | 0 | 17221 | 2 |
| Quadrant | Total seconds | Saturated seconds | Saturation percentage |
|---|---|---|---|
| A | 4890 | 6 | 0.122699% |
| B | 4890 | 440 | 8.997955% |
| C | 4890 | 82 | 1.676892% |
| D | 4890 | 501 | 10.245399% |
Noise dominated data is calculated using 1-second bins in cleaned event files. If a bin has >2000 counts, and if more than 50% of those come from <1% of pixels, then it is considered to be noise-dominated and hence unusable.
| Quadrant | # 1 sec bins | Bins with >0 counts | Bins with >2000 counts | High rate bins dominated by noise | Noise dominated (total time) | Noise dominated (detector-on time) | Marked lightcurve |
|---|---|---|---|---|---|---|---|
| A | 7013 | 4891 | 0 | 0 | 0.00% | 0.00% | 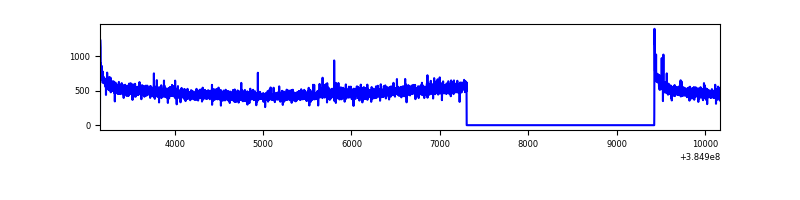 |
| B | 7013 | 4891 | 373 | 373 | 5.32% | 7.63% | 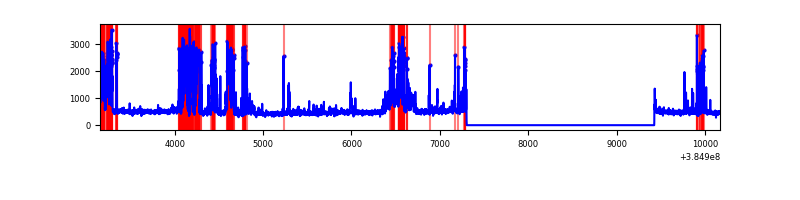 |
| C | 7013 | 4891 | 75 | 75 | 1.07% | 1.53% | 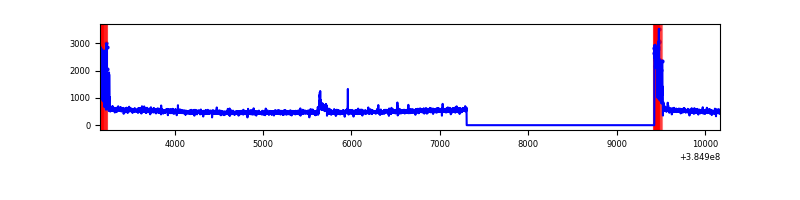 |
| D | 7013 | 4891 | 521 | 521 | 7.43% | 10.65% | 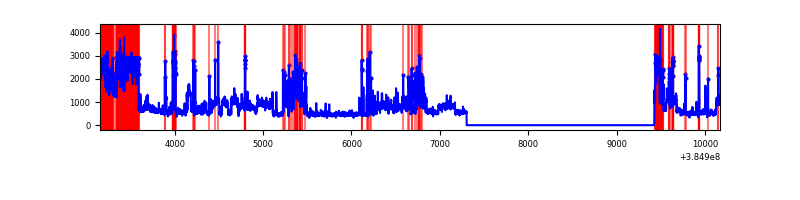 |
Top three noisy pixels from each quadrant. If the there are fewer than three noisy pixels in the level2.evt file, extra rows are filled as -1
| Pixel properties | Quadrant properties | ||||||
|---|---|---|---|---|---|---|---|
| Quadrant | DetID | PixID | Counts | Sigma | Mean | Median | Sigma |
| A | 10 | 83 | 58968 | 500.22 | 579 | 569 | 116.7 |
| A | 13 | 6 | 21174 | 176.49 | 579 | 569 | 116.7 |
| A | 13 | 254 | 8105 | 64.55 | 579 | 569 | 116.7 |
| B | 5 | 172 | 1294643 | 12264.81 | 558 | 545 | 105.5 |
| B | 4 | 171 | 38679 | 361.41 | 558 | 545 | 105.5 |
| B | 15 | 85 | 21483 | 198.44 | 558 | 545 | 105.5 |
| C | 0 | 10 | 258268 | 1964.12 | 568 | 573 | 131.2 |
| C | 15 | 214 | 206895 | 1572.56 | 568 | 573 | 131.2 |
| C | 8 | 79 | 27935 | 208.55 | 568 | 573 | 131.2 |
| D | 7 | 223 | 1249423 | 9643.27 | 533 | 519 | 129.5 |
| D | 8 | 195 | 838524 | 6470.56 | 533 | 519 | 129.5 |
| D | 13 | 249 | 314395 | 2423.56 | 533 | 519 | 129.5 |
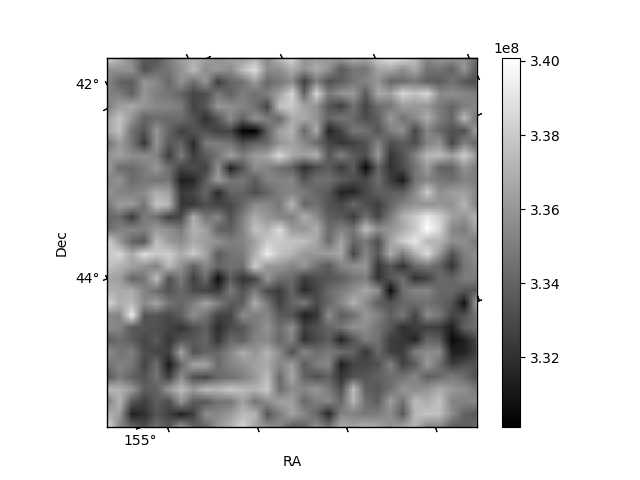
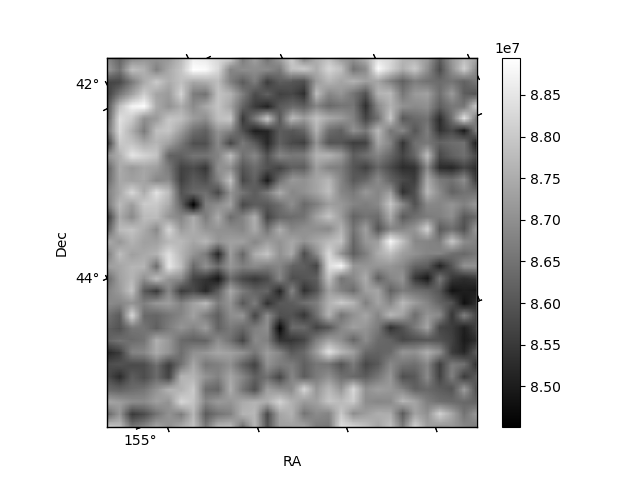
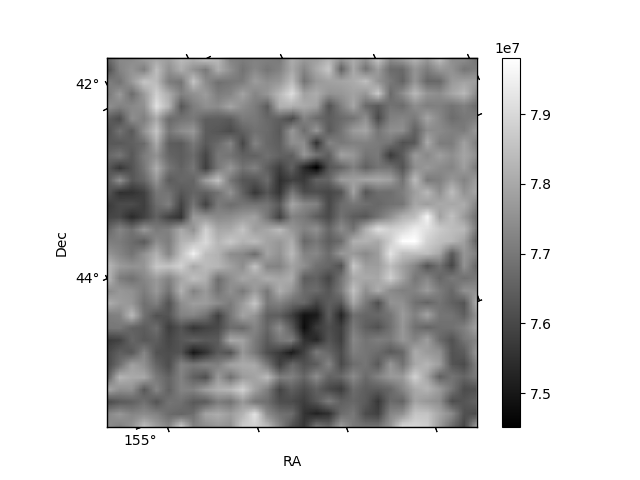
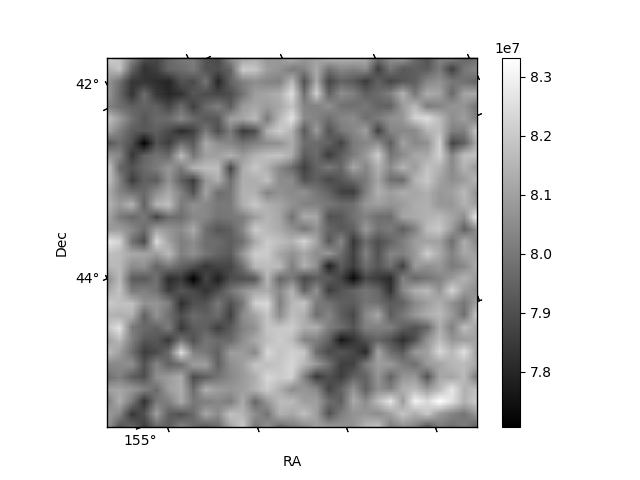
Histogram calculated using DETX and DETY for each event in the final _common_clean file
| Quadrant A | 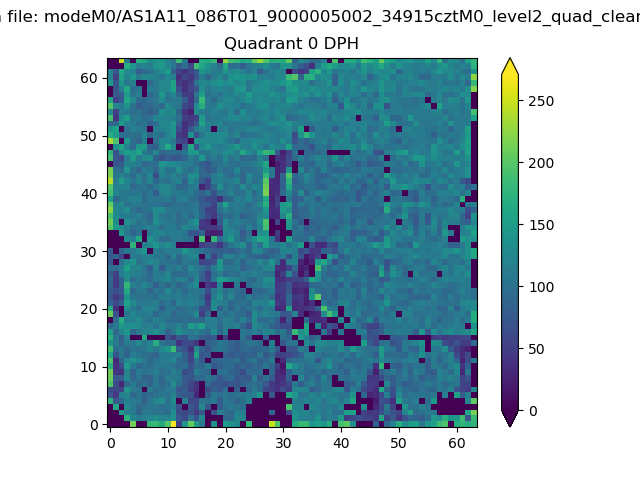 |
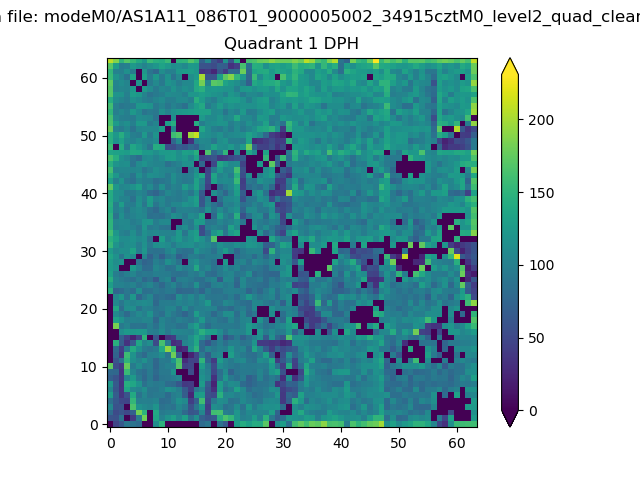 |
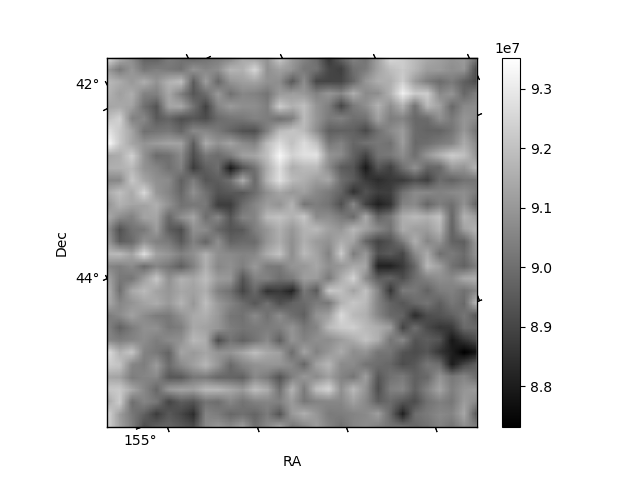
Quadrant B |
|---|---|---|---|
| Quadrant D | 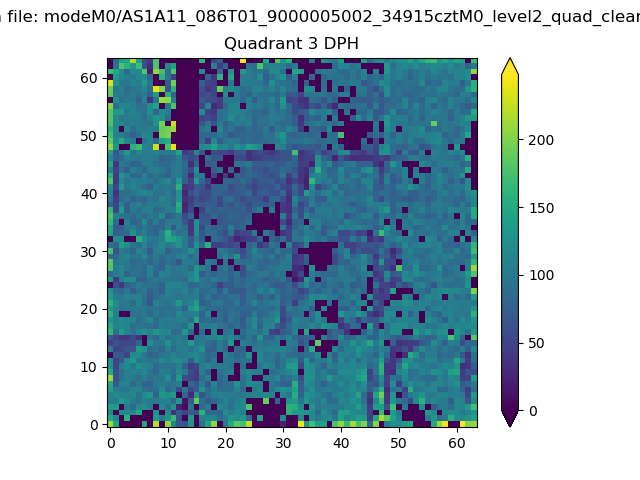 |
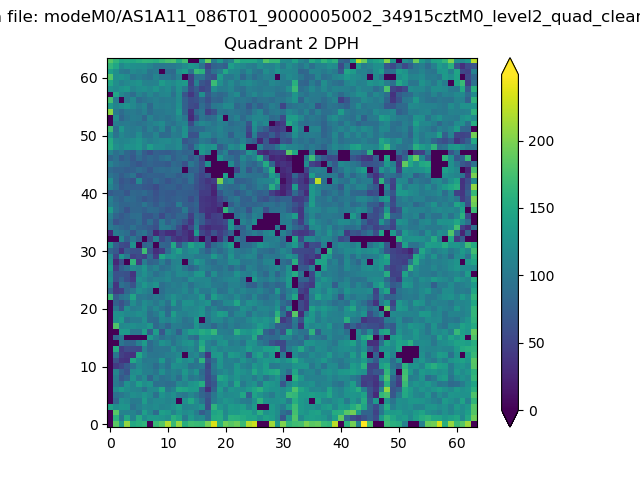 |
Quadrant C |
| Plot type | Count rate plots | Images |
|---|---|---|
| Comparison with Poisson distribution Blue bars denote a histogram of data divided into 1 sec bins. Red curve is a Poisson curve with rate = median count rate of data. |
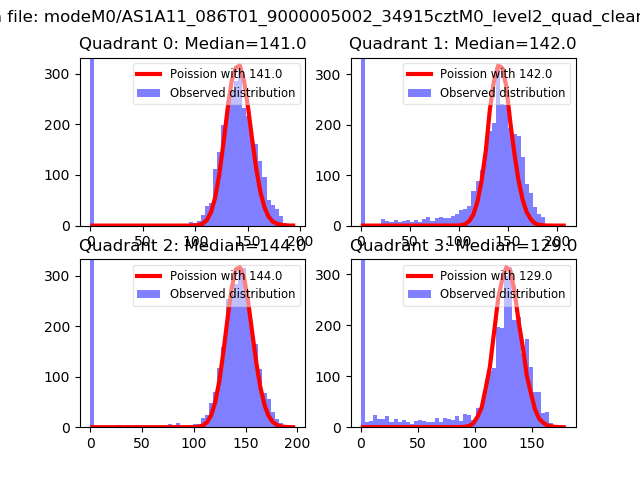 |
 |
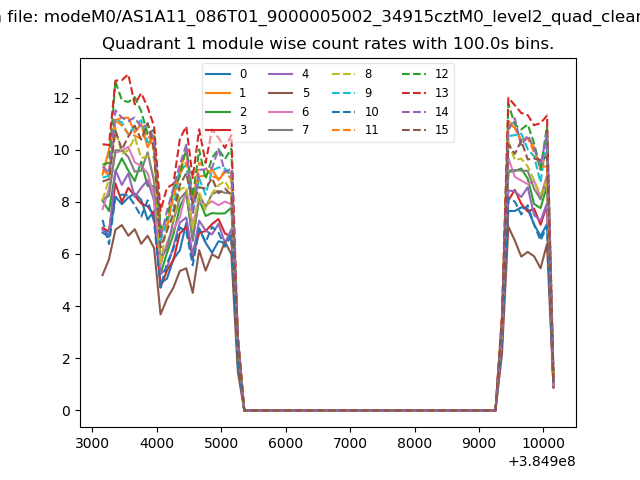
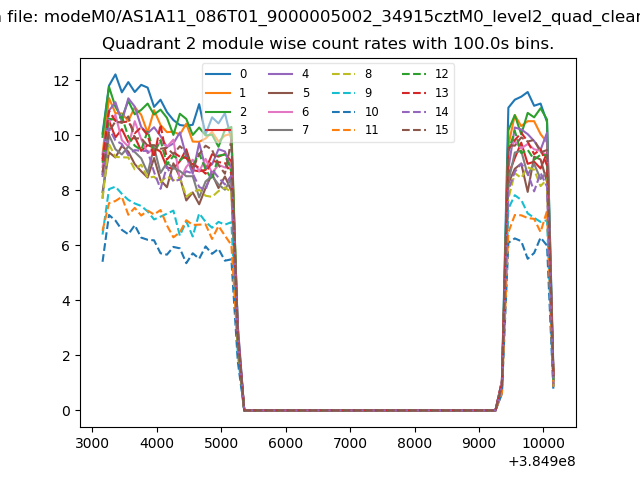
| Quadrant-wise count rates Data is divided into 100 sec bins |
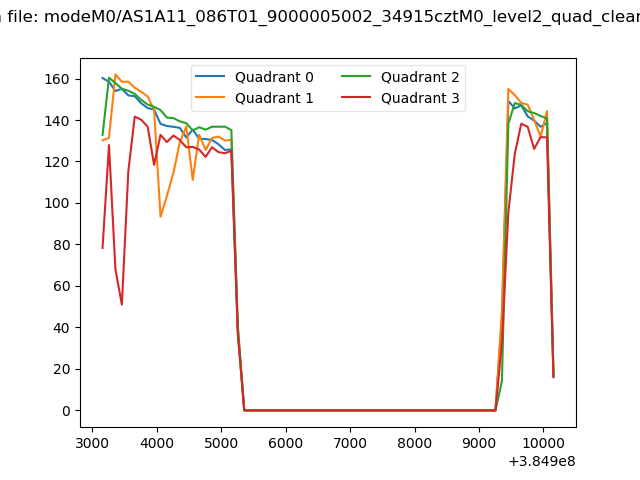 |
|
| Module-wise count rates for Quadrant A Data is divided into 100 sec bins |
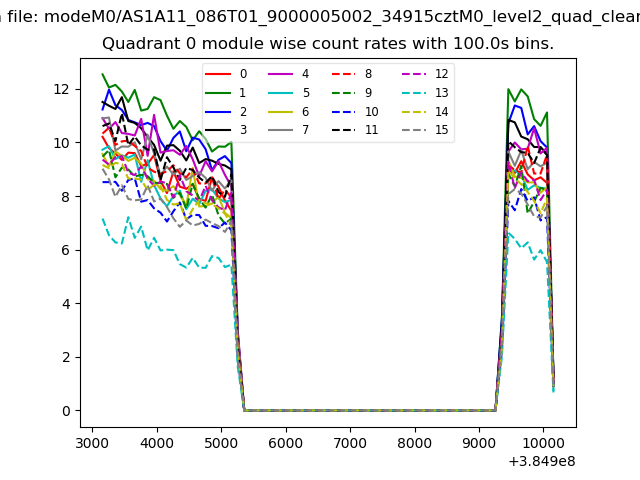 |
 |
| Module-wise count rates for Quadrant B Data is divided into 100 sec bins |
 |
 |
| Module-wise count rates for Quadrant C Data is divided into 100 sec bins |
 |
 |
| Module-wise count rates for Quadrant D Data is divided into 100 sec bins |
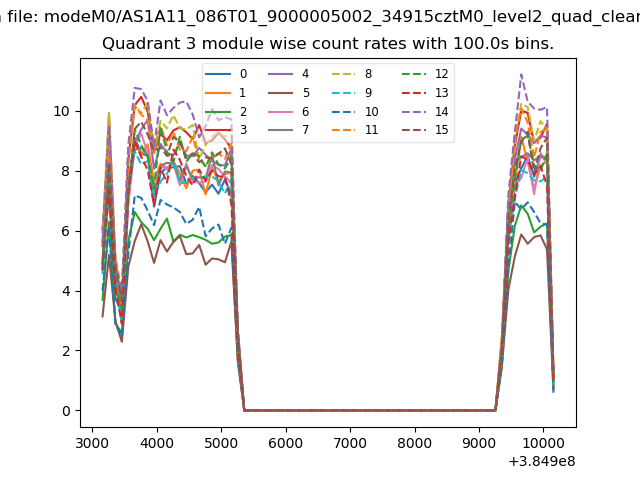 |
 |
| Parameter | Plot |
|---|---|
| CZT HV Monitor | 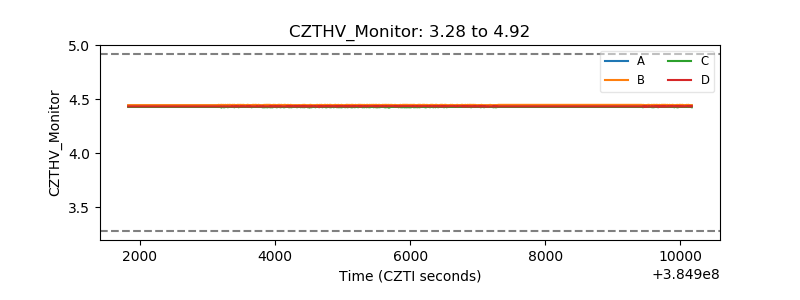 |
| D_VDD | 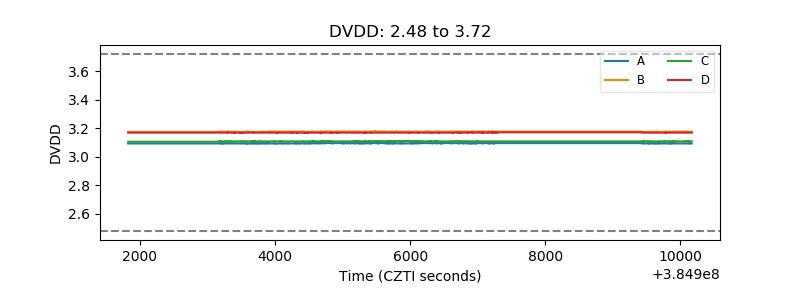 |
| Temperature 1 | 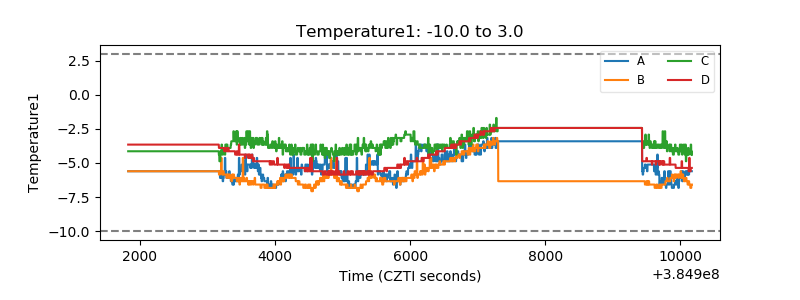 |
| Veto HV Monitor | 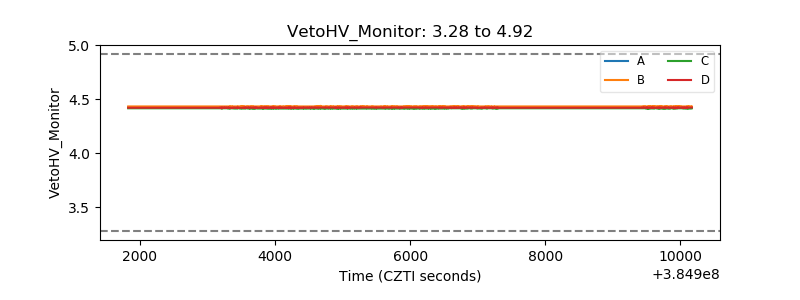 |
| Veto LLD | 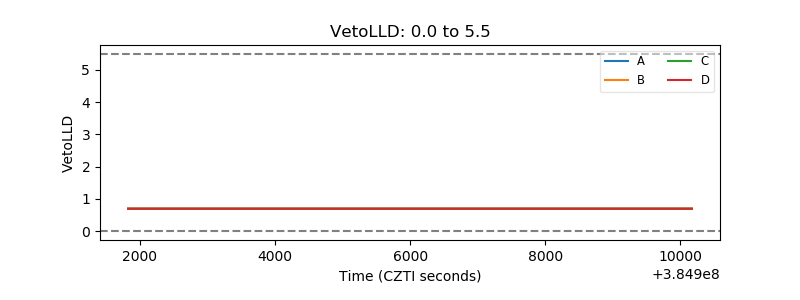 |
| Alpha Counter | 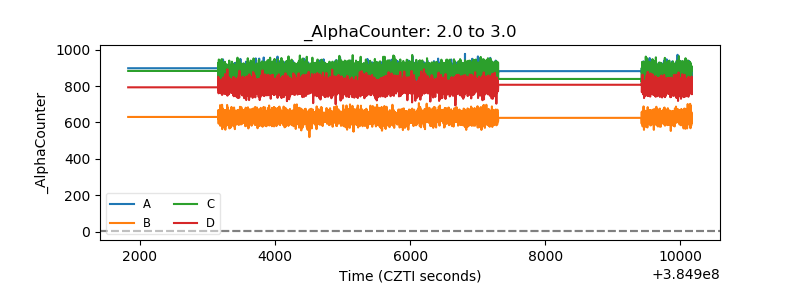 |
| _CPM_Rate | 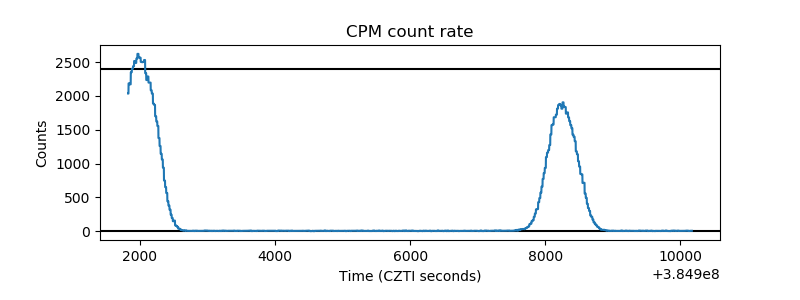 |
| CZT Counter | 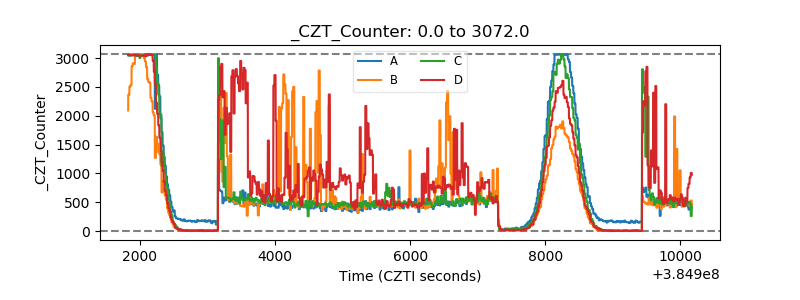 |
| +2.5 Volts monitor | 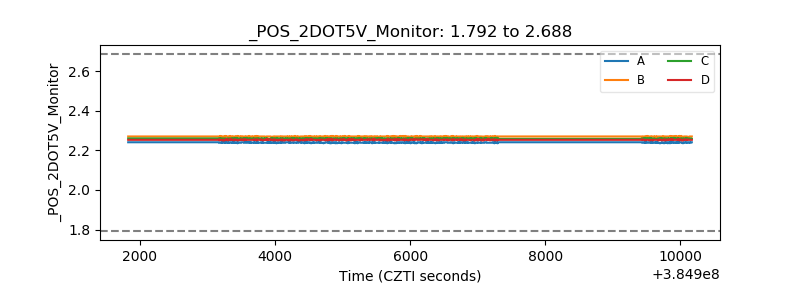 |
| +5 Volts monitor | 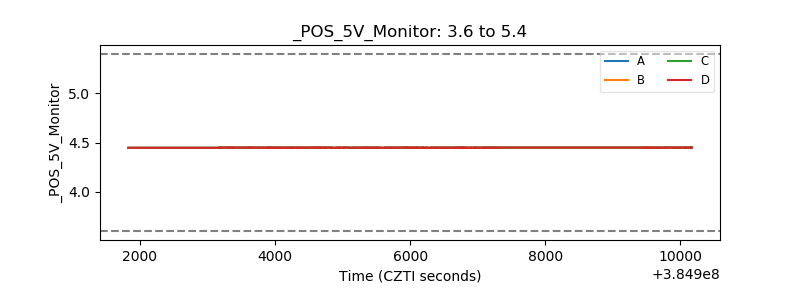 |
| _ROLL_ROT | 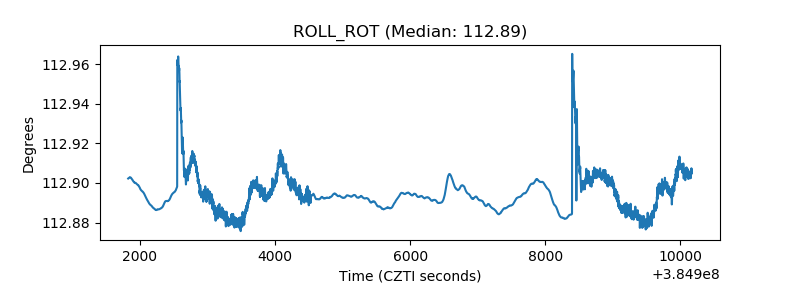 |
| _Roll_DEC | 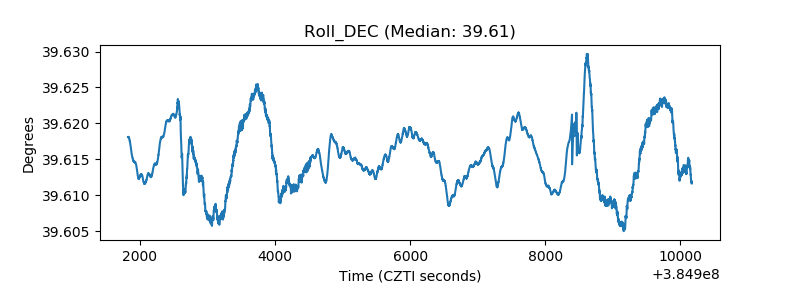 |
| _Roll_RA | 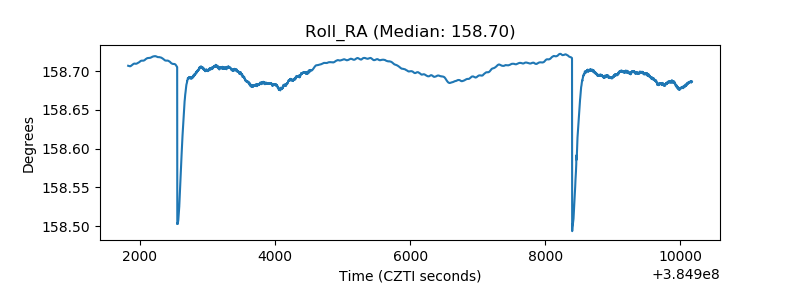 |
| Veto Counter | 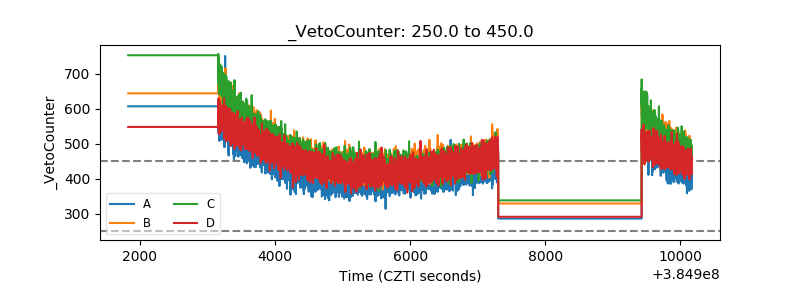 |