| Param | Original file | Final file |
|---|---|---|
| Filename | modeM0/AS1A11_086T01_9000005002_34913cztM0_level2.evt | modeM0/AS1A11_086T01_9000005002_34913cztM0_level2_quad_clean.evt |
| Size (bytes) | 401,037,120 | 82,782,720 |
| Size | 382.5 MB | 78.9 MB |
| Events in quadrant A | 2,469,213 | 541,087 |
| Events in quadrant B | 2,858,703 | 549,476 |
| Events in quadrant C | 2,980,553 | 543,826 |
| Events in quadrant D | 3,490,124 | 514,892 |
| Mode M9 | |||
|---|---|---|---|
| Quadrant | BADHDUFLAG | Total packets | Discarded packets |
| A | 0 | 24 | 0 |
| B | 0 | 24 | 0 |
| C | 0 | 24 | 0 |
| D | 0 | 25 | 0 |
| Mode SS | |||
|---|---|---|---|
| Quadrant | BADHDUFLAG | Total packets | Discarded packets |
| A | 0 | 104 | 0 |
| B | 0 | 104 | 0 |
| C | 0 | 104 | 0 |
| D | 0 | 104 | 0 |
| Mode M0 | |||
|---|---|---|---|
| Quadrant | BADHDUFLAG | Total packets | Discarded packets |
| A | 0 | 10615 | 3 |
| B | 0 | 11683 | 2 |
| C | 0 | 11909 | 2 |
| D | 0 | 13891 | 2 |
| Quadrant | Total seconds | Saturated seconds | Saturation percentage |
|---|---|---|---|
| A | 5103 | 6 | 0.117578% |
| B | 5103 | 114 | 2.233980% |
| C | 5103 | 99 | 1.940035% |
| D | 5103 | 34 | 0.666275% |
Noise dominated data is calculated using 1-second bins in cleaned event files. If a bin has >2000 counts, and if more than 50% of those come from <1% of pixels, then it is considered to be noise-dominated and hence unusable.
| Quadrant | # 1 sec bins | Bins with >0 counts | Bins with >2000 counts | High rate bins dominated by noise | Noise dominated (total time) | Noise dominated (detector-on time) | Marked lightcurve |
|---|---|---|---|---|---|---|---|
| A | 7076 | 5104 | 0 | 0 | 0.00% | 0.00% | 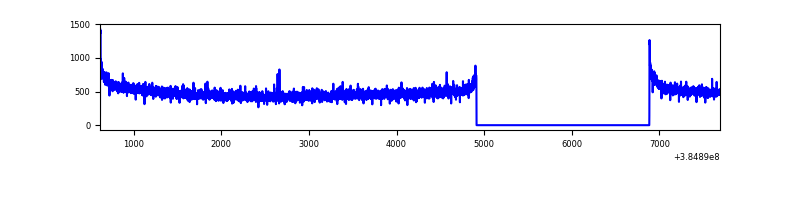 |
| B | 7076 | 5104 | 71 | 71 | 1.00% | 1.39% | 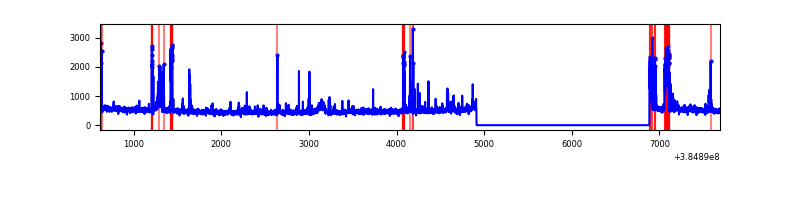 |
| C | 7076 | 5104 | 83 | 83 | 1.17% | 1.63% | 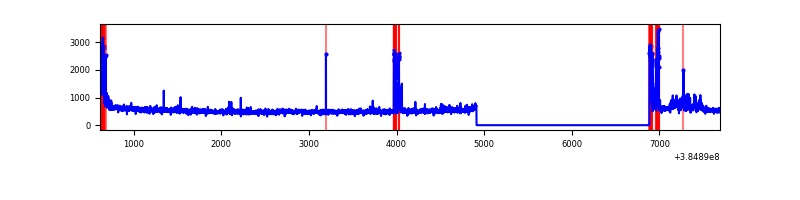 |
| D | 7076 | 5104 | 30 | 30 | 0.42% | 0.59% | 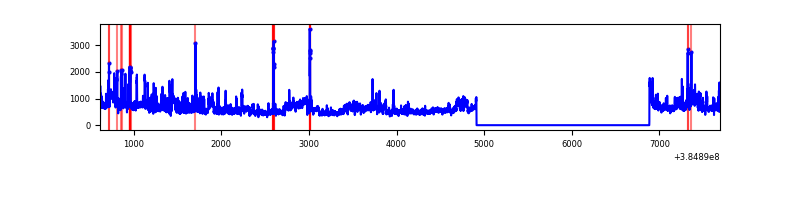 |
Top three noisy pixels from each quadrant. If the there are fewer than three noisy pixels in the level2.evt file, extra rows are filled as -1
| Pixel properties | Quadrant properties | ||||||
|---|---|---|---|---|---|---|---|
| Quadrant | DetID | PixID | Counts | Sigma | Mean | Median | Sigma |
| A | 10 | 83 | 59696 | 480.87 | 618 | 608 | 122.9 |
| A | 13 | 6 | 15587 | 121.9 | 618 | 608 | 122.9 |
| A | 13 | 254 | 8797 | 66.64 | 618 | 608 | 122.9 |
| B | 5 | 172 | 362174 | 3128.73 | 613 | 599 | 115.6 |
| B | 0 | 190 | 38017 | 323.78 | 613 | 599 | 115.6 |
| B | 5 | 200 | 19693 | 165.22 | 613 | 599 | 115.6 |
| C | 15 | 214 | 215505 | 1527.36 | 609 | 614 | 140.7 |
| C | 0 | 10 | 211930 | 1501.95 | 609 | 614 | 140.7 |
| C | 12 | 250 | 165734 | 1173.61 | 609 | 614 | 140.7 |
| D | 8 | 195 | 730952 | 4970.2 | 609 | 593 | 146.9 |
| D | 7 | 223 | 118685 | 803.63 | 609 | 593 | 146.9 |
| D | 1 | 52 | 104593 | 707.74 | 609 | 593 | 146.9 |
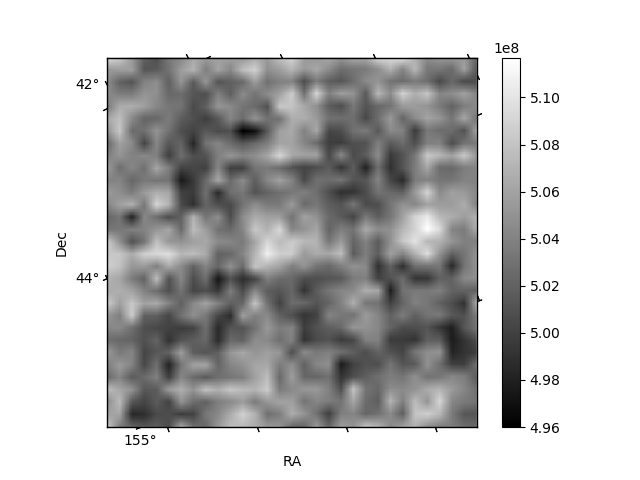
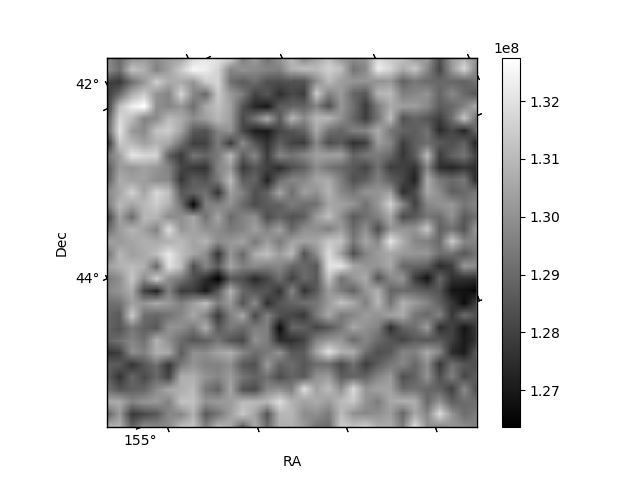
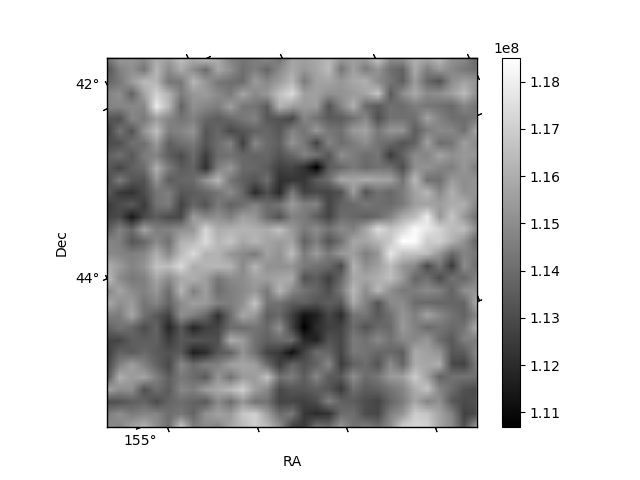
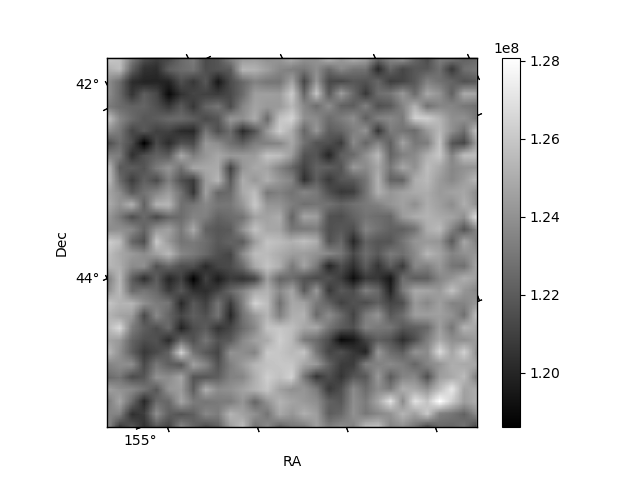
Histogram calculated using DETX and DETY for each event in the final _common_clean file
| Quadrant A | 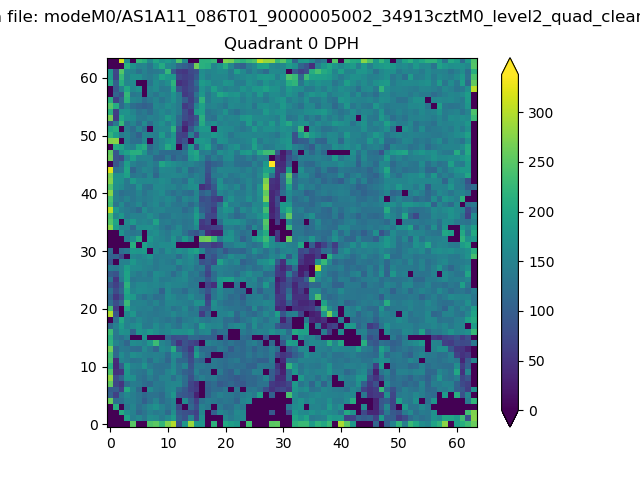 |
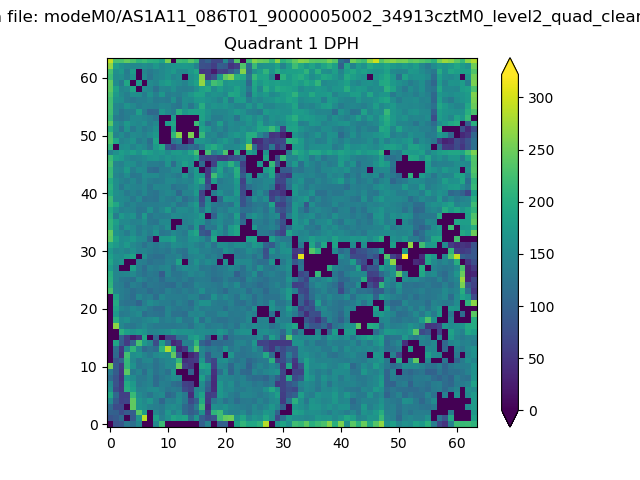 |
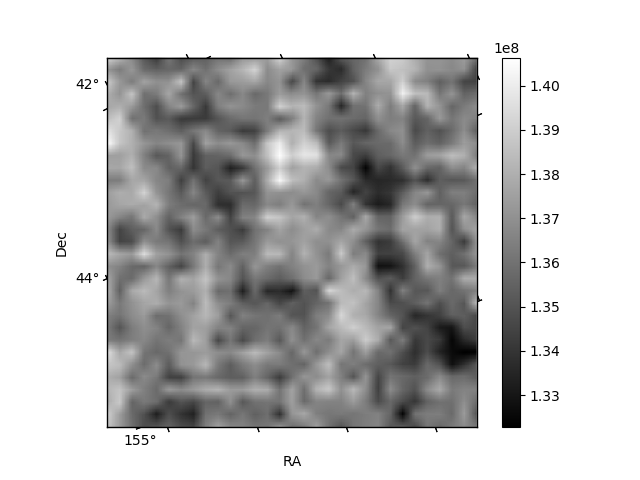
Quadrant B |
|---|---|---|---|
| Quadrant D | 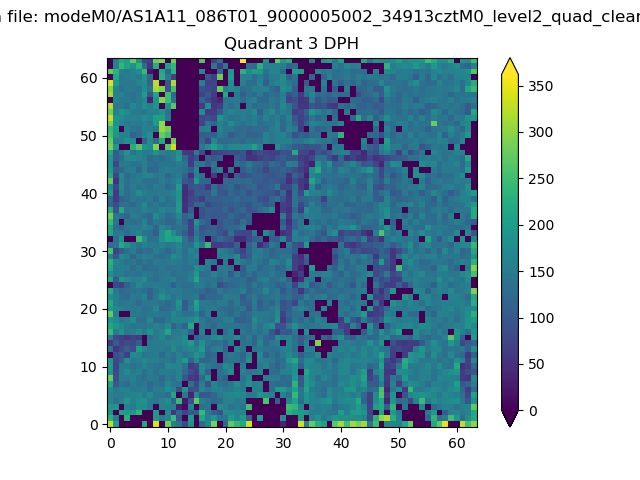 |
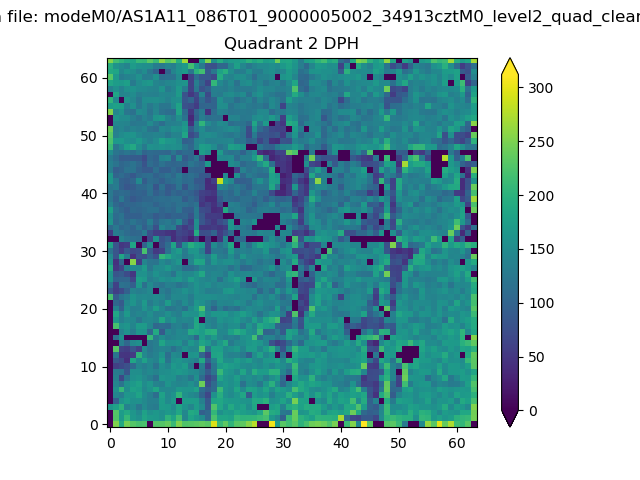 |
Quadrant C |
| Plot type | Count rate plots | Images |
|---|---|---|
| Comparison with Poisson distribution Blue bars denote a histogram of data divided into 1 sec bins. Red curve is a Poisson curve with rate = median count rate of data. |
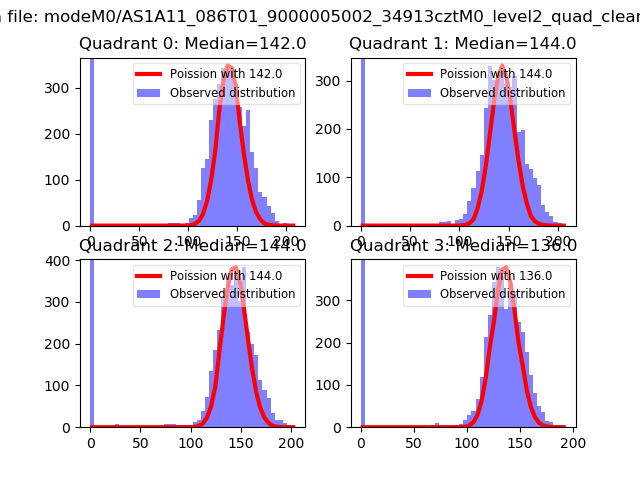 |
 |
| Quadrant-wise count rates Data is divided into 100 sec bins |
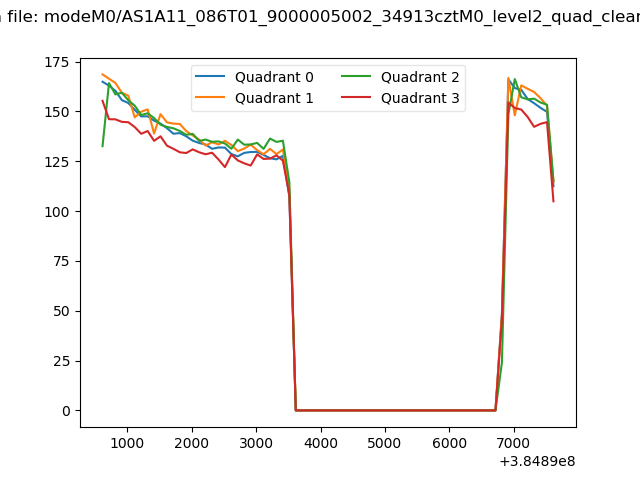 |
|
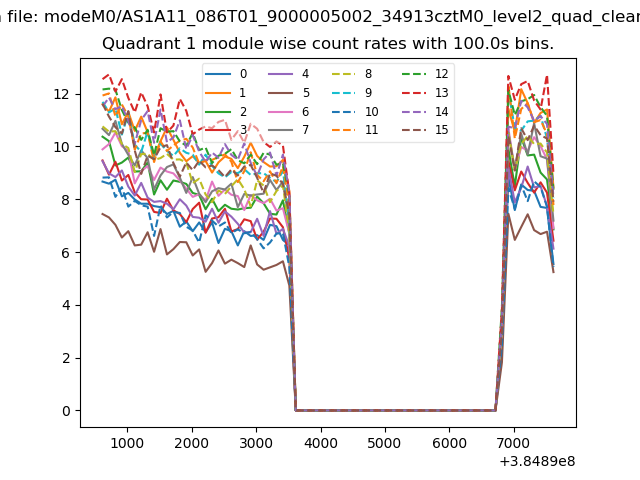
| Module-wise count rates for Quadrant A Data is divided into 100 sec bins |
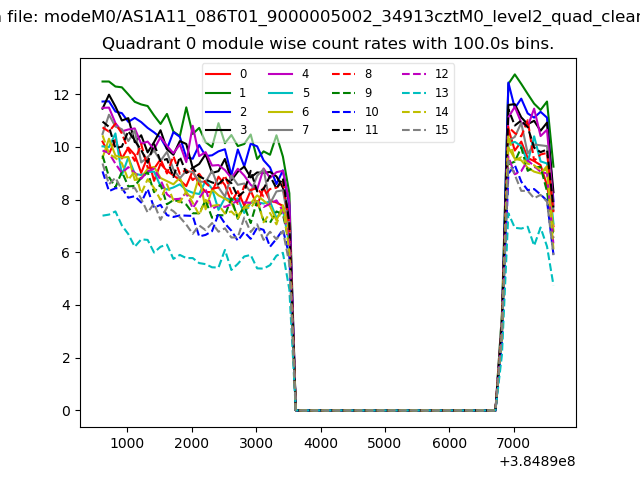 |
 |
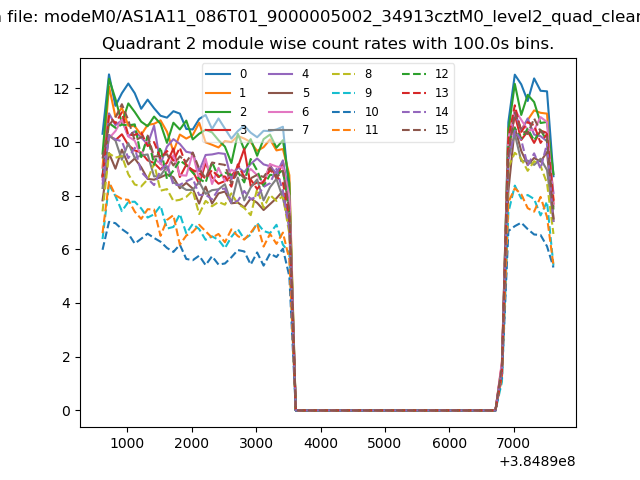
| Module-wise count rates for Quadrant B Data is divided into 100 sec bins |
 |
 |
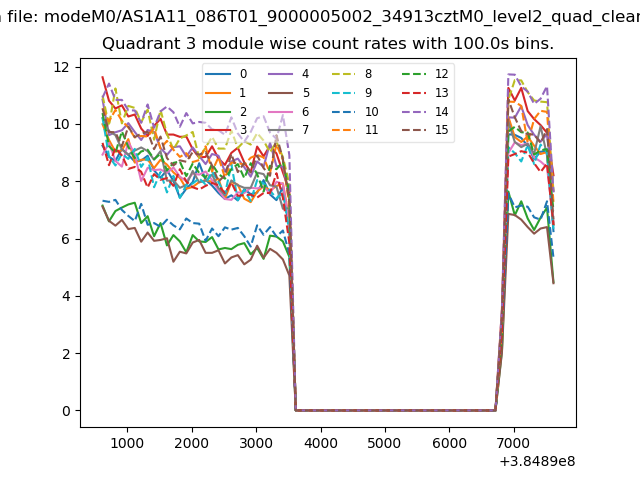
| Module-wise count rates for Quadrant C Data is divided into 100 sec bins |
 |
 |
| Module-wise count rates for Quadrant D Data is divided into 100 sec bins |
 |
 |
| Parameter | Plot |
|---|---|
| CZT HV Monitor |  |
| D_VDD | 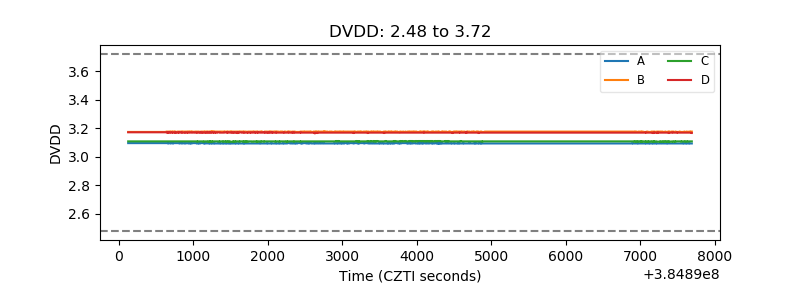 |
| Temperature 1 | 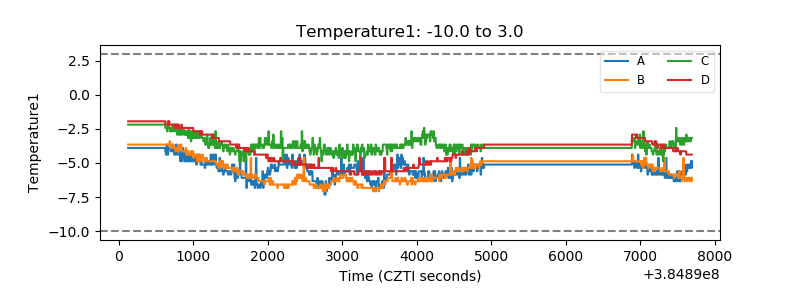 |
| Veto HV Monitor | 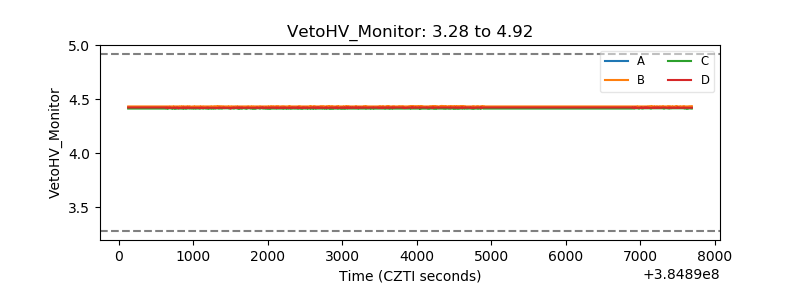 |
| Veto LLD | 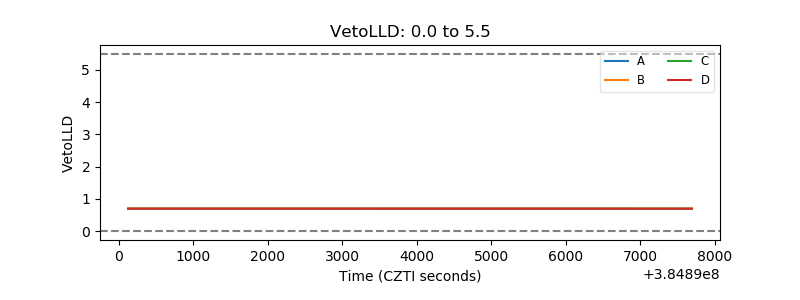 |
| Alpha Counter | 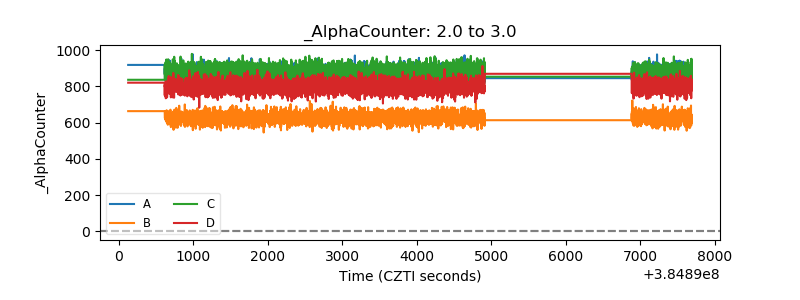 |
| _CPM_Rate | 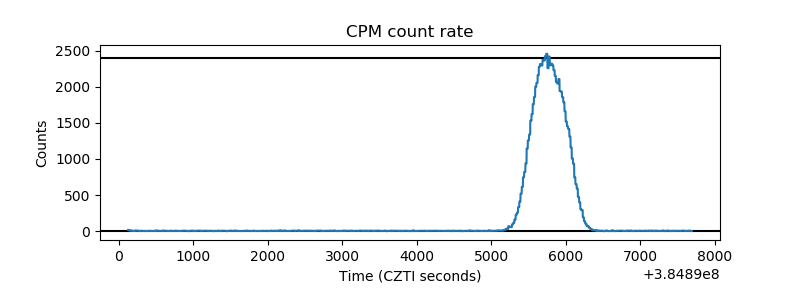 |
| CZT Counter | 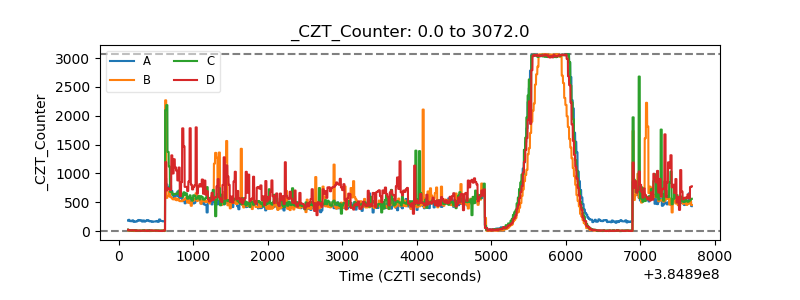 |
| +2.5 Volts monitor |  |
| +5 Volts monitor | 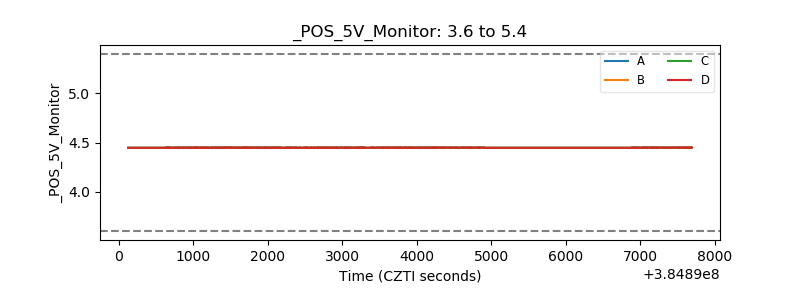 |
| _ROLL_ROT | 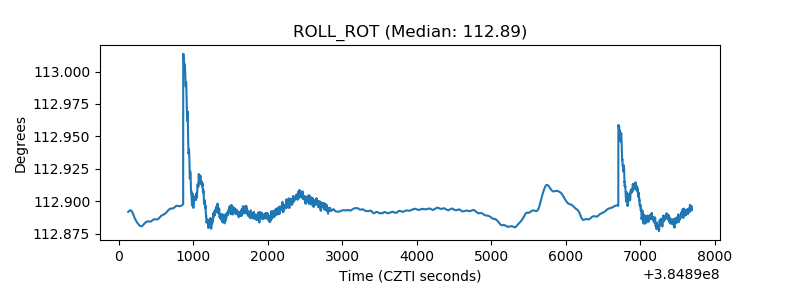 |
| _Roll_DEC |  |
| _Roll_RA | 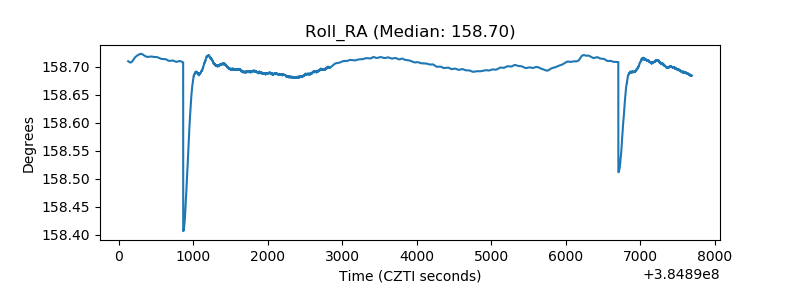 |
| Veto Counter | 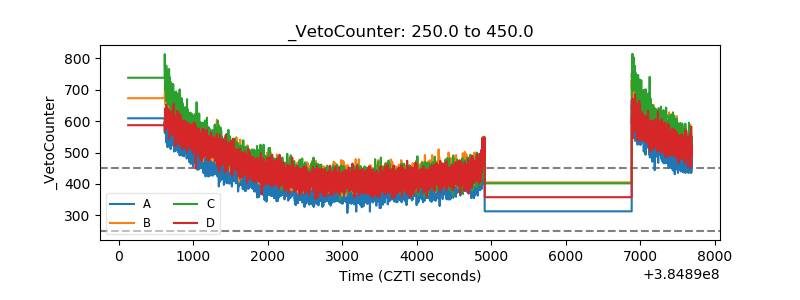 |