| Param | Original file | Final file |
|---|---|---|
| Filename | modeM0/AS1A11_086T01_9000005002_34912cztM0_level2.evt | modeM0/AS1A11_086T01_9000005002_34912cztM0_level2_quad_clean.evt |
| Size (bytes) | 282,709,440 | 49,461,120 |
| Size | 269.6 MB | 47.2 MB |
| Events in quadrant A | 1,759,805 | 318,828 |
| Events in quadrant B | 1,876,842 | 322,432 |
| Events in quadrant C | 1,810,836 | 322,838 |
| Events in quadrant D | 2,882,516 | 292,371 |
| Mode M9 | |||
|---|---|---|---|
| Quadrant | BADHDUFLAG | Total packets | Discarded packets |
| A | 0 | 18 | 0 |
| B | 0 | 18 | 0 |
| C | 0 | 18 | 0 |
| D | 0 | 18 | 0 |
| Mode SS | |||
|---|---|---|---|
| Quadrant | BADHDUFLAG | Total packets | Discarded packets |
| A | 0 | 70 | 0 |
| B | 0 | 70 | 0 |
| C | 0 | 70 | 0 |
| D | 0 | 70 | 0 |
| Mode M0 | |||
|---|---|---|---|
| Quadrant | BADHDUFLAG | Total packets | Discarded packets |
| A | 0 | 7345 | 2 |
| B | 0 | 7696 | 1 |
| C | 0 | 7437 | 1 |
| D | 0 | 10903 | 1 |
| Quadrant | Total seconds | Saturated seconds | Saturation percentage |
|---|---|---|---|
| A | 3395 | 8 | 0.235641% |
| B | 3395 | 40 | 1.178203% |
| C | 3395 | 44 | 1.296024% |
| D | 3395 | 226 | 6.656848% |
Noise dominated data is calculated using 1-second bins in cleaned event files. If a bin has >2000 counts, and if more than 50% of those come from <1% of pixels, then it is considered to be noise-dominated and hence unusable.
| Quadrant | # 1 sec bins | Bins with >0 counts | Bins with >2000 counts | High rate bins dominated by noise | Noise dominated (total time) | Noise dominated (detector-on time) | Marked lightcurve |
|---|---|---|---|---|---|---|---|
| A | 5218 | 3396 | 1 | 1 | 0.02% | 0.03% | 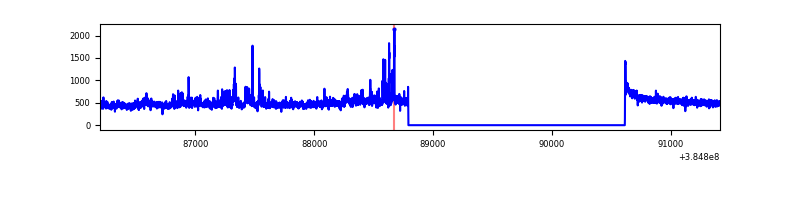 |
| B | 5218 | 3396 | 28 | 28 | 0.54% | 0.82% | 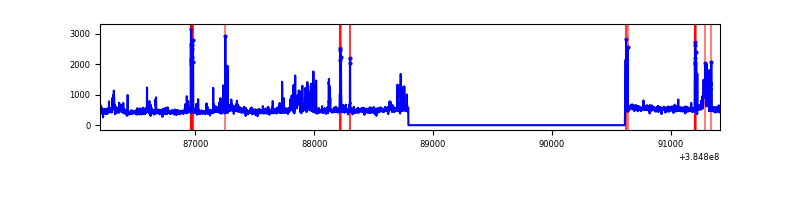 |
| C | 5218 | 3396 | 33 | 33 | 0.63% | 0.97% | 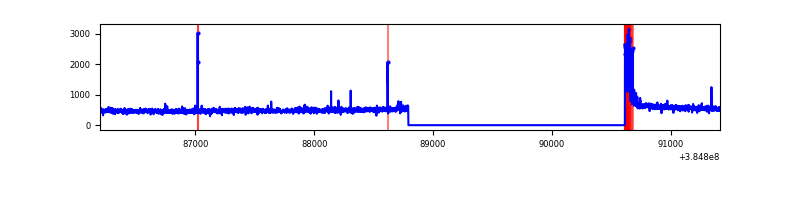 |
| D | 5218 | 3396 | 237 | 237 | 4.54% | 6.98% | 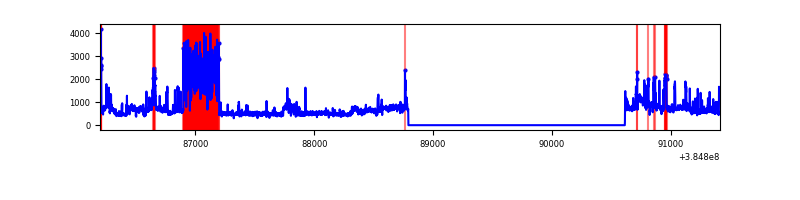 |
Top three noisy pixels from each quadrant. If the there are fewer than three noisy pixels in the level2.evt file, extra rows are filled as -1
| Pixel properties | Quadrant properties | ||||||
|---|---|---|---|---|---|---|---|
| Quadrant | DetID | PixID | Counts | Sigma | Mean | Median | Sigma |
| A | 15 | 169 | 171359 | 2100.27 | 400 | 392 | 81.4 |
| A | 10 | 83 | 32832 | 398.51 | 400 | 392 | 81.4 |
| A | 13 | 6 | 5387 | 61.36 | 400 | 392 | 81.4 |
| B | 5 | 172 | 198227 | 2550.89 | 397 | 386 | 77.6 |
| B | 0 | 190 | 49356 | 631.4 | 397 | 386 | 77.6 |
| B | 4 | 232 | 28281 | 359.67 | 397 | 386 | 77.6 |
| C | 15 | 214 | 142679 | 1534.46 | 393 | 397 | 92.7 |
| C | 0 | 10 | 101171 | 1086.81 | 393 | 397 | 92.7 |
| C | 12 | 250 | 17280 | 182.08 | 393 | 397 | 92.7 |
| D | 7 | 223 | 660749 | 7127.37 | 381 | 371 | 92.7 |
| D | 8 | 195 | 601821 | 6491.36 | 381 | 371 | 92.7 |
| D | 7 | 38 | 48257 | 516.83 | 381 | 371 | 92.7 |
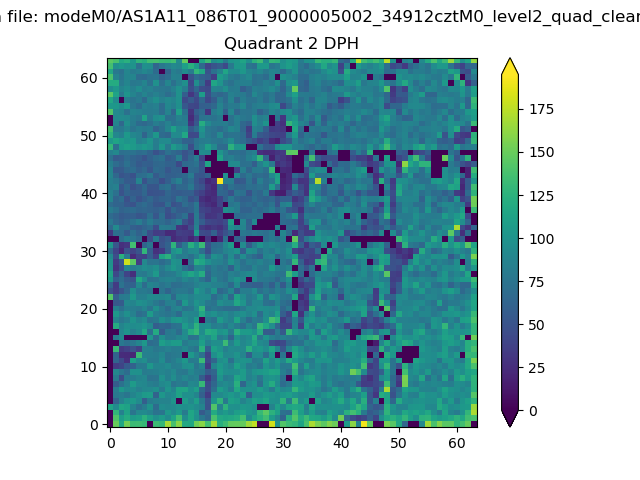
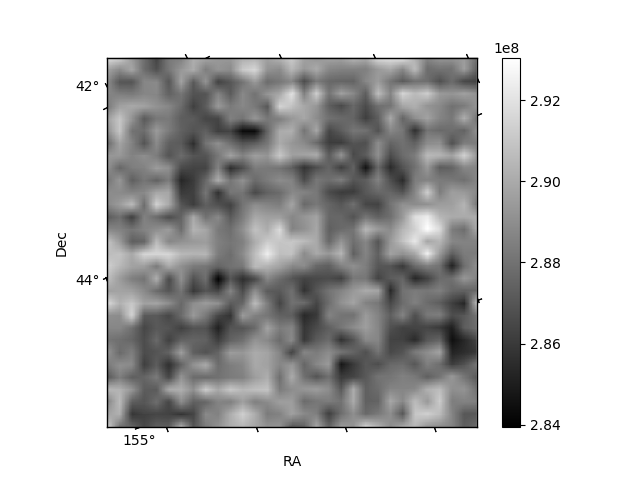
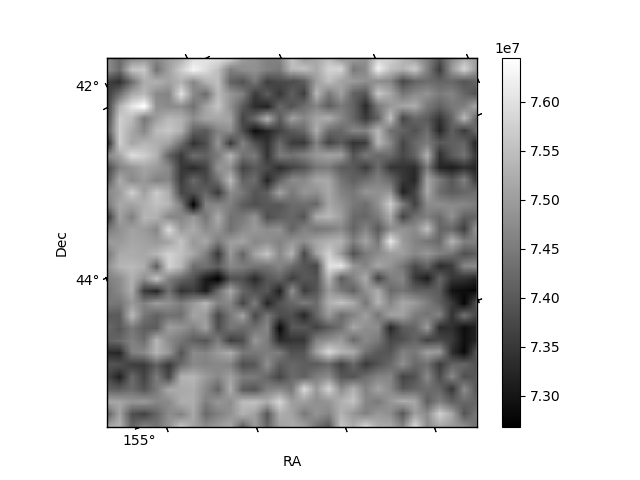
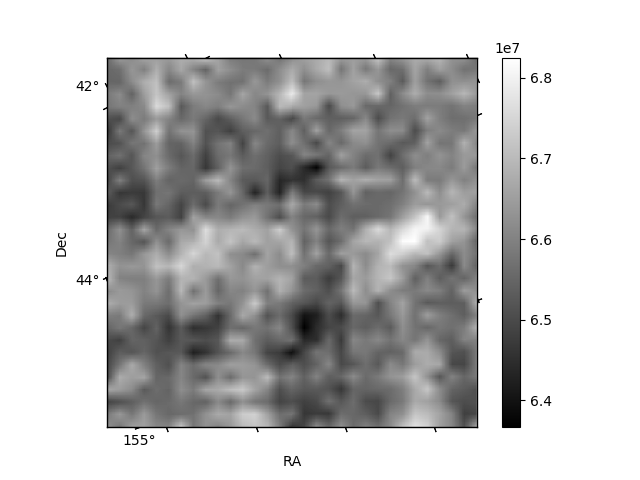
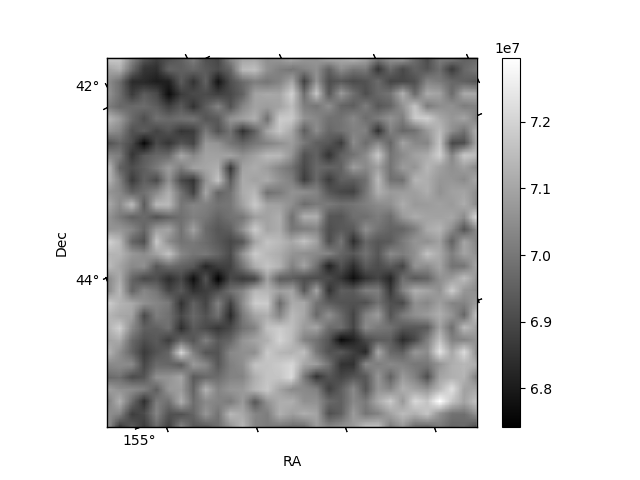
Histogram calculated using DETX and DETY for each event in the final _common_clean file
| Quadrant A | 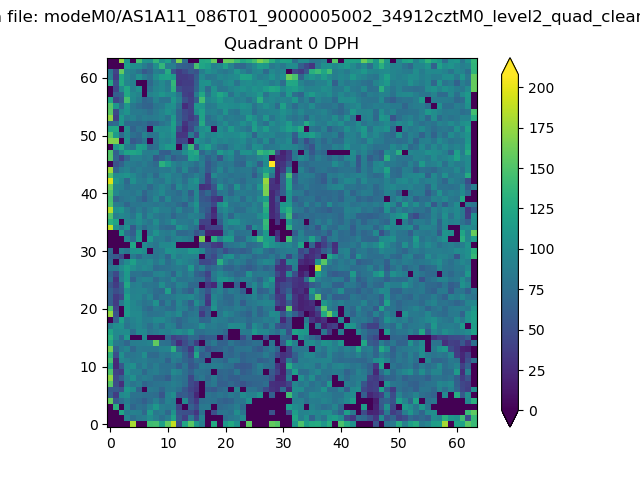 |
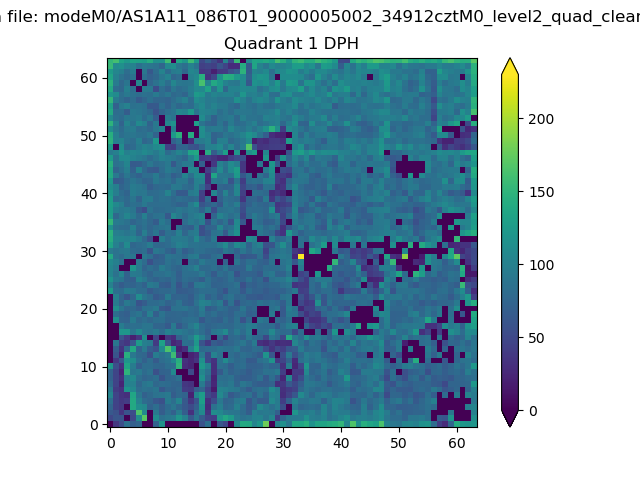 |
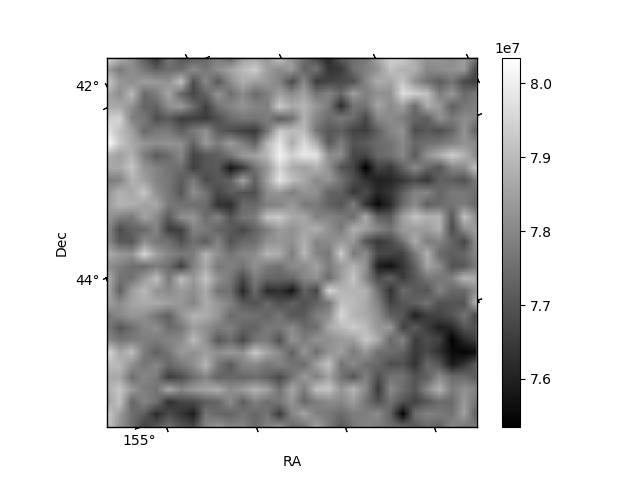
Quadrant B |
|---|---|---|---|
| Quadrant D | 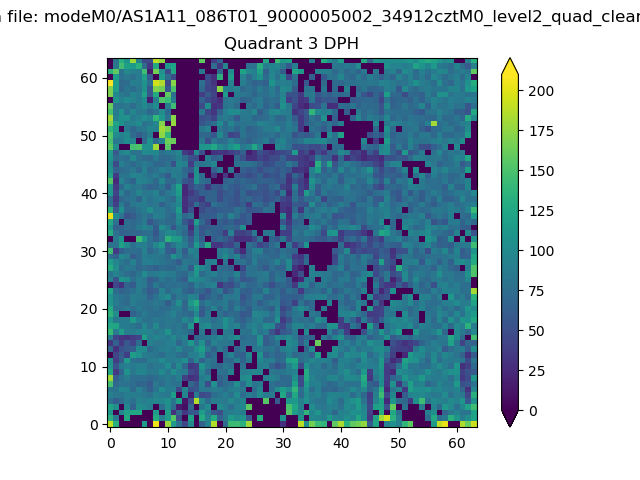 |
 |
Quadrant C |
| Plot type | Count rate plots | Images |
|---|---|---|
| Comparison with Poisson distribution Blue bars denote a histogram of data divided into 1 sec bins. Red curve is a Poisson curve with rate = median count rate of data. |
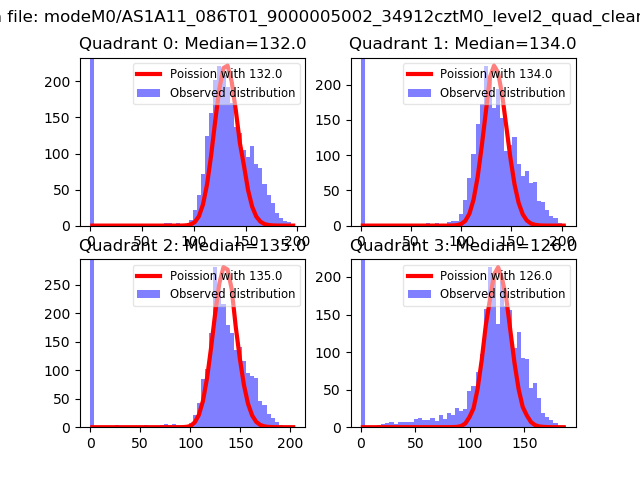 |
 |
| Quadrant-wise count rates Data is divided into 100 sec bins |
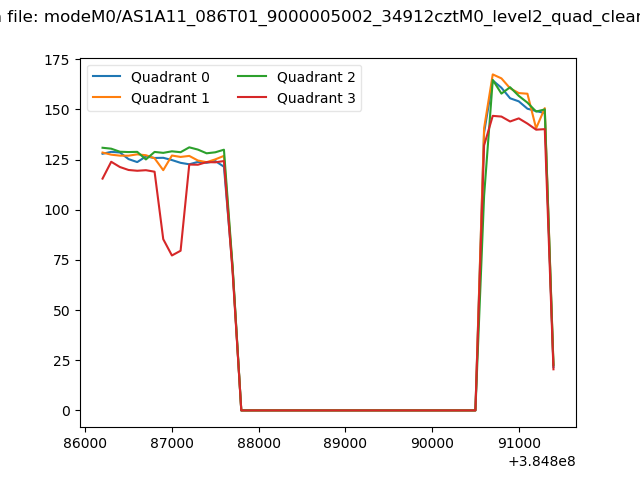 |
|
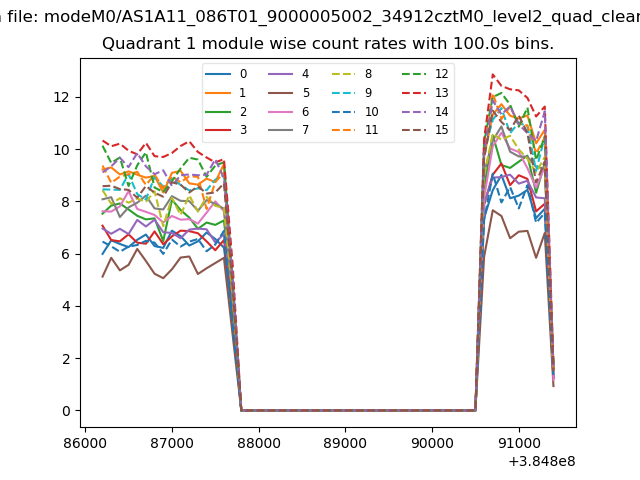
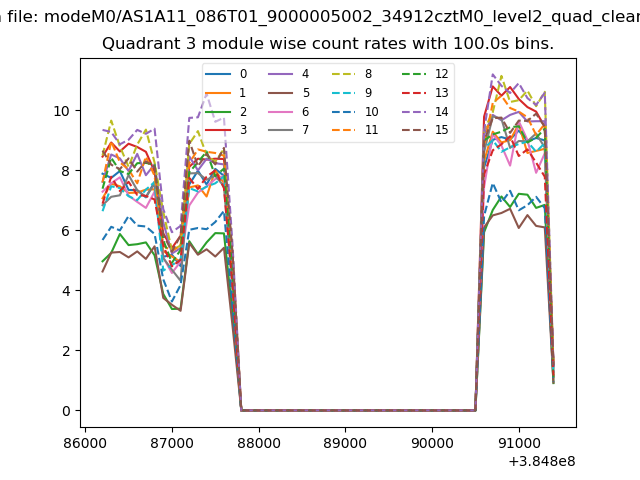
| Module-wise count rates for Quadrant A Data is divided into 100 sec bins |
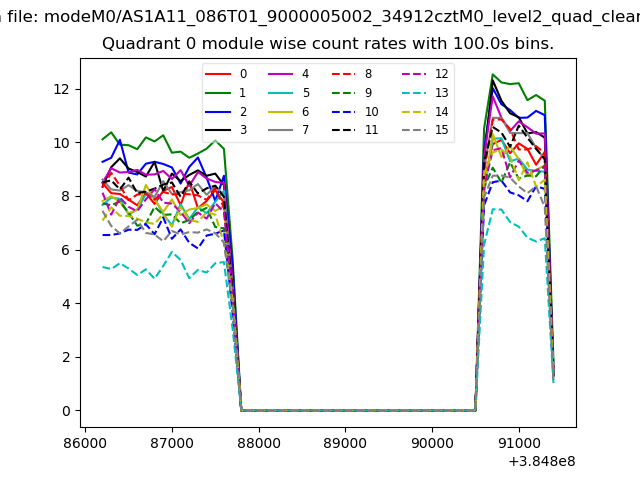 |
 |
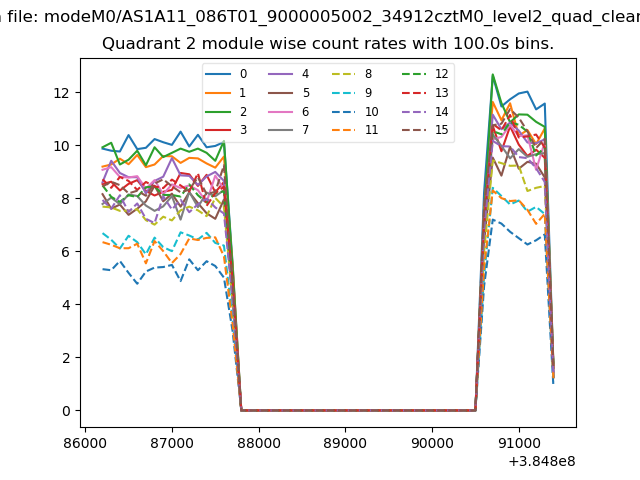
| Module-wise count rates for Quadrant B Data is divided into 100 sec bins |
 |
 |
| Module-wise count rates for Quadrant C Data is divided into 100 sec bins |
 |
 |
| Module-wise count rates for Quadrant D Data is divided into 100 sec bins |
 |
 |
| Parameter | Plot |
|---|---|
| CZT HV Monitor | 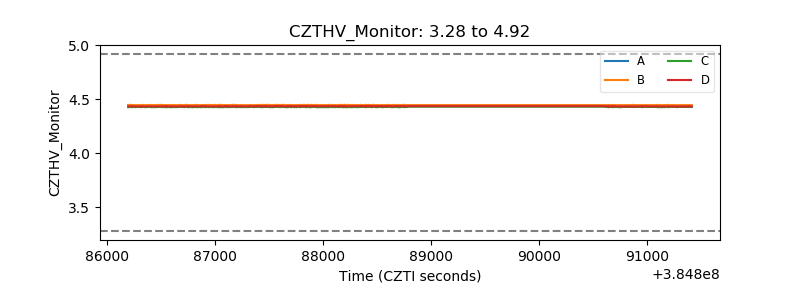 |
| D_VDD | 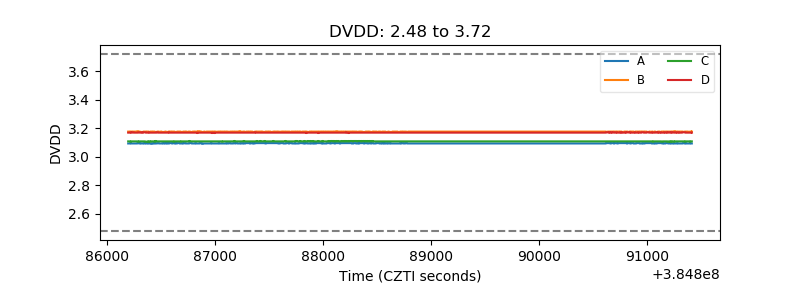 |
| Temperature 1 | 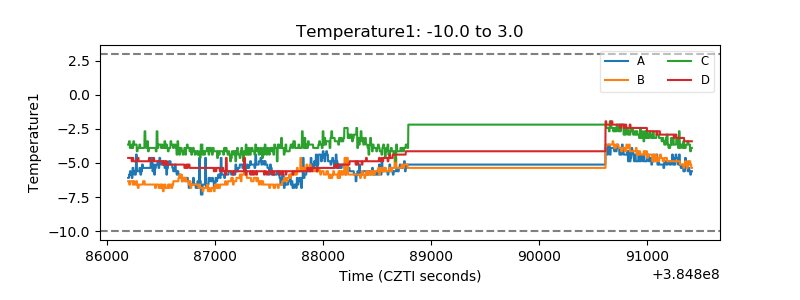 |
| Veto HV Monitor | 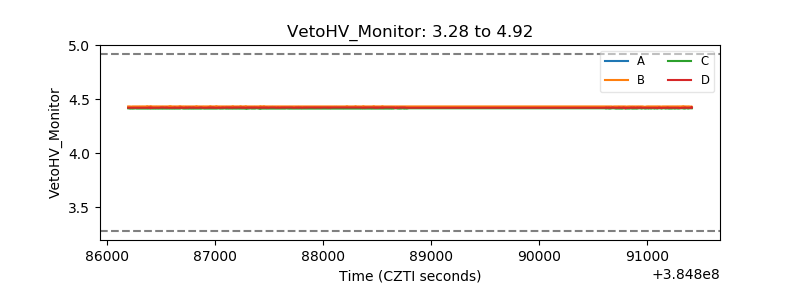 |
| Veto LLD | 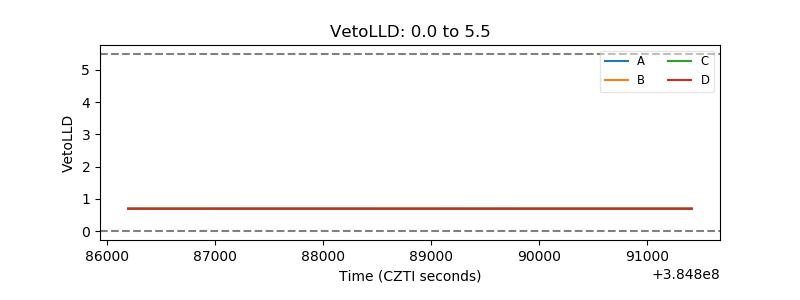 |
| Alpha Counter | 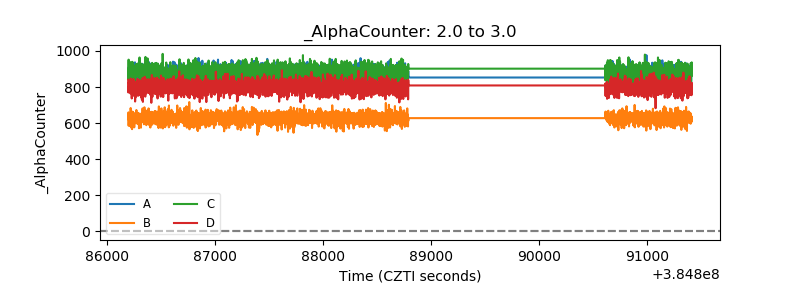 |
| _CPM_Rate | 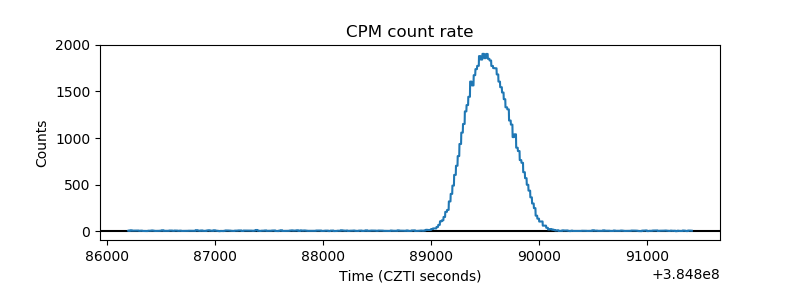 |
| CZT Counter | 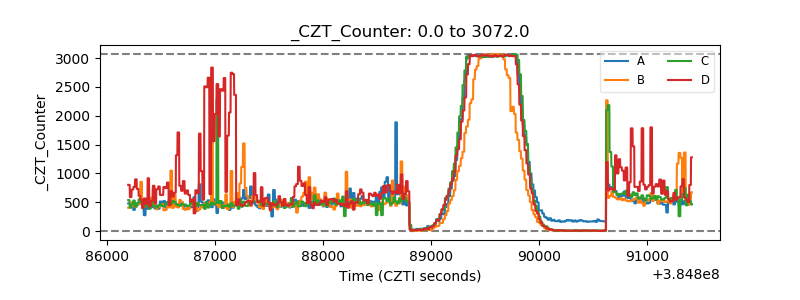 |
| +2.5 Volts monitor | 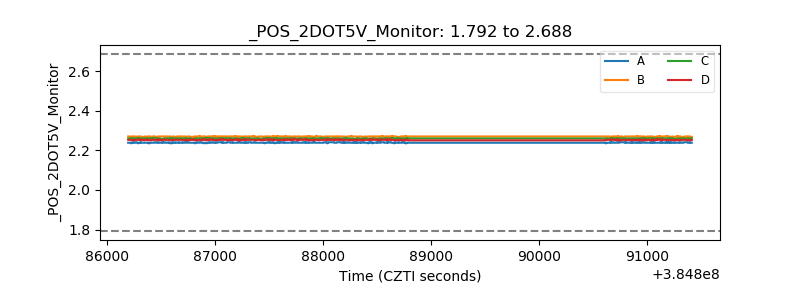 |
| +5 Volts monitor | 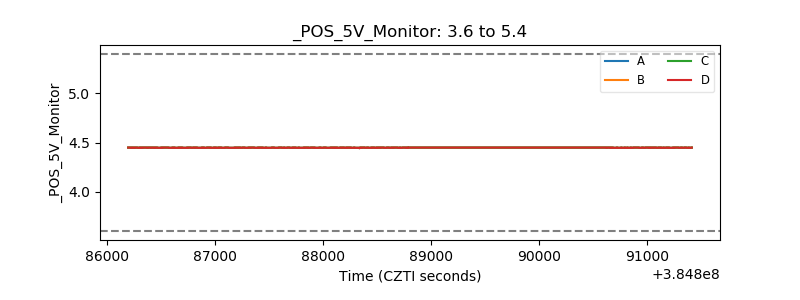 |
| _ROLL_ROT | 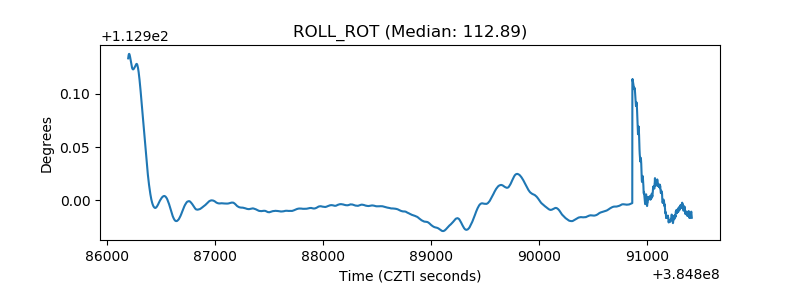 |
| _Roll_DEC | 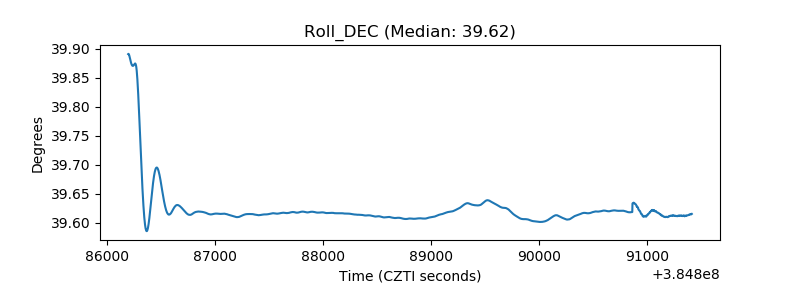 |
| _Roll_RA | 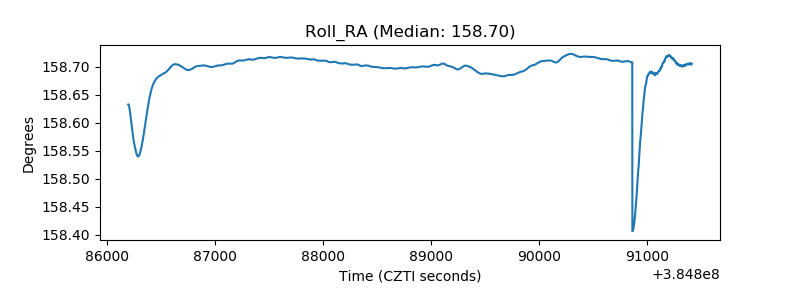 |
| Veto Counter | 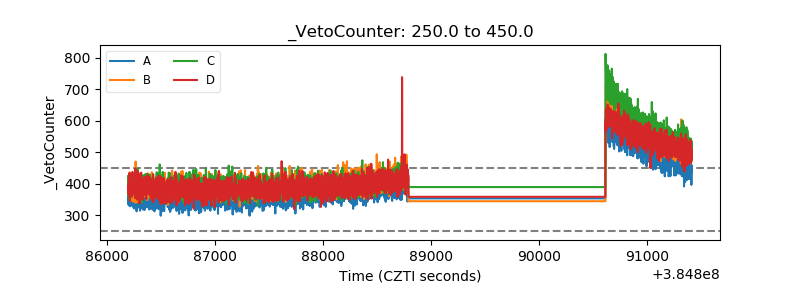 |