| Param | Original file | Final file |
|---|---|---|
| Filename | modeM0/AS1A11_086T01_9000005002cztM0_level2_bc.evt | modeM0/AS1A11_086T01_9000005002cztM0_level2_quad_clean.evt |
| Size (bytes) | 2,157,024,960 | 619,090,560 |
| Size | 2.0 GB | 590.4 MB |
| Events in quadrant A | 10,835,058 | 3,787,011 |
| Events in quadrant B | 15,719,655 | 4,002,481 |
| Events in quadrant C | 12,539,103 | 4,113,190 |
| Events in quadrant D | 23,178,611 | 3,769,621 |
| Mode M9 | |||
|---|---|---|---|
| Quadrant | BADHDUFLAG | Total packets | Discarded packets |
| A | 0 | 202 | 0 |
| B | 0 | 202 | 0 |
| C | 0 | 202 | 0 |
| D | 0 | 203 | 0 |
| Mode SS | |||
|---|---|---|---|
| Quadrant | BADHDUFLAG | Total packets | Discarded packets |
| A | 0 | 914 | 0 |
| B | 0 | 914 | 0 |
| C | 0 | 914 | 0 |
| D | 0 | 914 | 0 |
| Mode M0 | |||
|---|---|---|---|
| Quadrant | BADHDUFLAG | Total packets | Discarded packets |
| A | 0 | 107277 | 0 |
| B | 0 | 116935 | 0 |
| C | 0 | 97156 | 0 |
| D | 0 | 134950 | 0 |
| Quadrant | Total seconds | Saturated seconds | Saturation percentage |
|---|---|---|---|
| A | 44852 | 2526 | 5.631856% |
| B | 44852 | 2499 | 5.571658% |
| C | 44852 | 419 | 0.934184% |
| D | 44852 | 1952 | 4.352091% |
Noise dominated data is calculated using 1-second bins in cleaned event files. If a bin has >2000 counts, and if more than 50% of those come from <1% of pixels, then it is considered to be noise-dominated and hence unusable.
| Quadrant | # 1 sec bins | Bins with >0 counts | Bins with >2000 counts | High rate bins dominated by noise | Noise dominated (total time) | Noise dominated (detector-on time) | Marked lightcurve |
|---|---|---|---|---|---|---|---|
| A | 101101 | 44798 | 3 | 3 | 0.00% | 0.01% | 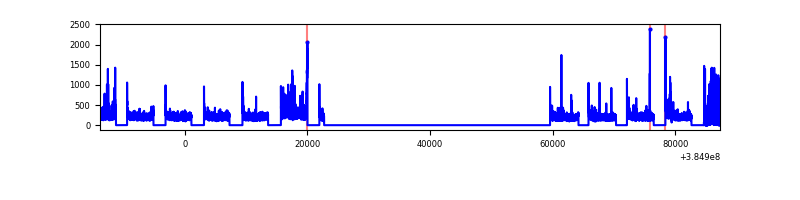 |
| B | 101102 | 44852 | 147 | 147 | 0.15% | 0.33% | 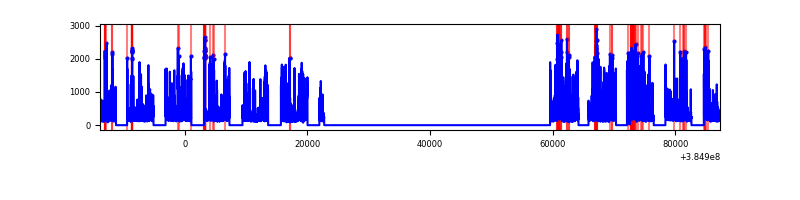 |
| C | 101102 | 44852 | 69 | 69 | 0.07% | 0.15% | 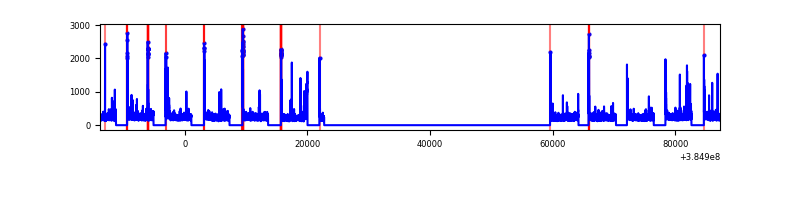 |
| D | 101102 | 44850 | 842 | 842 | 0.83% | 1.88% | 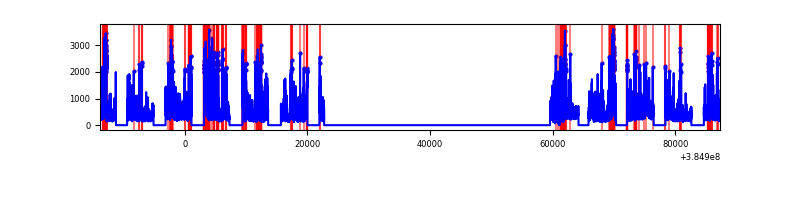 |
Top three noisy pixels from each quadrant. If the there are fewer than three noisy pixels in the level2.evt file, extra rows are filled as -1
| Pixel properties | Quadrant properties | ||||||
|---|---|---|---|---|---|---|---|
| Quadrant | DetID | PixID | Counts | Sigma | Mean | Median | Sigma |
| A | 15 | 169 | 1402322 | 2734.53 | 2308 | 2277 | 512.0 |
| A | 10 | 83 | 351774 | 682.63 | 2308 | 2277 | 512.0 |
| A | 13 | 6 | 96385 | 183.81 | 2308 | 2277 | 512.0 |
| B | 5 | 172 | 5434354 | 11575.54 | 2375 | 2324 | 469.3 |
| B | 5 | 255 | 517319 | 1097.44 | 2375 | 2324 | 469.3 |
| B | 0 | 190 | 228371 | 481.7 | 2375 | 2324 | 469.3 |
| C | 15 | 214 | 1782258 | 3178.34 | 2405 | 2392 | 560.0 |
| C | 0 | 10 | 869896 | 1549.12 | 2405 | 2392 | 560.0 |
| C | 12 | 250 | 177705 | 313.06 | 2405 | 2392 | 560.0 |
| D | 8 | 195 | 6363556 | 11111.69 | 2365 | 2297 | 572.5 |
| D | 7 | 223 | 2275293 | 3970.41 | 2365 | 2297 | 572.5 |
| D | 2 | 31 | 1133630 | 1976.18 | 2365 | 2297 | 572.5 |
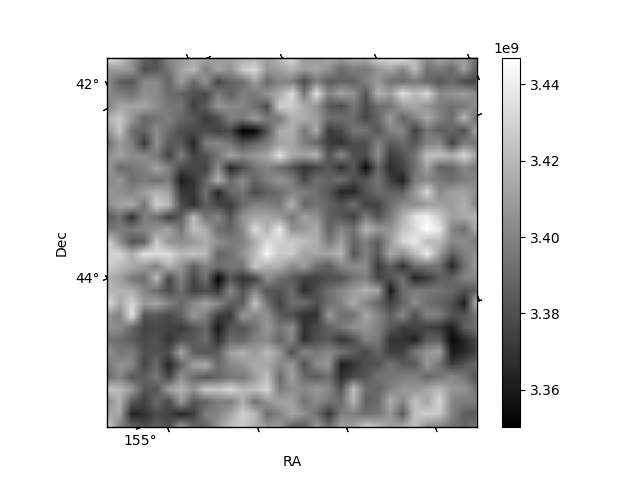
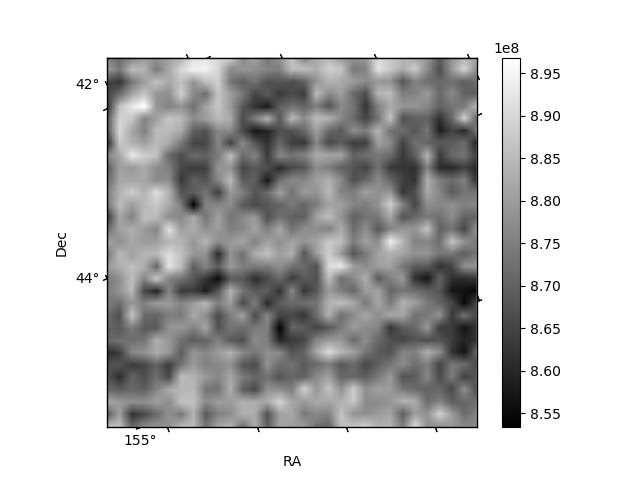
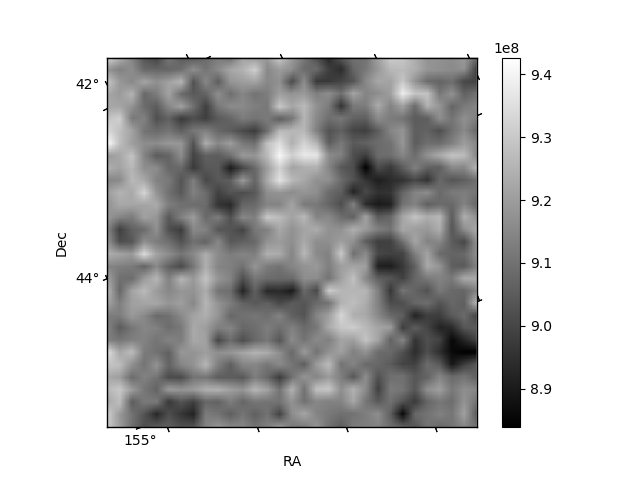
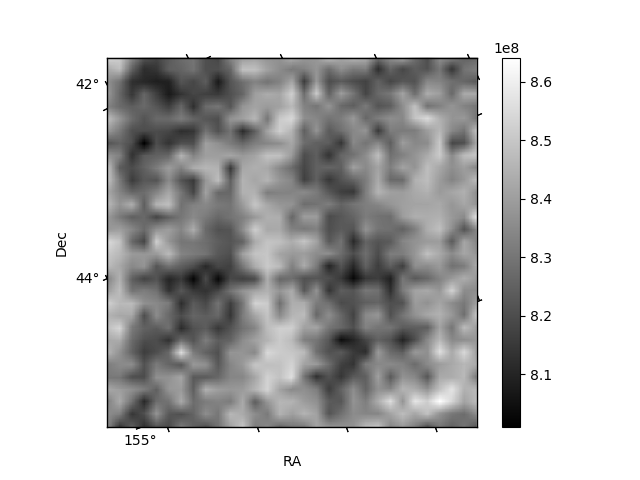
Histogram calculated using DETX and DETY for each event in the final _common_clean file
| Quadrant A | 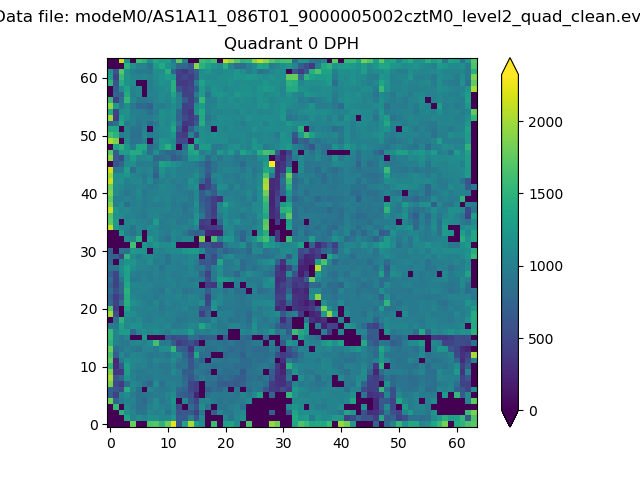 |
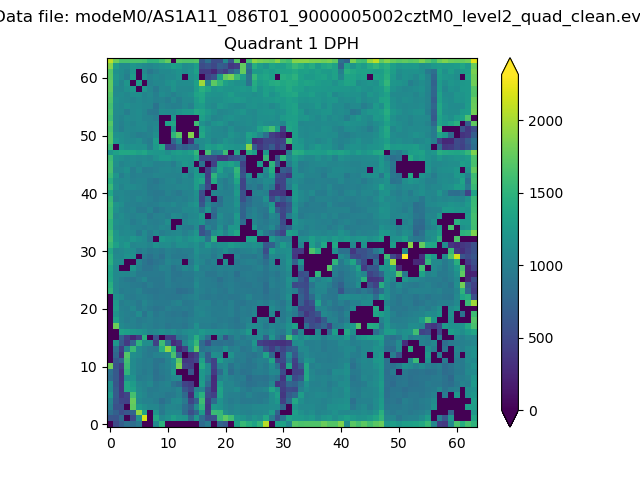 |
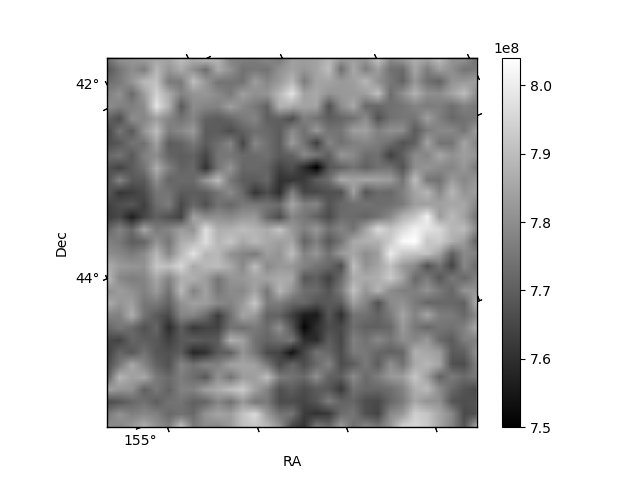
Quadrant B |
|---|---|---|---|
| Quadrant D |  |
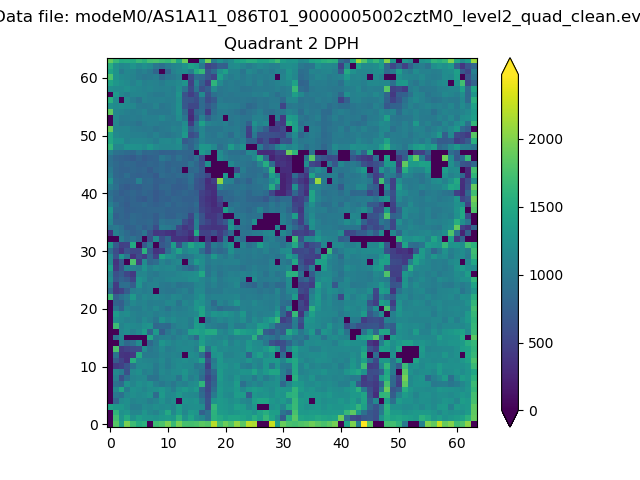 |
Quadrant C |
| Plot type | Count rate plots | Images |
|---|---|---|
| Comparison with Poisson distribution Blue bars denote a histogram of data divided into 1 sec bins. Red curve is a Poisson curve with rate = median count rate of data. |
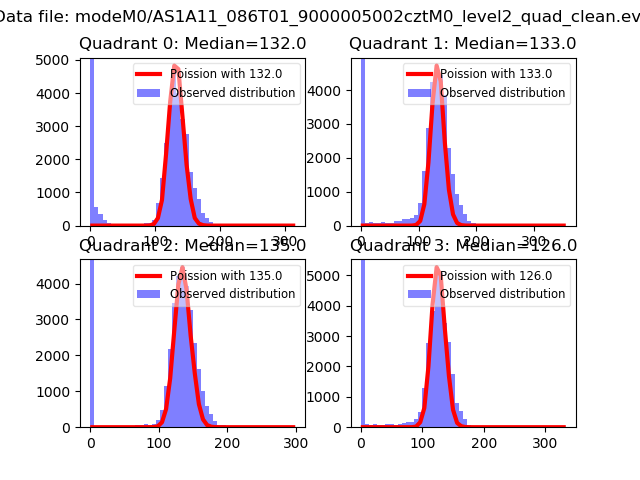 |
 |
| Quadrant-wise count rates Data is divided into 100 sec bins |
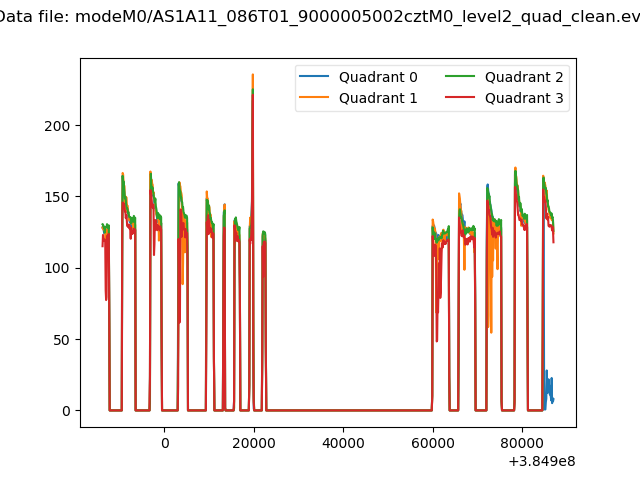 |
|
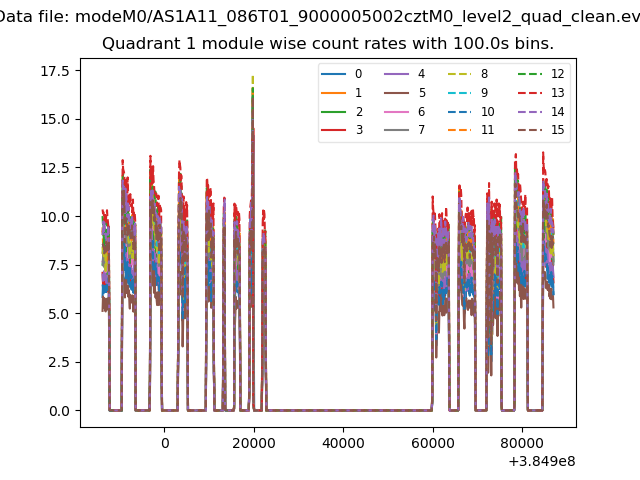
| Module-wise count rates for Quadrant A Data is divided into 100 sec bins |
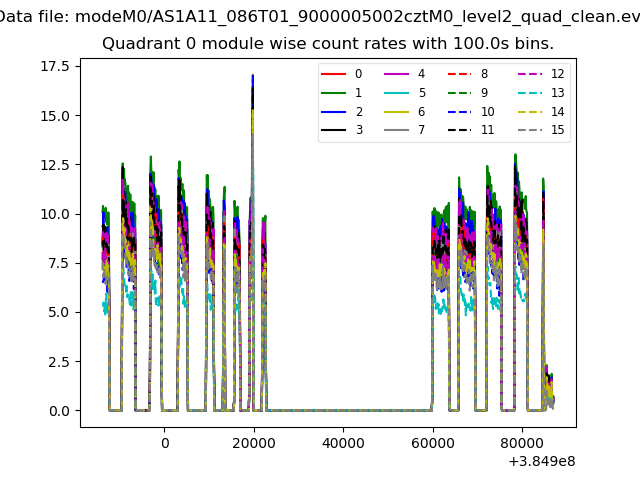 |
 |
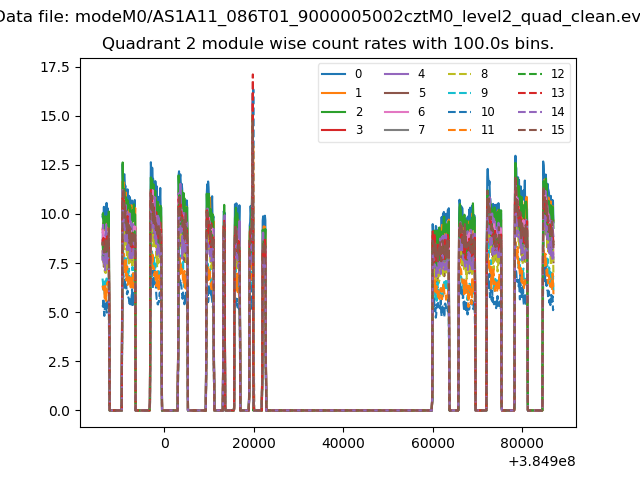
| Module-wise count rates for Quadrant B Data is divided into 100 sec bins |
 |
 |
| Module-wise count rates for Quadrant C Data is divided into 100 sec bins |
 |
 |
| Module-wise count rates for Quadrant D Data is divided into 100 sec bins |
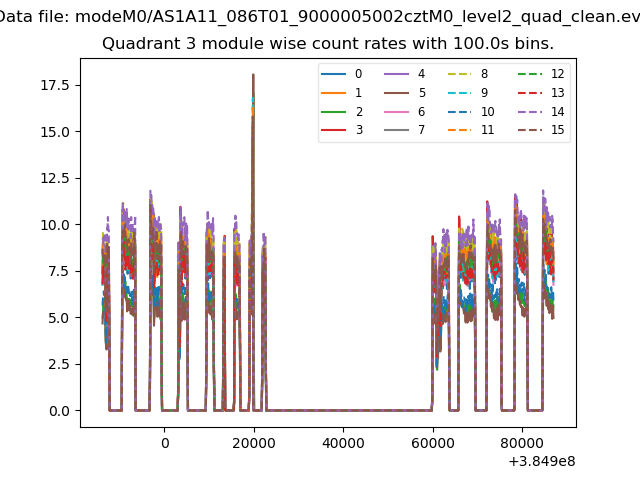 |
 |
| Parameter | Plot |
|---|---|
| CZT HV Monitor | 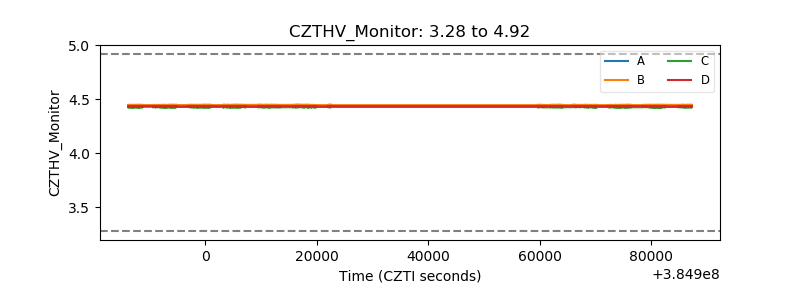 |
| D_VDD | 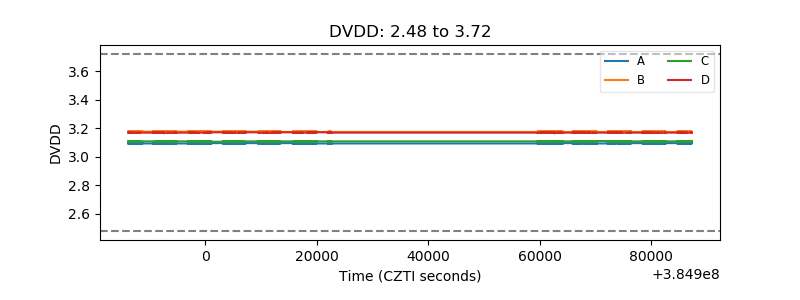 |
| Temperature 1 | 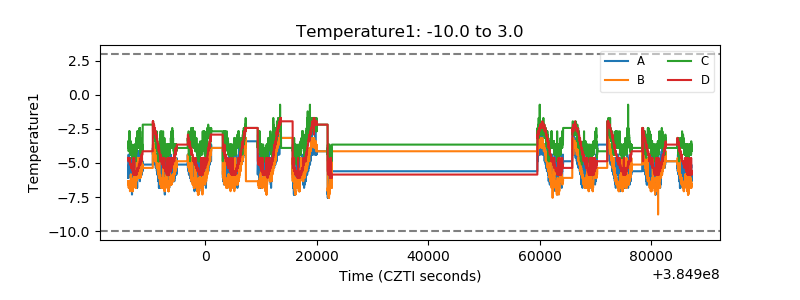 |
| Veto HV Monitor | 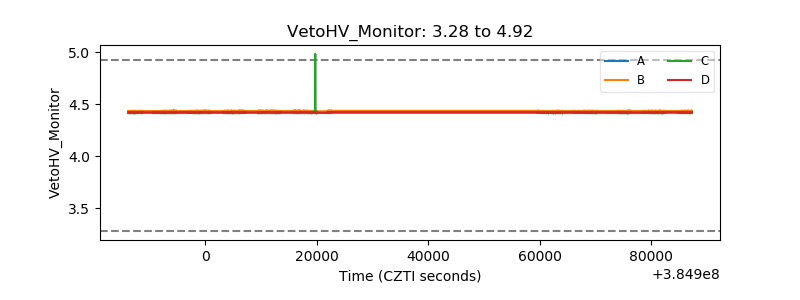 |
| Veto LLD | 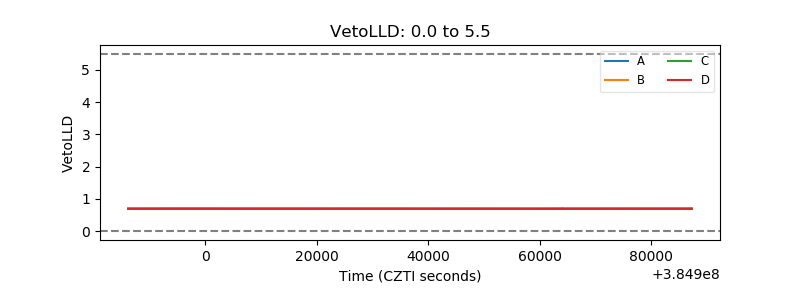 |
| Alpha Counter | 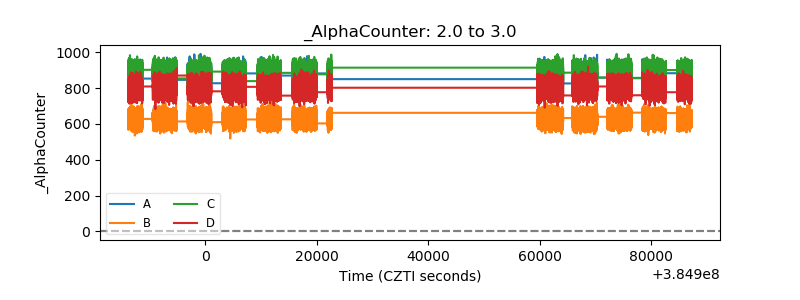 |
| _CPM_Rate | 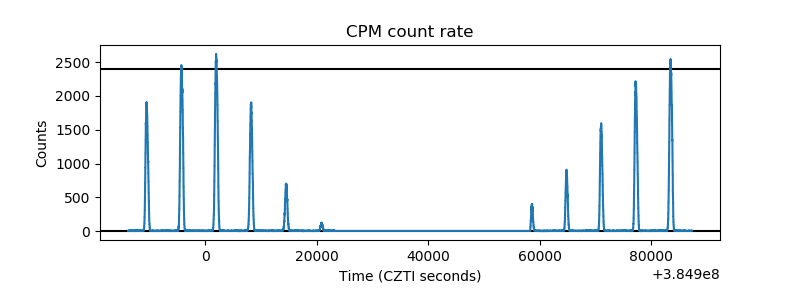 |
| CZT Counter | 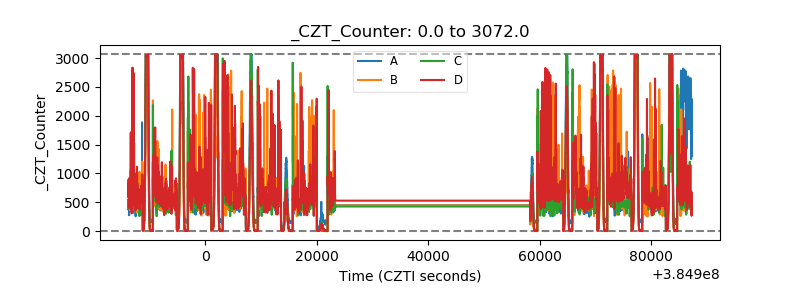 |
| +2.5 Volts monitor | 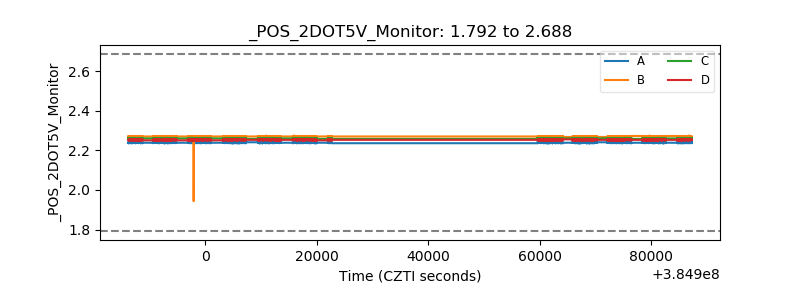 |
| +5 Volts monitor | 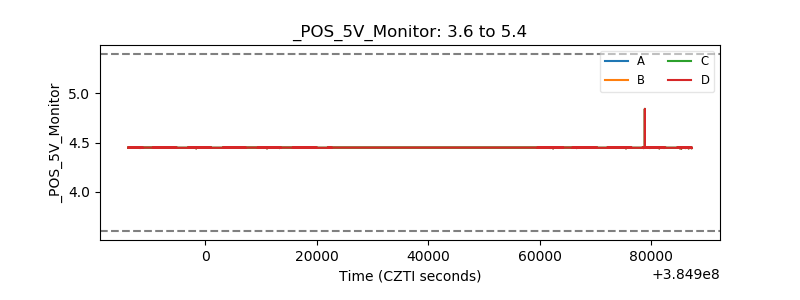 |
| _ROLL_ROT | 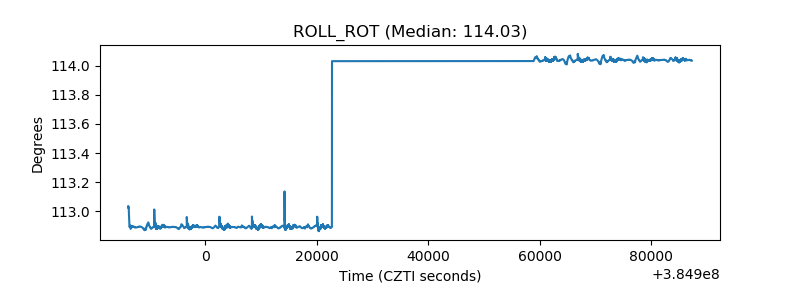 |
| _Roll_DEC | 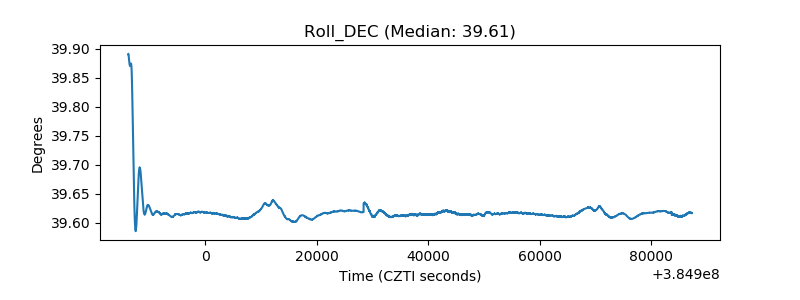 |
| _Roll_RA | 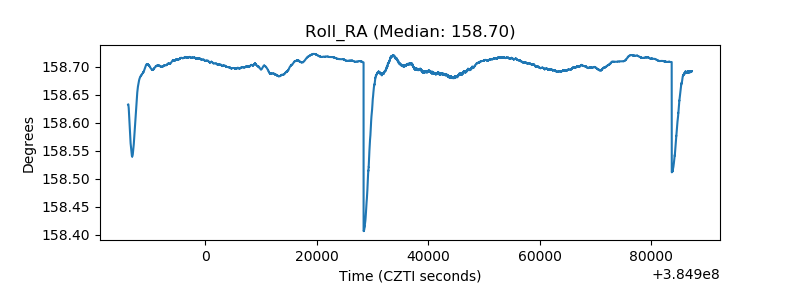 |
| Veto Counter | 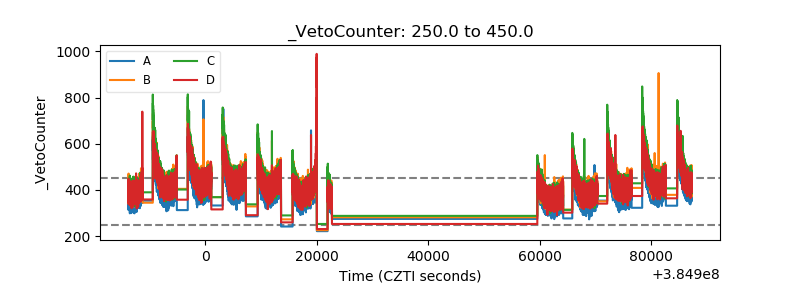 |