| Param | Original file | Final file |
|---|---|---|
| Filename | modeM0/AS1A11_065T21_9000005000_34910cztM0_level2.evt | modeM0/AS1A11_065T21_9000005000_34910cztM0_level2_quad_clean.evt |
| Size (bytes) | 438,436,800 | 89,876,160 |
| Size | 418.1 MB | 85.7 MB |
| Events in quadrant A | 2,577,075 | 599,957 |
| Events in quadrant B | 3,051,334 | 597,716 |
| Events in quadrant C | 2,840,947 | 593,286 |
| Events in quadrant D | 4,445,342 | 556,051 |
| Mode M0 | |||
|---|---|---|---|
| Quadrant | BADHDUFLAG | Total packets | Discarded packets |
| A | 0 | 11346 | 3 |
| B | 0 | 12553 | 2 |
| C | 0 | 11666 | 2 |
| D | 0 | 16957 | 2 |
| Mode SS | |||
|---|---|---|---|
| Quadrant | BADHDUFLAG | Total packets | Discarded packets |
| A | 0 | 110 | 0 |
| B | 0 | 110 | 0 |
| C | 0 | 110 | 0 |
| D | 0 | 110 | 0 |
| Mode M9 | |||
|---|---|---|---|
| Quadrant | BADHDUFLAG | Total packets | Discarded packets |
| A | 0 | 23 | 0 |
| B | 0 | 23 | 0 |
| C | 0 | 23 | 0 |
| D | 0 | 24 | 0 |
| Quadrant | Total seconds | Saturated seconds | Saturation percentage |
|---|---|---|---|
| A | 5347 | 11 | 0.205723% |
| B | 5347 | 173 | 3.235459% |
| C | 5347 | 78 | 1.458762% |
| D | 5347 | 138 | 2.580886% |
Noise dominated data is calculated using 1-second bins in cleaned event files. If a bin has >2000 counts, and if more than 50% of those come from <1% of pixels, then it is considered to be noise-dominated and hence unusable.
| Quadrant | # 1 sec bins | Bins with >0 counts | Bins with >2000 counts | High rate bins dominated by noise | Noise dominated (total time) | Noise dominated (detector-on time) | Marked lightcurve |
|---|---|---|---|---|---|---|---|
| A | 7050 | 5348 | 0 | 0 | 0.00% | 0.00% | 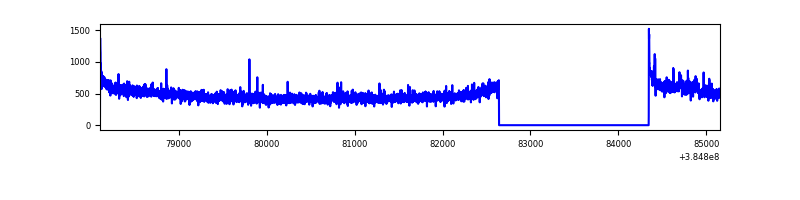 |
| B | 7049 | 5347 | 103 | 103 | 1.46% | 1.93% | 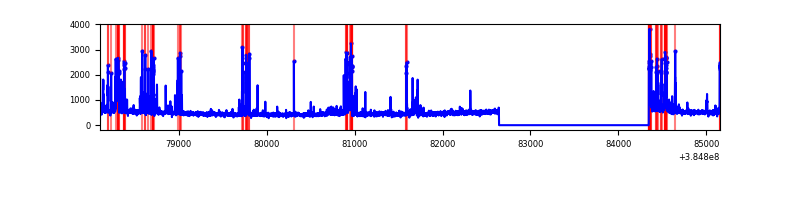 |
| C | 7050 | 5348 | 59 | 59 | 0.84% | 1.10% | 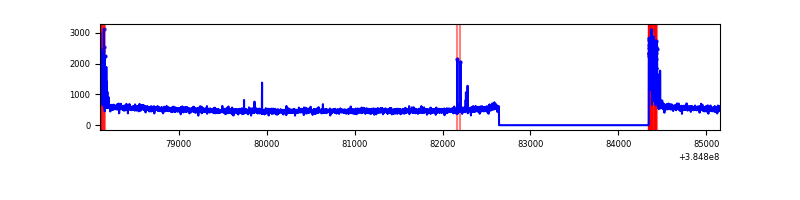 |
| D | 7050 | 5348 | 124 | 124 | 1.76% | 2.32% | 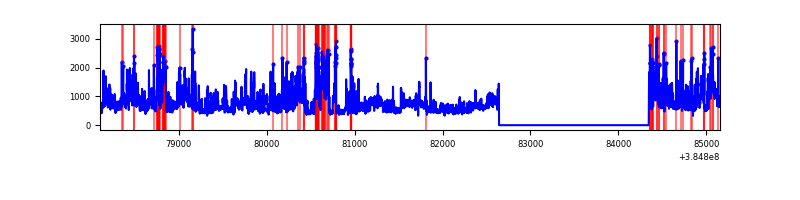 |
Top three noisy pixels from each quadrant. If the there are fewer than three noisy pixels in the level2.evt file, extra rows are filled as -1
| Pixel properties | Quadrant properties | ||||||
|---|---|---|---|---|---|---|---|
| Quadrant | DetID | PixID | Counts | Sigma | Mean | Median | Sigma |
| A | 10 | 83 | 61555 | 476.98 | 634 | 623 | 127.7 |
| A | 15 | 169 | 39919 | 307.61 | 634 | 623 | 127.7 |
| A | 13 | 6 | 13937 | 104.22 | 634 | 623 | 127.7 |
| B | 5 | 172 | 507181 | 4282.2 | 620 | 603 | 118.3 |
| B | 0 | 190 | 54848 | 458.54 | 620 | 603 | 118.3 |
| B | 5 | 255 | 17478 | 142.65 | 620 | 603 | 118.3 |
| C | 15 | 214 | 225040 | 1567.1 | 617 | 622 | 143.2 |
| C | 0 | 10 | 194422 | 1353.3 | 617 | 622 | 143.2 |
| C | 12 | 250 | 10669 | 70.16 | 617 | 622 | 143.2 |
| D | 8 | 195 | 956061 | 6287.29 | 616 | 599 | 152.0 |
| D | 13 | 249 | 341419 | 2242.72 | 616 | 599 | 152.0 |
| D | 8 | 230 | 248489 | 1631.21 | 616 | 599 | 152.0 |
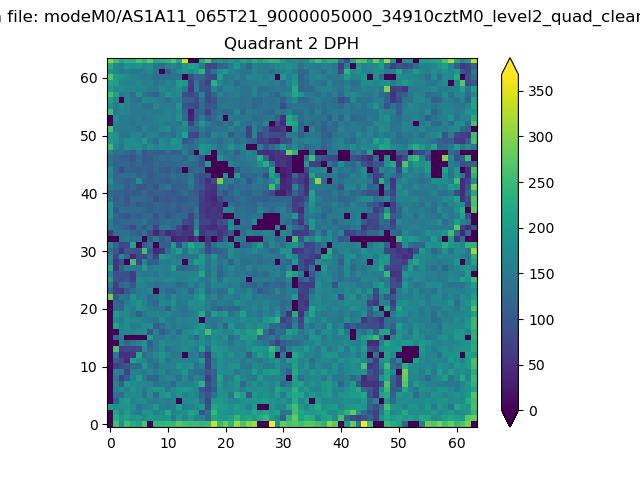
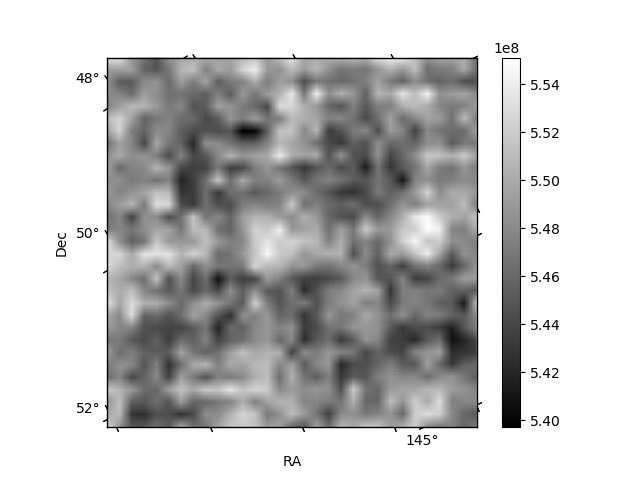
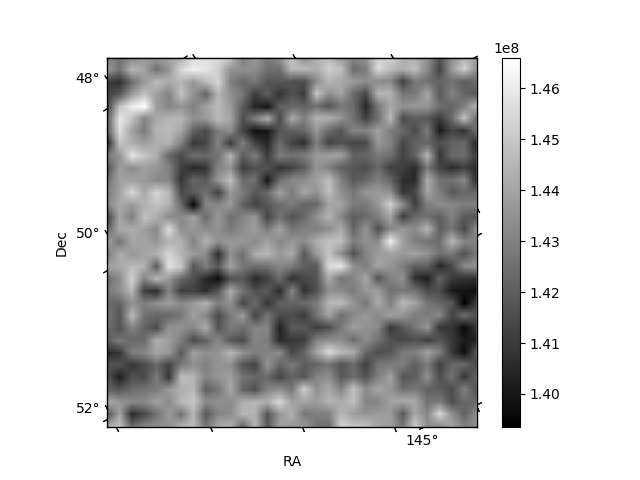
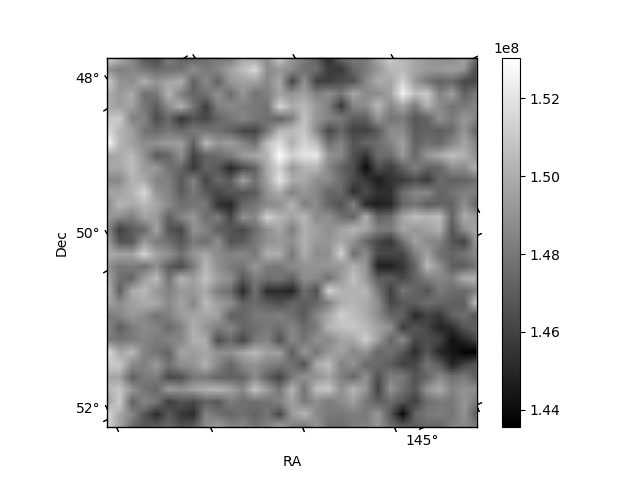
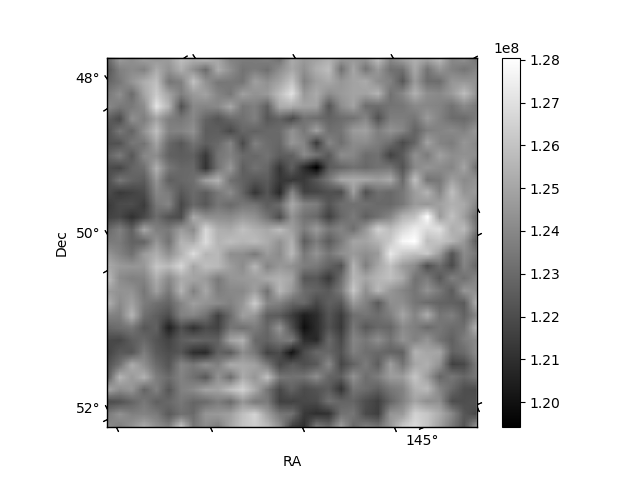
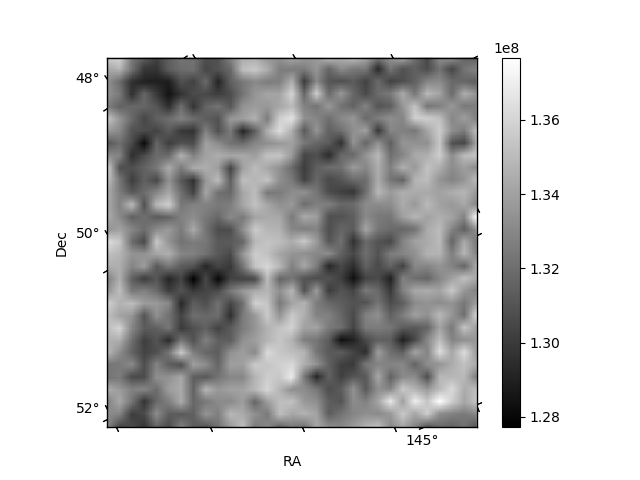
Histogram calculated using DETX and DETY for each event in the final _common_clean file
| Quadrant A | 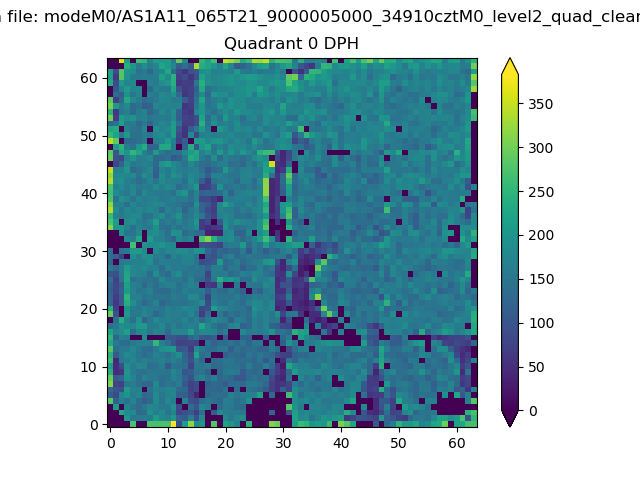 |
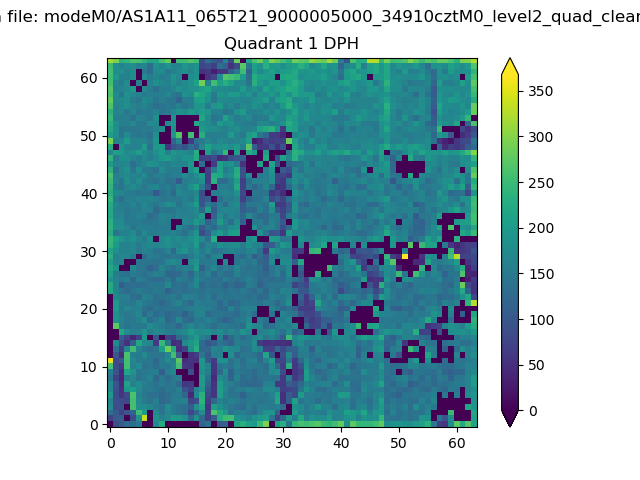 |
Quadrant B |
|---|---|---|---|
| Quadrant D | 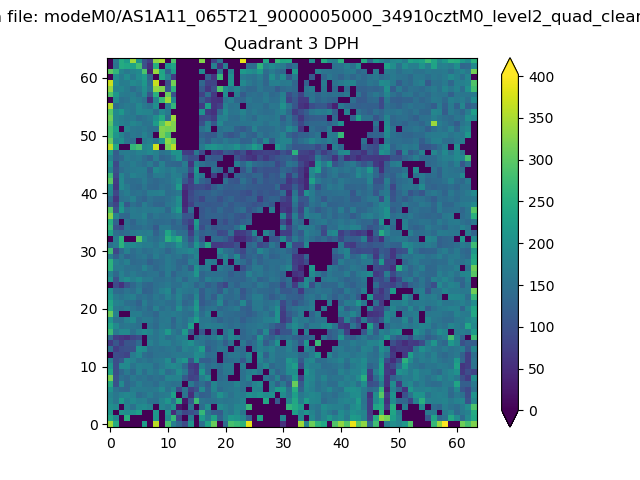 |
 |
Quadrant C |
| Plot type | Count rate plots | Images |
|---|---|---|
| Comparison with Poisson distribution Blue bars denote a histogram of data divided into 1 sec bins. Red curve is a Poisson curve with rate = median count rate of data. |
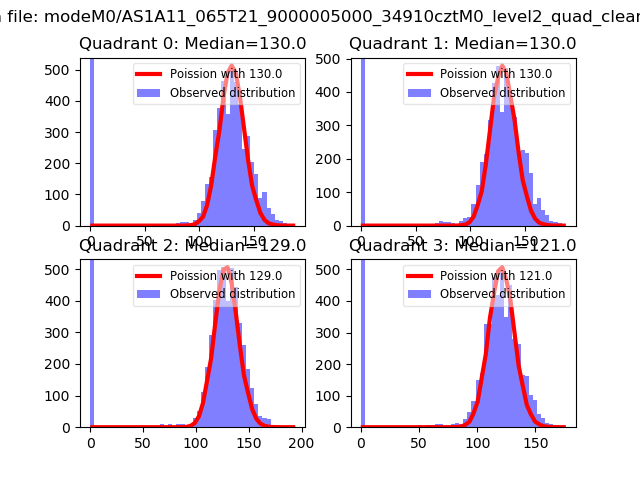 |
 |
| Quadrant-wise count rates Data is divided into 100 sec bins |
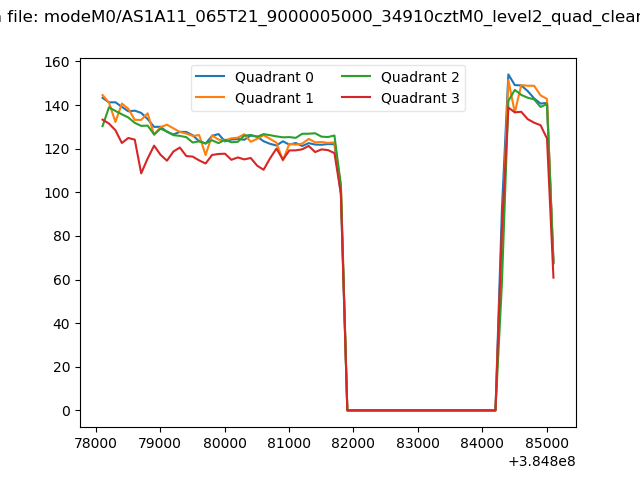 |
|
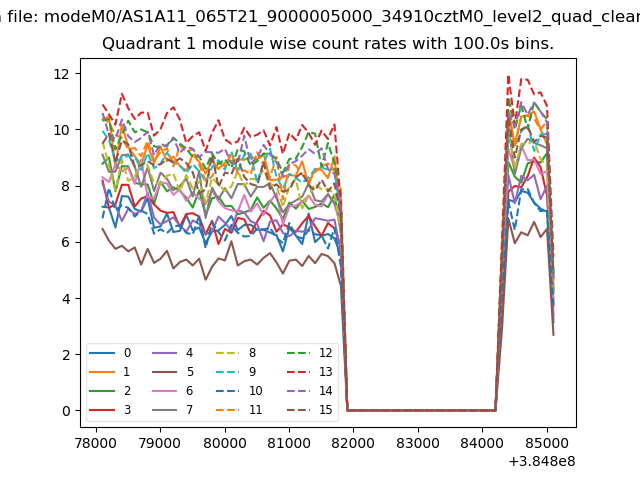
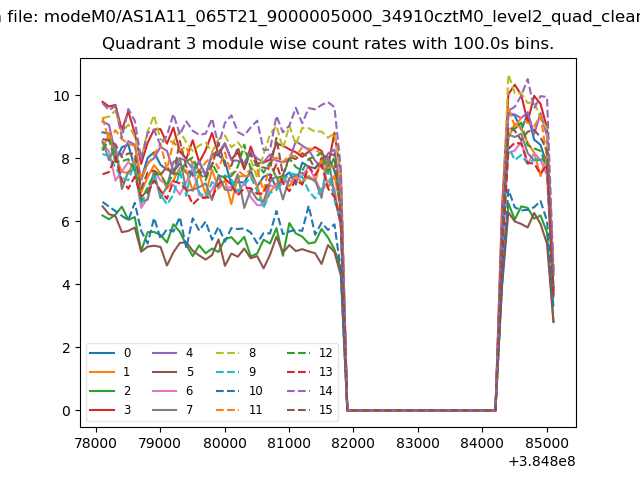
| Module-wise count rates for Quadrant A Data is divided into 100 sec bins |
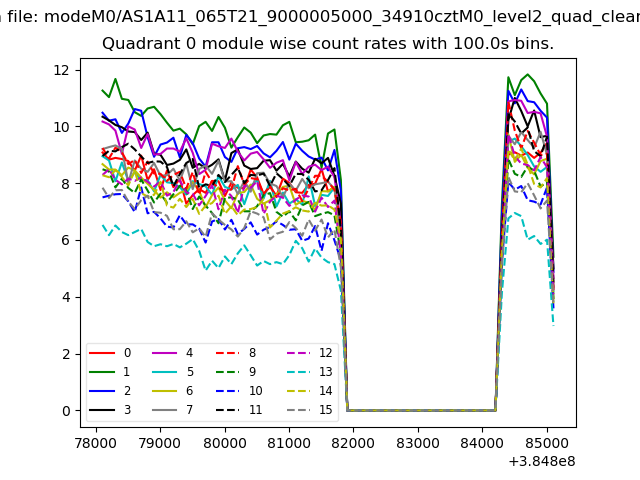 |
 |
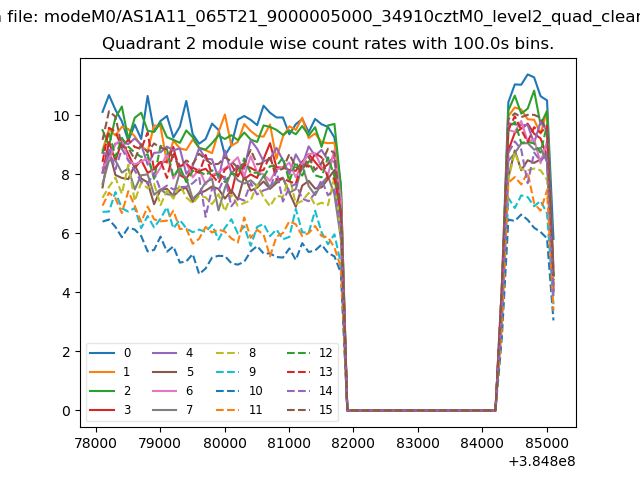
| Module-wise count rates for Quadrant B Data is divided into 100 sec bins |
 |
 |
| Module-wise count rates for Quadrant C Data is divided into 100 sec bins |
 |
 |
| Module-wise count rates for Quadrant D Data is divided into 100 sec bins |
 |
 |
| Parameter | Plot |
|---|---|
| CZT HV Monitor | 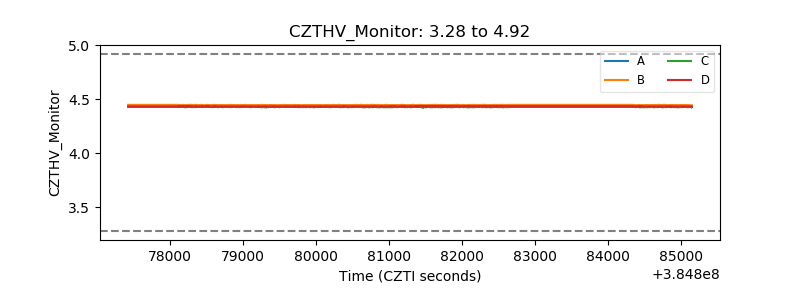 |
| D_VDD | 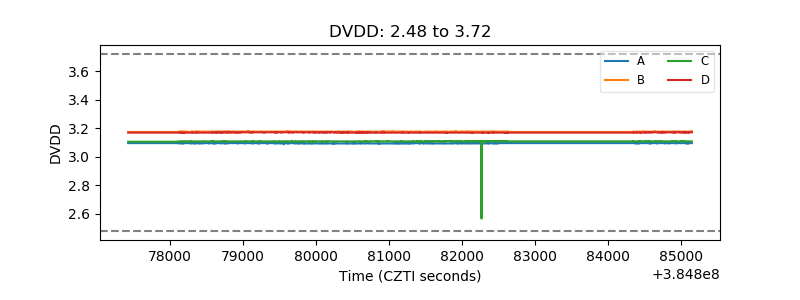 |
| Temperature 1 | 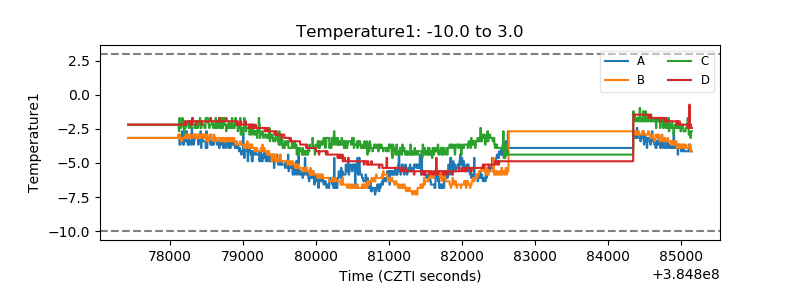 |
| Veto HV Monitor | 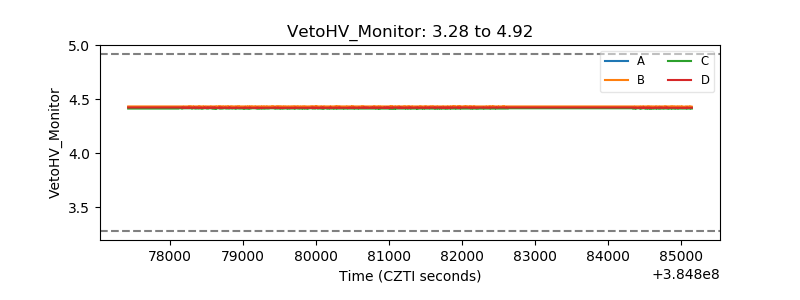 |
| Veto LLD | 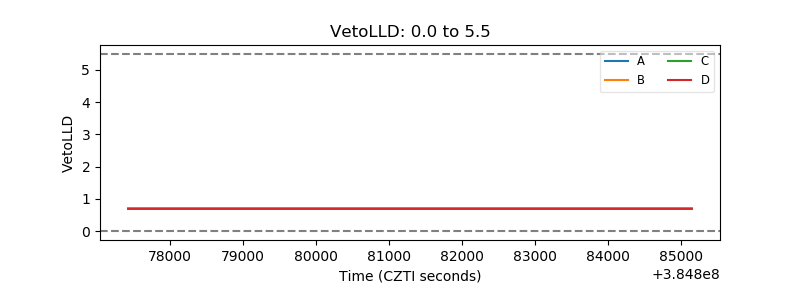 |
| Alpha Counter | 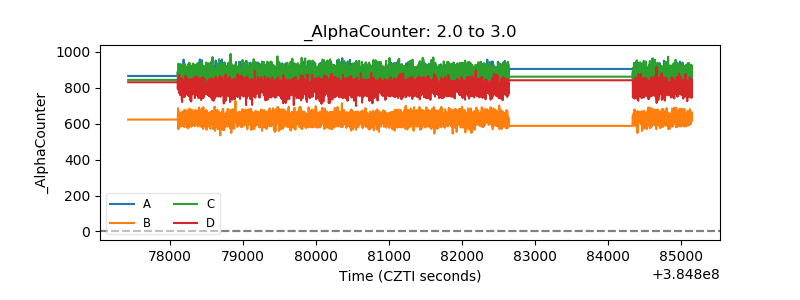 |
| _CPM_Rate | 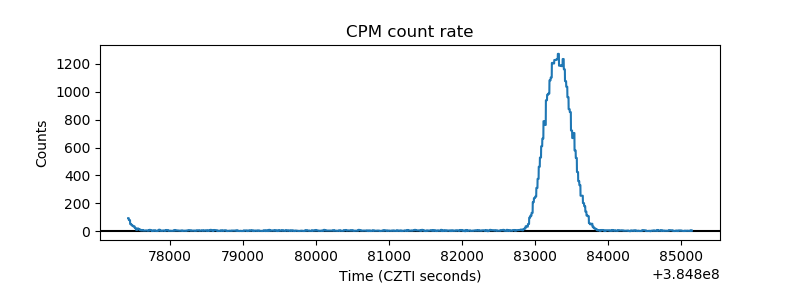 |
| CZT Counter | 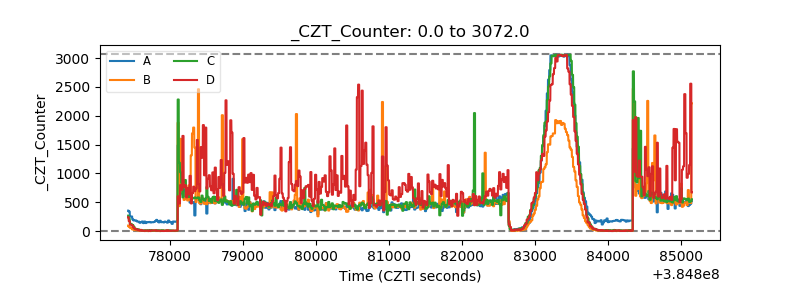 |
| +2.5 Volts monitor | 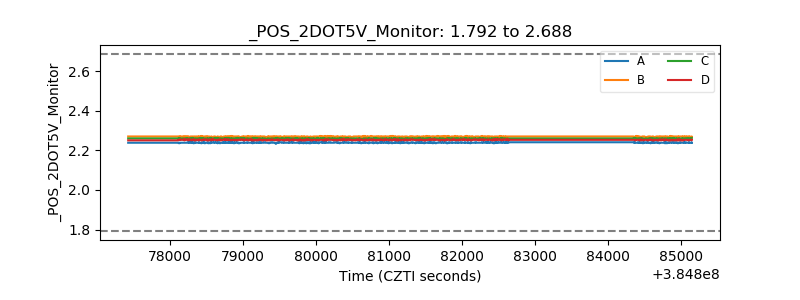 |
| +5 Volts monitor | 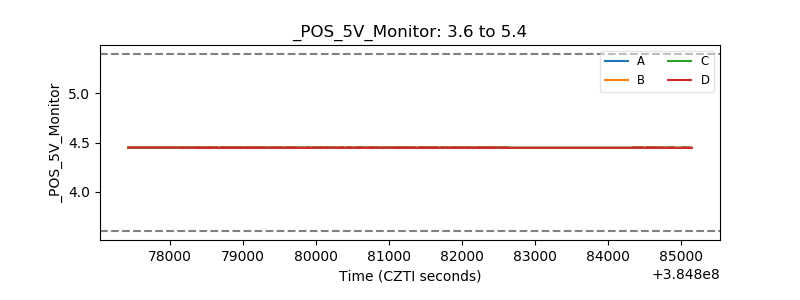 |
| _ROLL_ROT | 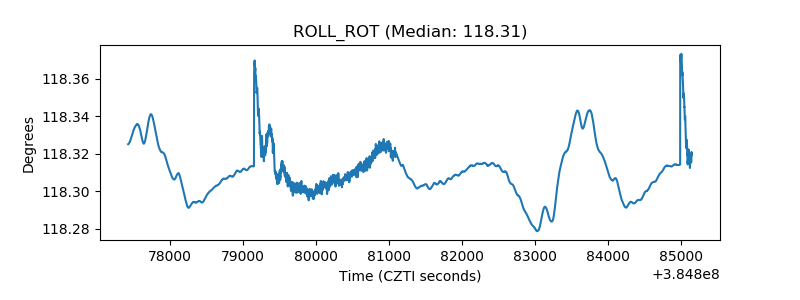 |
| _Roll_DEC | 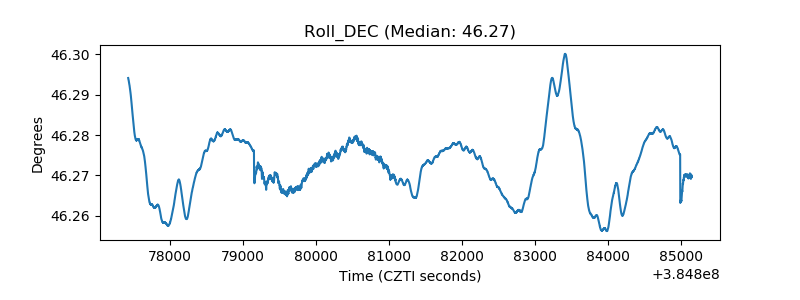 |
| _Roll_RA | 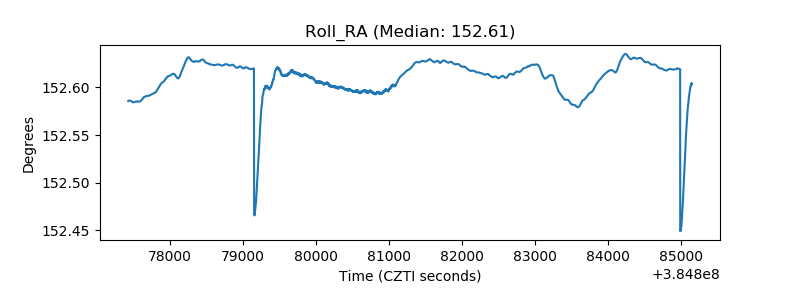 |
| Veto Counter | 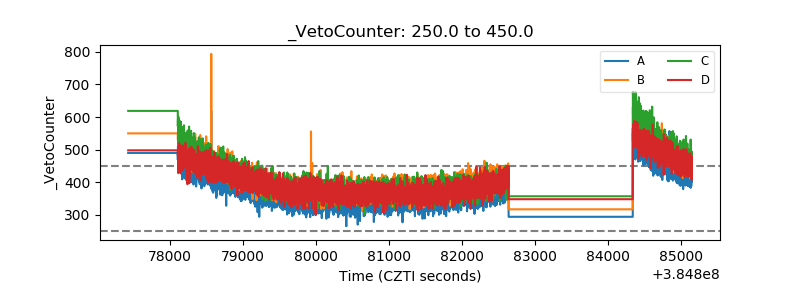 |