| Param | Original file | Final file |
|---|---|---|
| Filename | modeM0/AS1A11_065T05_9000004998_34903cztM0_level2.evt | modeM0/AS1A11_065T05_9000004998_34903cztM0_level2_quad_clean.evt |
| Size (bytes) | 413,576,640 | 57,136,320 |
| Size | 394.4 MB | 54.5 MB |
| Events in quadrant A | 2,498,524 | 344,856 |
| Events in quadrant B | 3,342,343 | 351,107 |
| Events in quadrant C | 2,822,887 | 340,668 |
| Events in quadrant D | 3,503,356 | 323,928 |
| Mode M9 | |||
|---|---|---|---|
| Quadrant | BADHDUFLAG | Total packets | Discarded packets |
| A | 0 | 38 | 0 |
| B | 0 | 38 | 0 |
| C | 0 | 38 | 0 |
| D | 0 | 38 | 0 |
| Mode SS | |||
|---|---|---|---|
| Quadrant | BADHDUFLAG | Total packets | Discarded packets |
| A | 0 | 112 | 0 |
| B | 0 | 112 | 0 |
| C | 0 | 112 | 0 |
| D | 0 | 112 | 0 |
| Mode M0 | |||
|---|---|---|---|
| Quadrant | BADHDUFLAG | Total packets | Discarded packets |
| A | 0 | 10795 | 3 |
| B | 0 | 13388 | 2 |
| C | 0 | 11392 | 2 |
| D | 0 | 14037 | 2 |
| Quadrant | Total seconds | Saturated seconds | Saturation percentage |
|---|---|---|---|
| A | 5261 | 9 | 0.171070% |
| B | 5261 | 164 | 3.117278% |
| C | 5261 | 66 | 1.254514% |
| D | 5261 | 61 | 1.159475% |
Noise dominated data is calculated using 1-second bins in cleaned event files. If a bin has >2000 counts, and if more than 50% of those come from <1% of pixels, then it is considered to be noise-dominated and hence unusable.
| Quadrant | # 1 sec bins | Bins with >0 counts | Bins with >2000 counts | High rate bins dominated by noise | Noise dominated (total time) | Noise dominated (detector-on time) | Marked lightcurve |
|---|---|---|---|---|---|---|---|
| A | 9148 | 5263 | 3 | 3 | 0.03% | 0.06% | 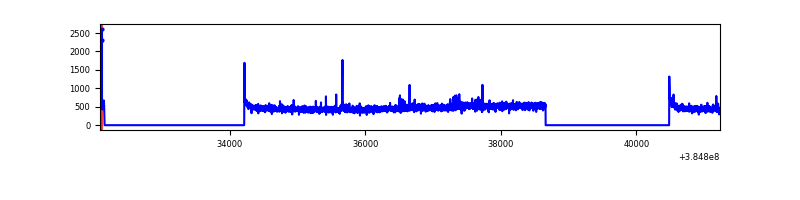 |
| B | 9148 | 5263 | 121 | 121 | 1.32% | 2.30% | 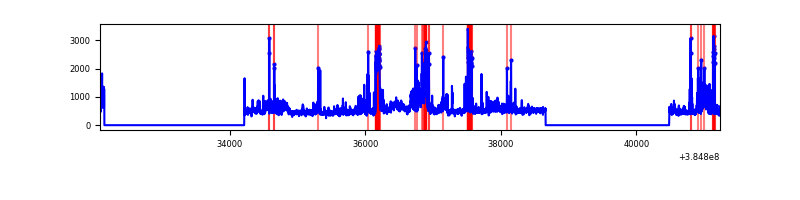 |
| C | 9148 | 5263 | 54 | 54 | 0.59% | 1.03% | 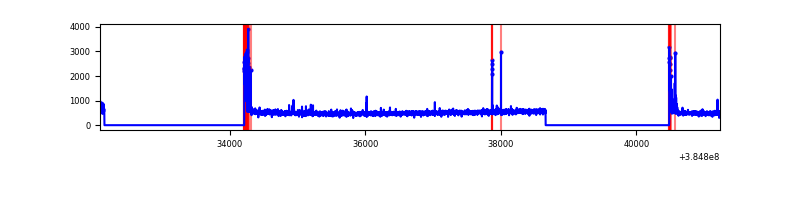 |
| D | 9148 | 5263 | 53 | 53 | 0.58% | 1.01% | 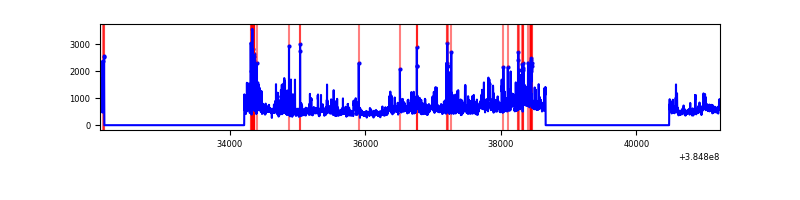 |
Top three noisy pixels from each quadrant. If the there are fewer than three noisy pixels in the level2.evt file, extra rows are filled as -1
| Pixel properties | Quadrant properties | ||||||
|---|---|---|---|---|---|---|---|
| Quadrant | DetID | PixID | Counts | Sigma | Mean | Median | Sigma |
| A | 10 | 83 | 58622 | 466.79 | 614 | 600 | 124.3 |
| A | 15 | 169 | 41006 | 325.07 | 614 | 600 | 124.3 |
| A | 13 | 6 | 11273 | 85.86 | 614 | 600 | 124.3 |
| B | 5 | 172 | 420774 | 3600.96 | 606 | 590 | 116.7 |
| B | 5 | 200 | 276365 | 2363.38 | 606 | 590 | 116.7 |
| B | 0 | 190 | 150843 | 1287.66 | 606 | 590 | 116.7 |
| C | 15 | 214 | 240256 | 1712.05 | 598 | 602 | 140.0 |
| C | 0 | 10 | 188090 | 1339.38 | 598 | 602 | 140.0 |
| C | 14 | 67 | 23301 | 162.15 | 598 | 602 | 140.0 |
| D | 8 | 195 | 774550 | 5288.53 | 594 | 577 | 146.3 |
| D | 1 | 52 | 97187 | 660.13 | 594 | 577 | 146.3 |
| D | 2 | 250 | 85542 | 580.56 | 594 | 577 | 146.3 |
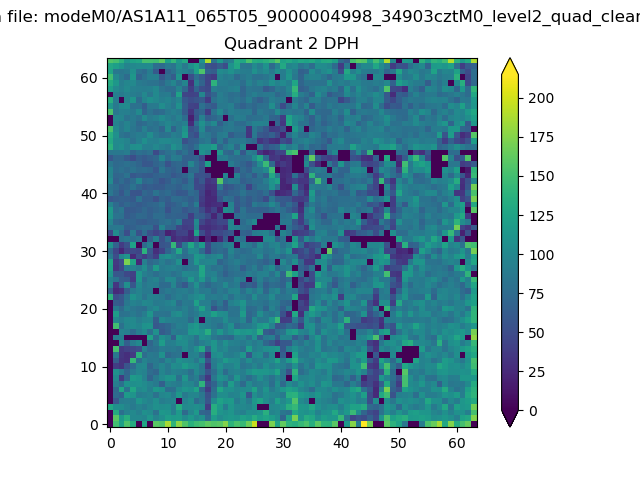
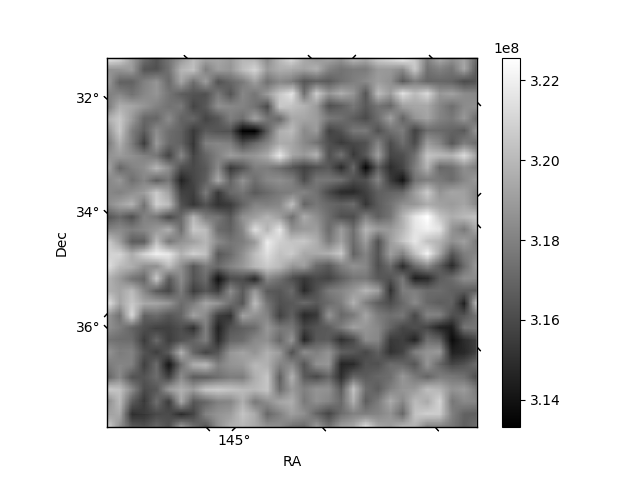
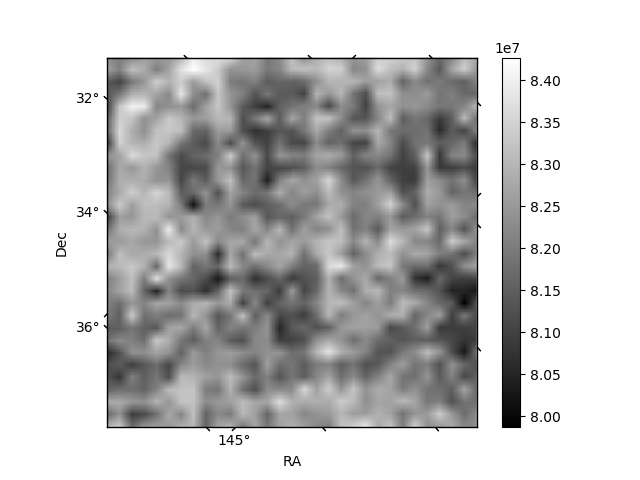
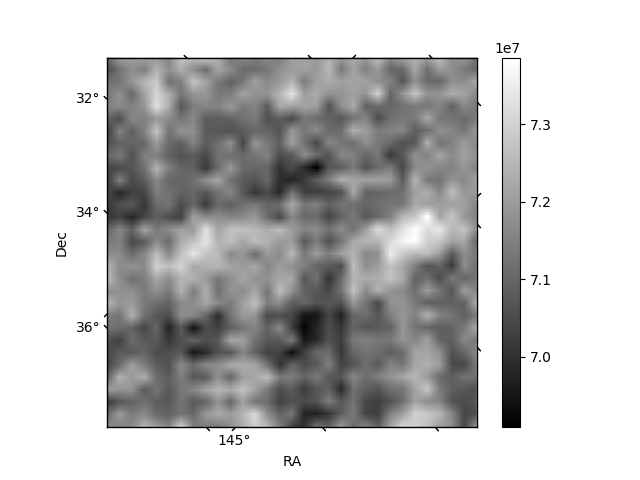
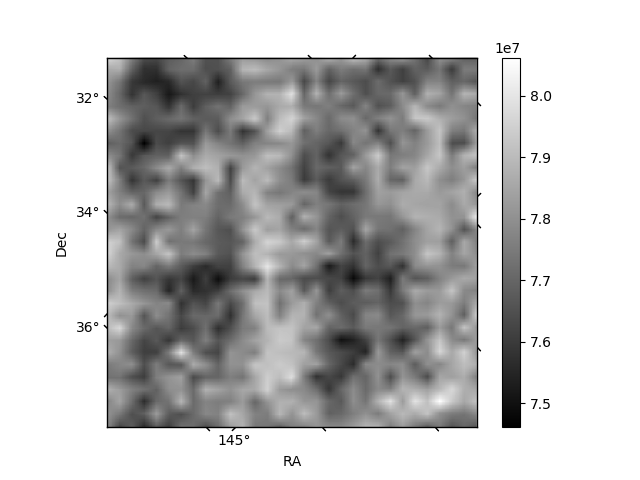
Histogram calculated using DETX and DETY for each event in the final _common_clean file
| Quadrant A | 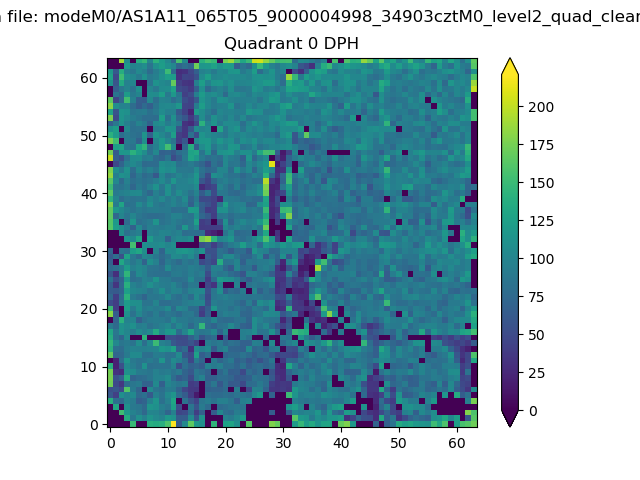 |
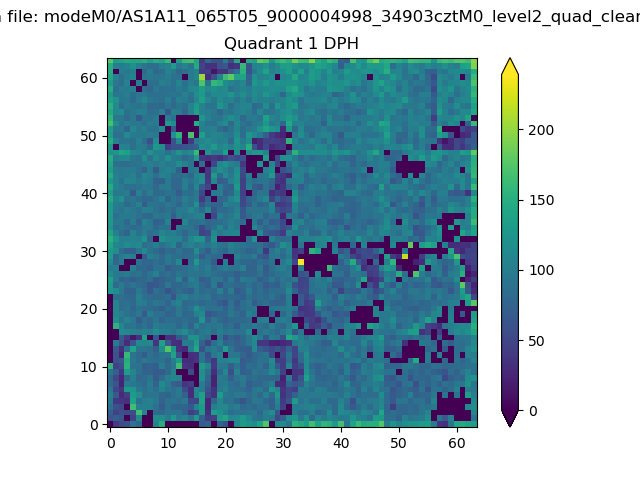 |
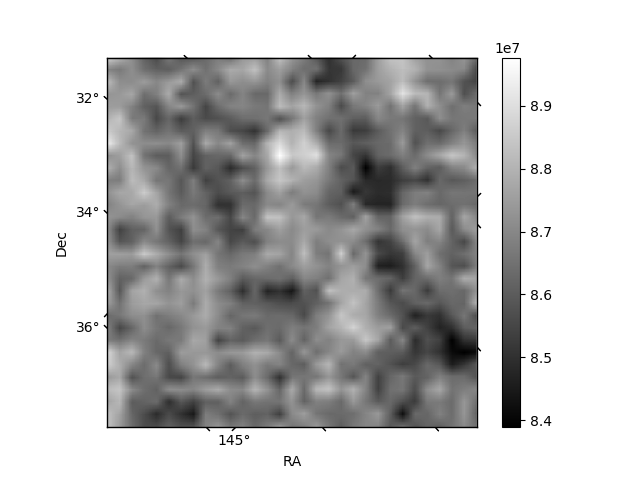
Quadrant B |
|---|---|---|---|
| Quadrant D | 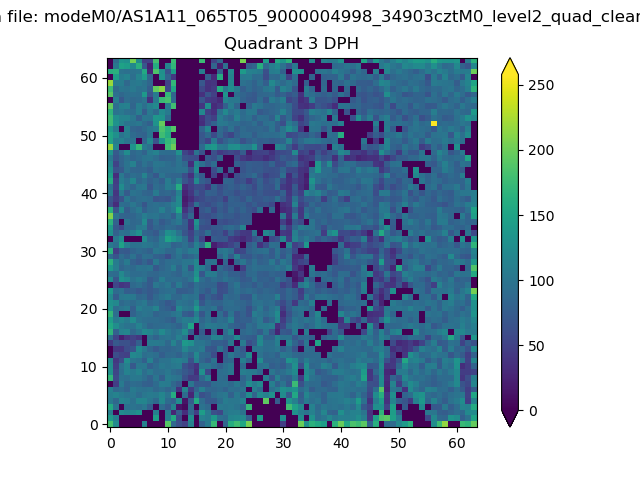 |
 |
Quadrant C |
| Plot type | Count rate plots | Images |
|---|---|---|
| Comparison with Poisson distribution Blue bars denote a histogram of data divided into 1 sec bins. Red curve is a Poisson curve with rate = median count rate of data. |
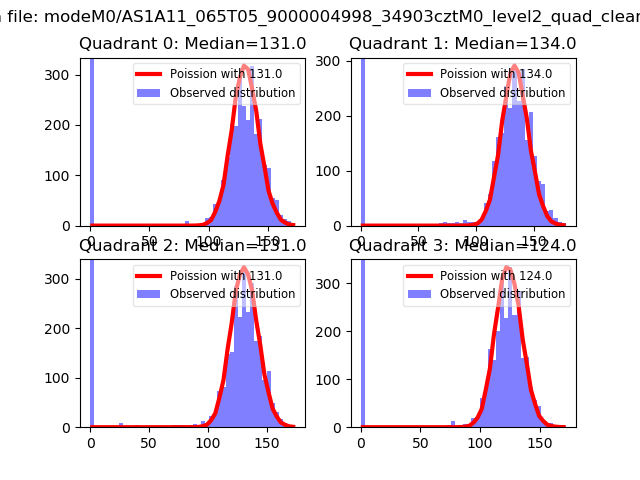 |
 |
| Quadrant-wise count rates Data is divided into 100 sec bins |
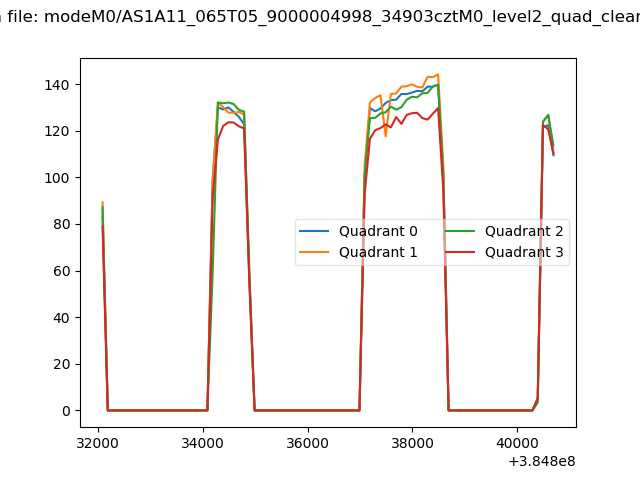 |
|
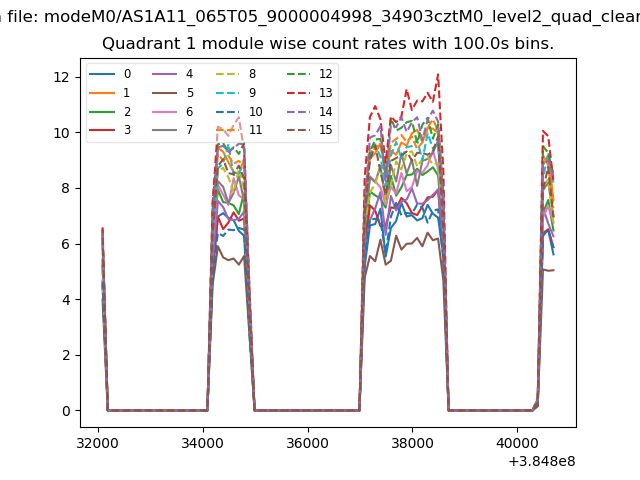
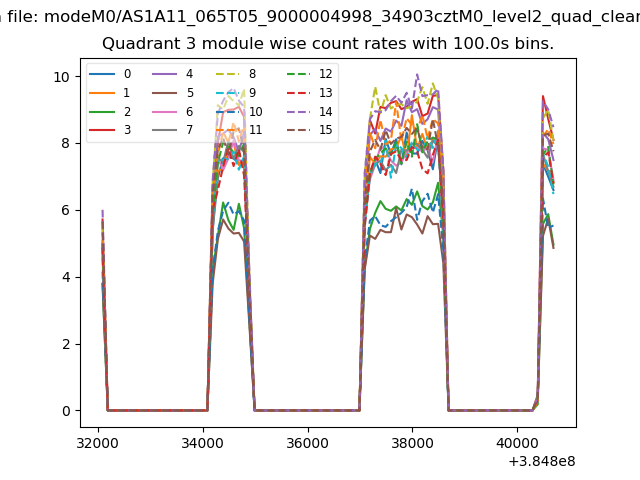
| Module-wise count rates for Quadrant A Data is divided into 100 sec bins |
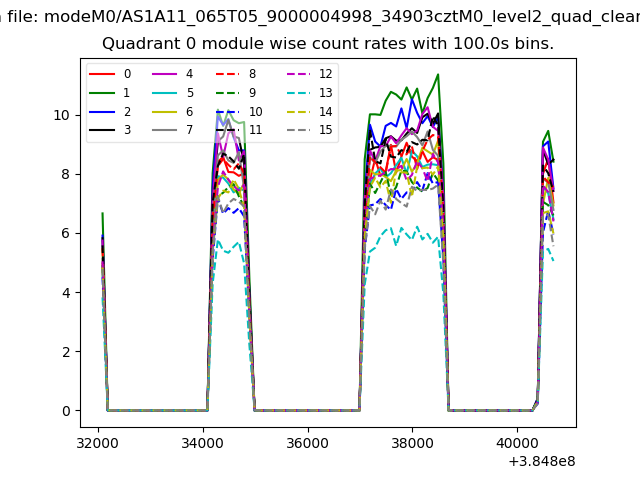 |
 |
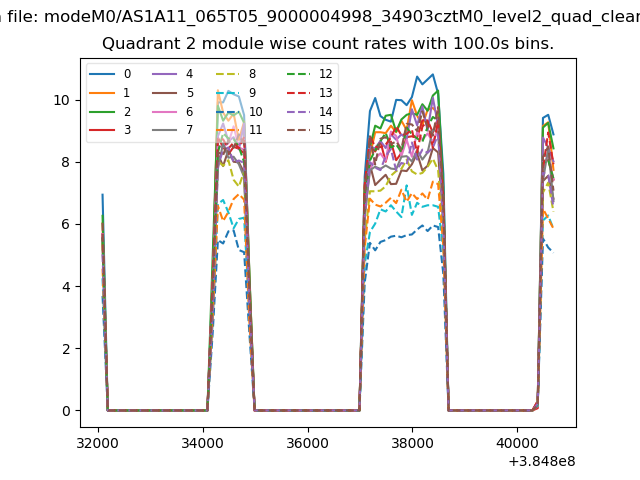
| Module-wise count rates for Quadrant B Data is divided into 100 sec bins |
 |
 |
| Module-wise count rates for Quadrant C Data is divided into 100 sec bins |
 |
 |
| Module-wise count rates for Quadrant D Data is divided into 100 sec bins |
 |
 |
| Parameter | Plot |
|---|---|
| CZT HV Monitor | 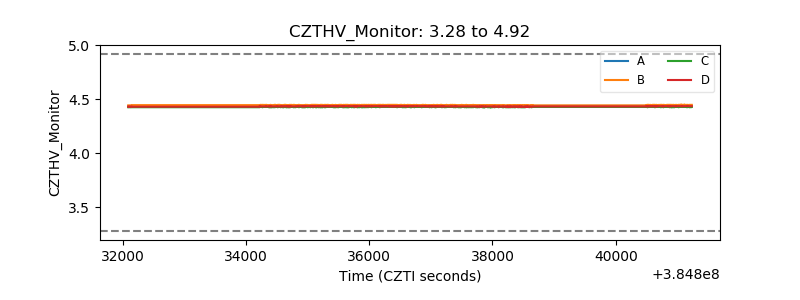 |
| D_VDD | 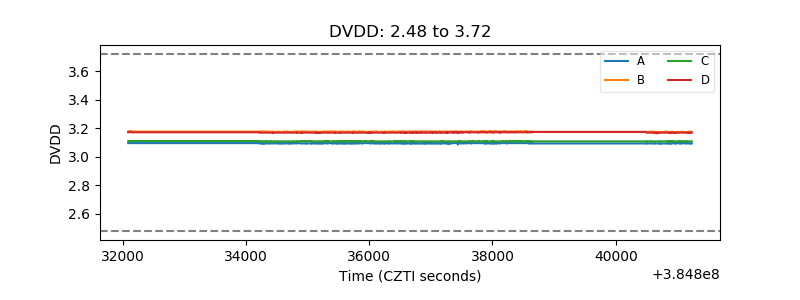 |
| Temperature 1 | 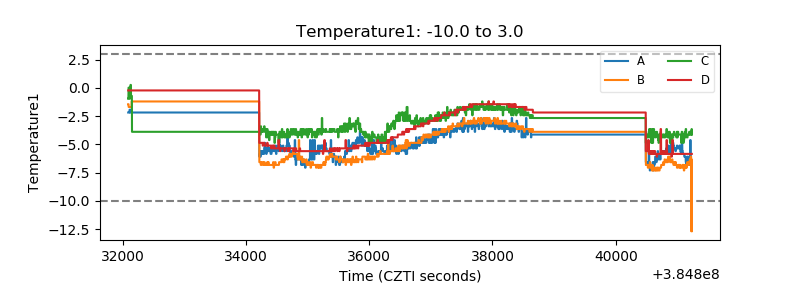 |
| Veto HV Monitor | 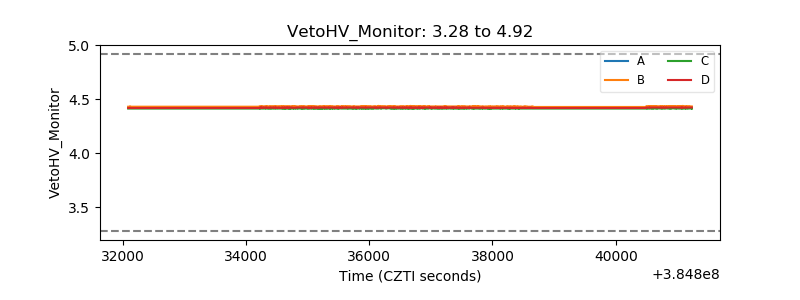 |
| Veto LLD | 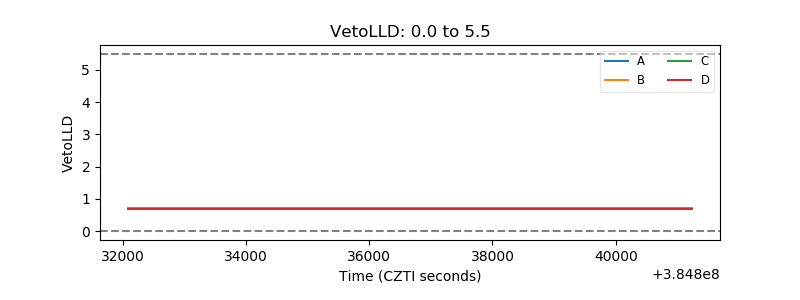 |
| Alpha Counter | 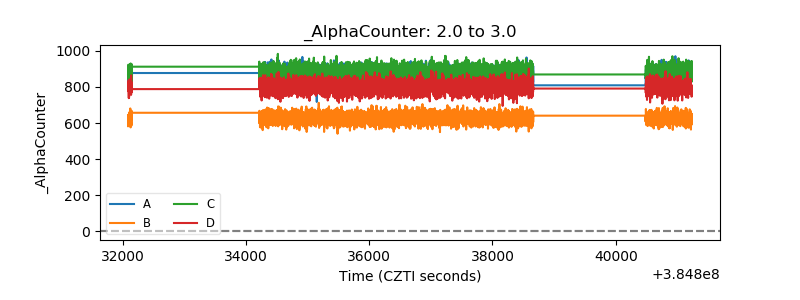 |
| _CPM_Rate | 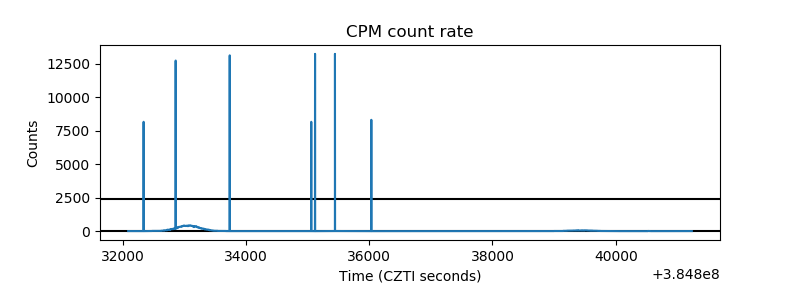 |
| CZT Counter | 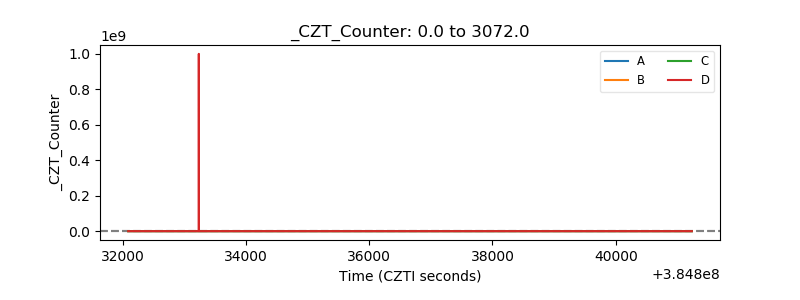 |
| +2.5 Volts monitor | 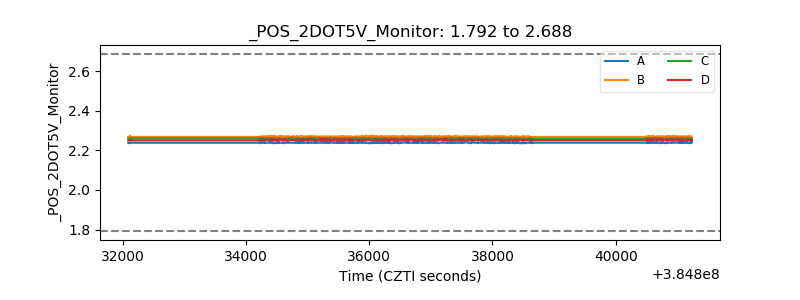 |
| +5 Volts monitor | 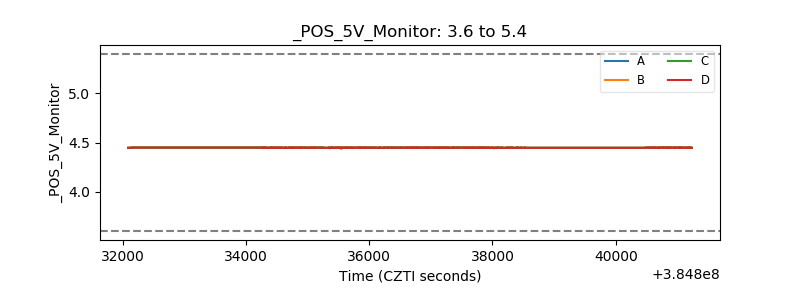 |
| _ROLL_ROT | 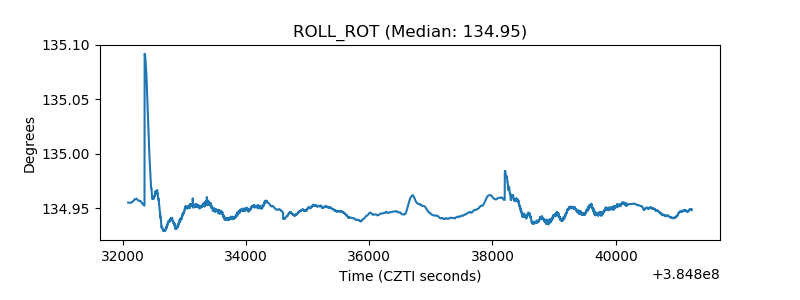 |
| _Roll_DEC | 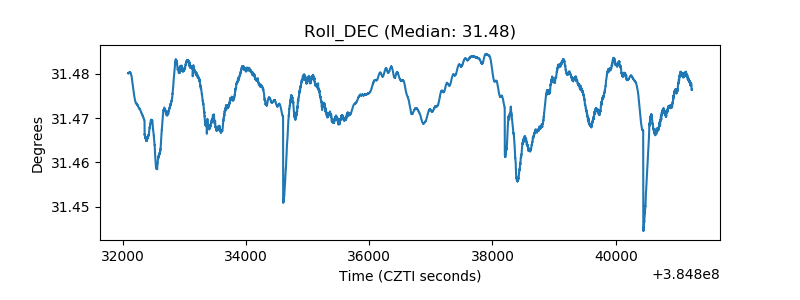 |
| _Roll_RA | 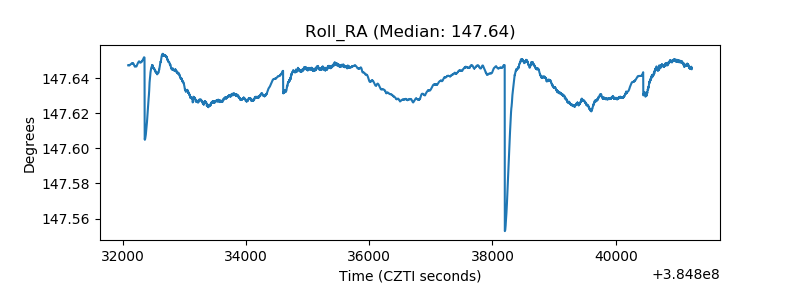 |
| Veto Counter | 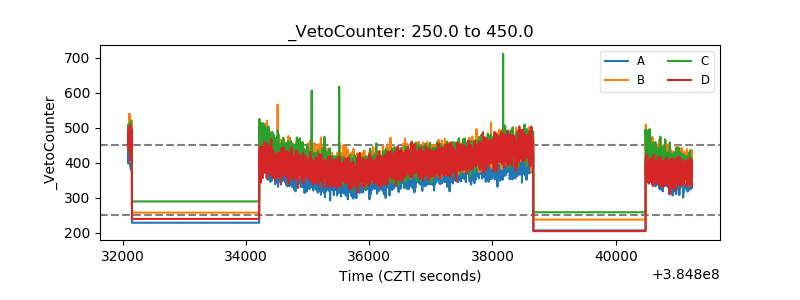 |