| Param | Original file | Final file |
|---|---|---|
| Filename | modeM0/AS1A11_065T05_9000004998_34902cztM0_level2.evt | modeM0/AS1A11_065T05_9000004998_34902cztM0_level2_quad_clean.evt |
| Size (bytes) | 168,609,600 | 31,443,840 |
| Size | 160.8 MB | 30.0 MB |
| Events in quadrant A | 881,891 | 214,381 |
| Events in quadrant B | 1,196,226 | 213,423 |
| Events in quadrant C | 1,060,188 | 210,543 |
| Events in quadrant D | 1,848,559 | 186,736 |
| Mode M9 | |||
|---|---|---|---|
| Quadrant | BADHDUFLAG | Total packets | Discarded packets |
| A | 0 | 20 | 0 |
| B | 0 | 20 | 0 |
| C | 0 | 20 | 0 |
| D | 0 | 20 | 0 |
| Mode SS | |||
|---|---|---|---|
| Quadrant | BADHDUFLAG | Total packets | Discarded packets |
| A | 0 | 38 | 0 |
| B | 0 | 38 | 0 |
| C | 0 | 38 | 0 |
| D | 0 | 38 | 0 |
| Mode M0 | |||
|---|---|---|---|
| Quadrant | BADHDUFLAG | Total packets | Discarded packets |
| A | 0 | 3655 | 2 |
| B | 0 | 4686 | 1 |
| C | 0 | 4157 | 1 |
| D | 0 | 6691 | 1 |
| Quadrant | Total seconds | Saturated seconds | Saturation percentage |
|---|---|---|---|
| A | 1720 | 9 | 0.523256% |
| B | 1720 | 92 | 5.348837% |
| C | 1720 | 52 | 3.023256% |
| D | 1720 | 288 | 16.744186% |
Noise dominated data is calculated using 1-second bins in cleaned event files. If a bin has >2000 counts, and if more than 50% of those come from <1% of pixels, then it is considered to be noise-dominated and hence unusable.
| Quadrant | # 1 sec bins | Bins with >0 counts | Bins with >2000 counts | High rate bins dominated by noise | Noise dominated (total time) | Noise dominated (detector-on time) | Marked lightcurve |
|---|---|---|---|---|---|---|---|
| A | 3784 | 1721 | 6 | 6 | 0.16% | 0.35% | 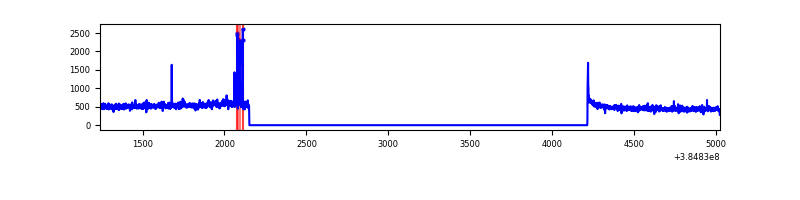 |
| B | 3784 | 1721 | 60 | 60 | 1.59% | 3.49% | 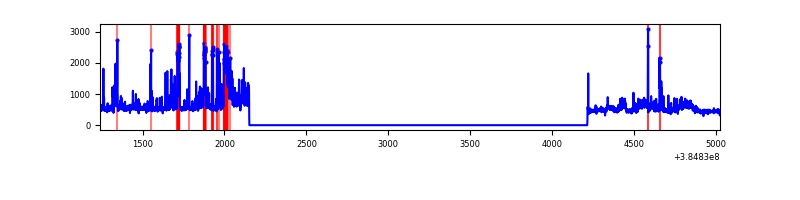 |
| C | 3784 | 1721 | 42 | 42 | 1.11% | 2.44% | 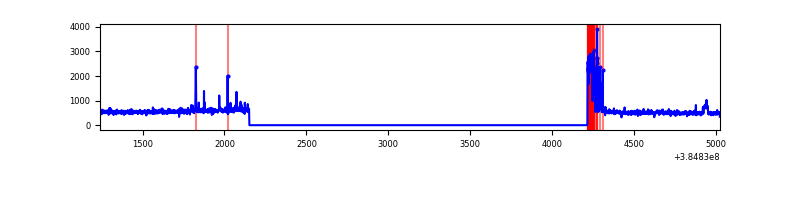 |
| D | 3784 | 1721 | 242 | 242 | 6.40% | 14.06% | 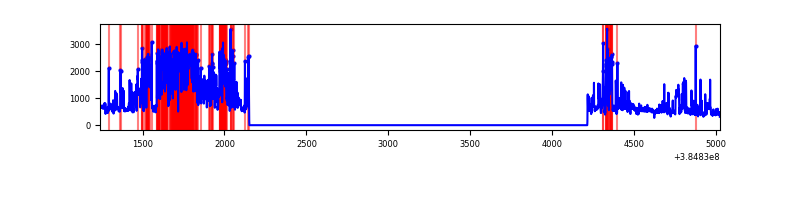 |
Top three noisy pixels from each quadrant. If the there are fewer than three noisy pixels in the level2.evt file, extra rows are filled as -1
| Pixel properties | Quadrant properties | ||||||
|---|---|---|---|---|---|---|---|
| Quadrant | DetID | PixID | Counts | Sigma | Mean | Median | Sigma |
| A | 10 | 83 | 27274 | 608.26 | 212 | 207 | 44.5 |
| A | 15 | 237 | 17699 | 393.09 | 212 | 207 | 44.5 |
| A | 9 | 143 | 5800 | 125.69 | 212 | 207 | 44.5 |
| B | 0 | 190 | 191151 | 4621.92 | 207 | 203 | 41.3 |
| B | 5 | 172 | 87880 | 2122.23 | 207 | 203 | 41.3 |
| B | 5 | 255 | 22958 | 550.79 | 207 | 203 | 41.3 |
| C | 0 | 10 | 127468 | 2596.54 | 205 | 207 | 49.0 |
| C | 15 | 214 | 79400 | 1615.79 | 205 | 207 | 49.0 |
| C | 14 | 67 | 16568 | 333.82 | 205 | 207 | 49.0 |
| D | 12 | 233 | 558368 | 11506.82 | 193 | 188 | 48.5 |
| D | 8 | 195 | 257909 | 5312.89 | 193 | 188 | 48.5 |
| D | 2 | 250 | 78415 | 1612.64 | 193 | 188 | 48.5 |
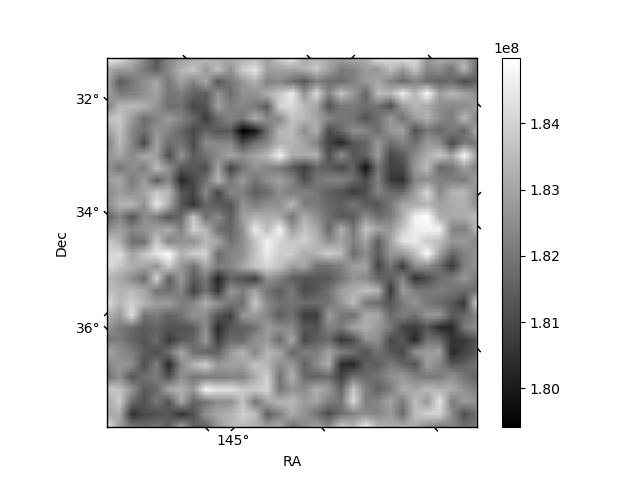
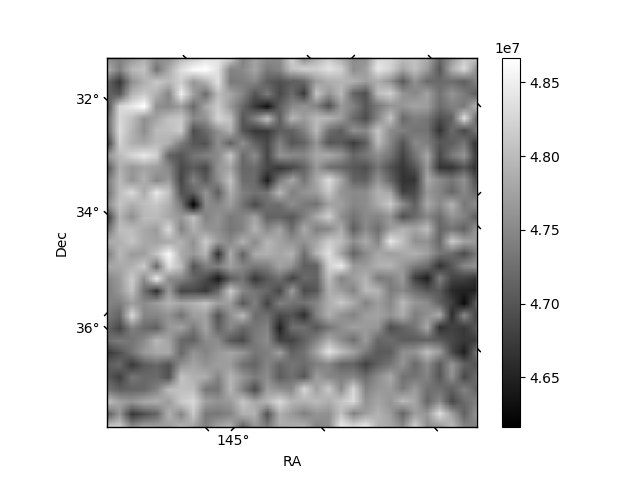
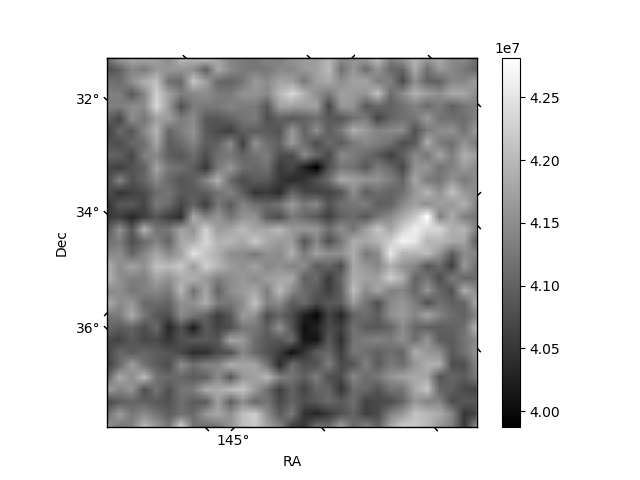
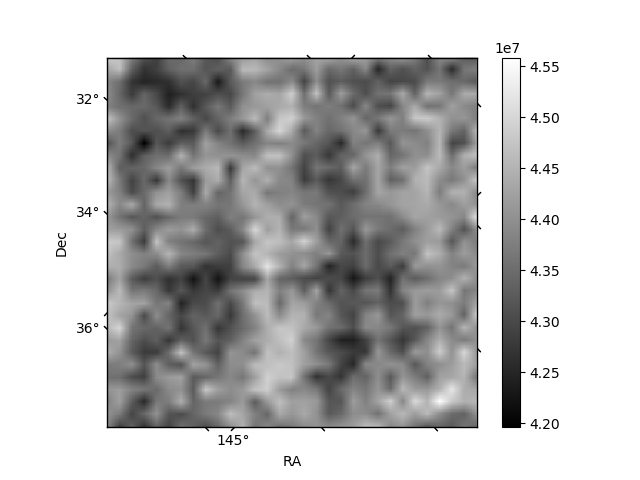
Histogram calculated using DETX and DETY for each event in the final _common_clean file
| Quadrant A | 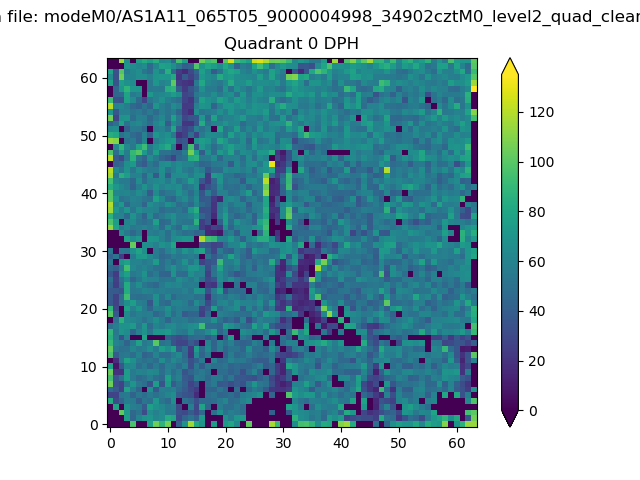 |
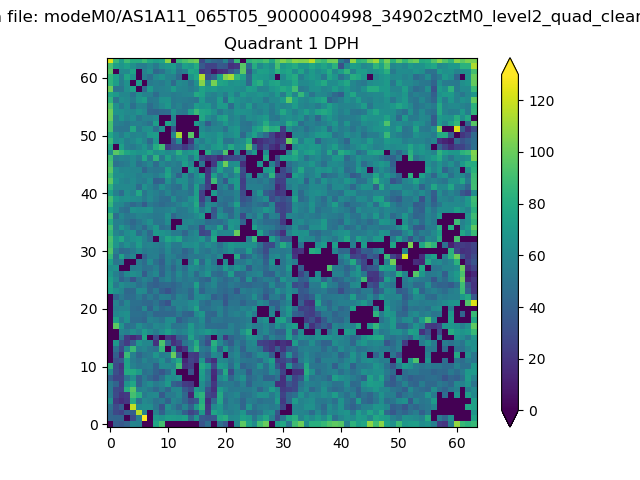 |
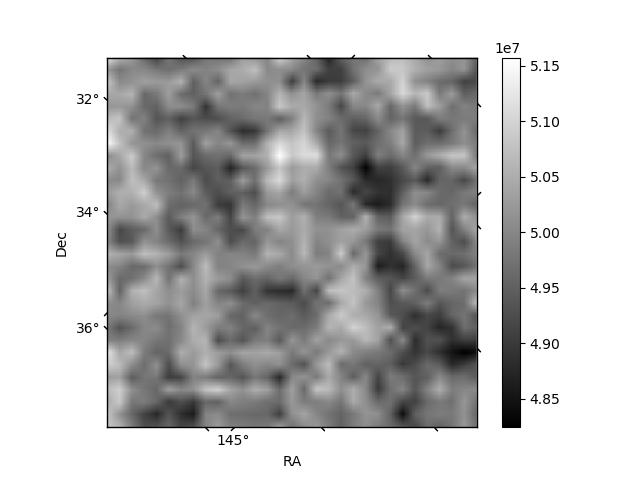
Quadrant B |
|---|---|---|---|
| Quadrant D | 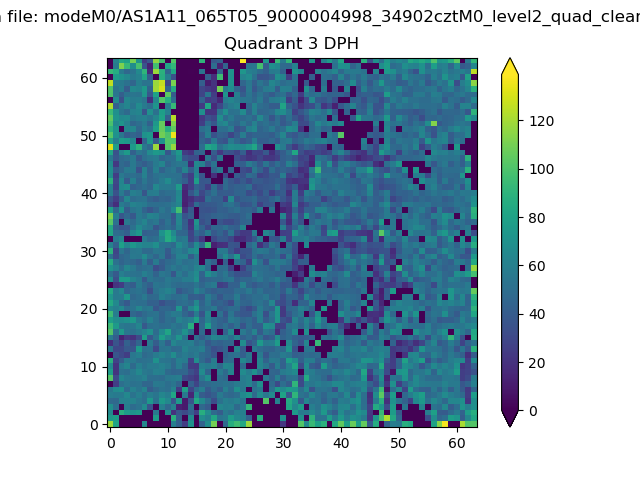 |
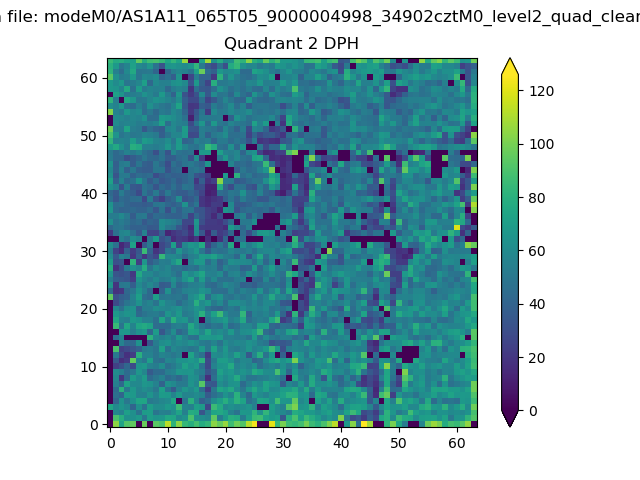 |
Quadrant C |
| Plot type | Count rate plots | Images |
|---|---|---|
| Comparison with Poisson distribution Blue bars denote a histogram of data divided into 1 sec bins. Red curve is a Poisson curve with rate = median count rate of data. |
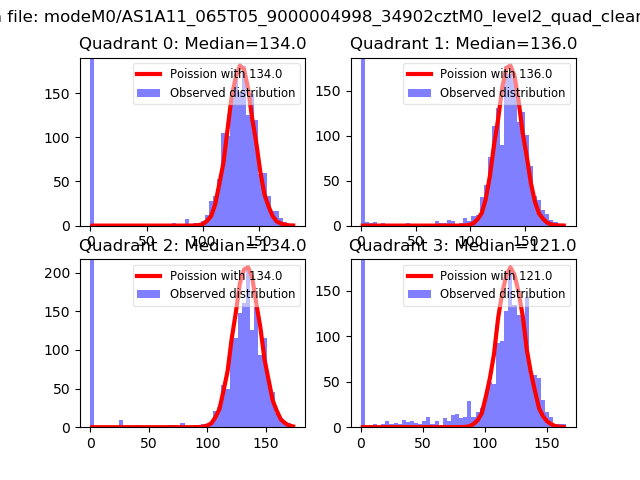 |
 |
| Quadrant-wise count rates Data is divided into 100 sec bins |
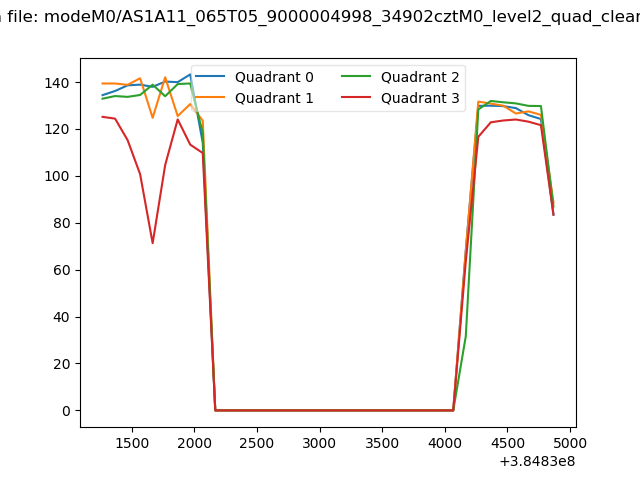 |
|
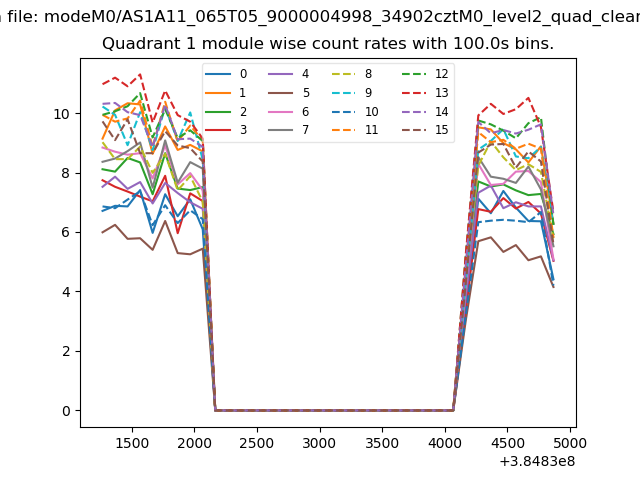
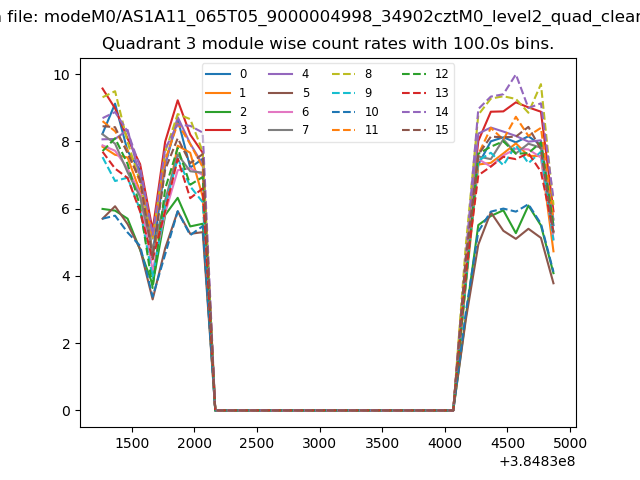
| Module-wise count rates for Quadrant A Data is divided into 100 sec bins |
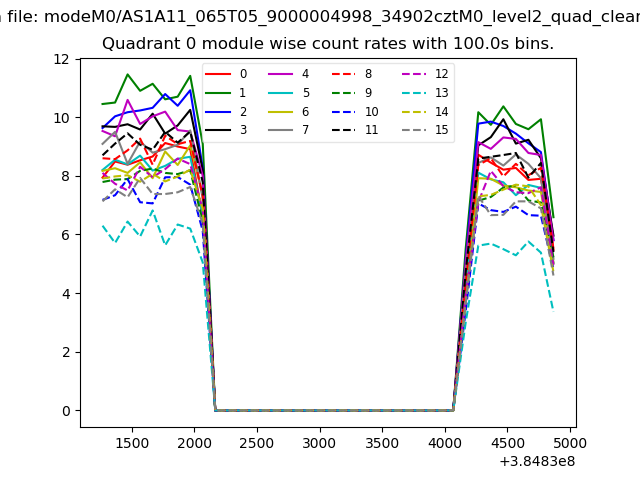 |
 |
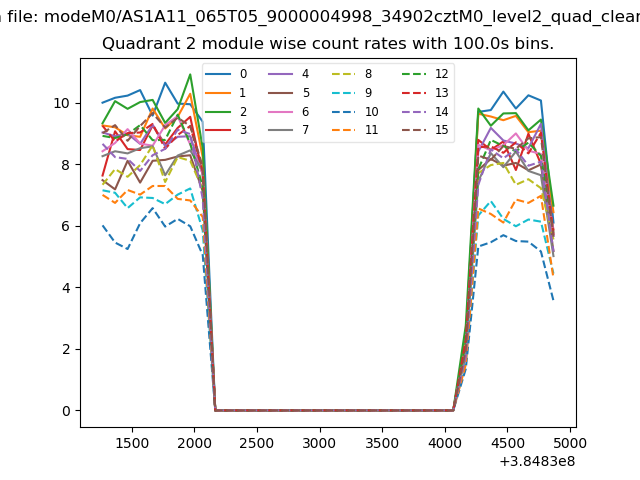
| Module-wise count rates for Quadrant B Data is divided into 100 sec bins |
 |
 |
| Module-wise count rates for Quadrant C Data is divided into 100 sec bins |
 |
 |
| Module-wise count rates for Quadrant D Data is divided into 100 sec bins |
 |
 |
| Parameter | Plot |
|---|---|
| CZT HV Monitor | 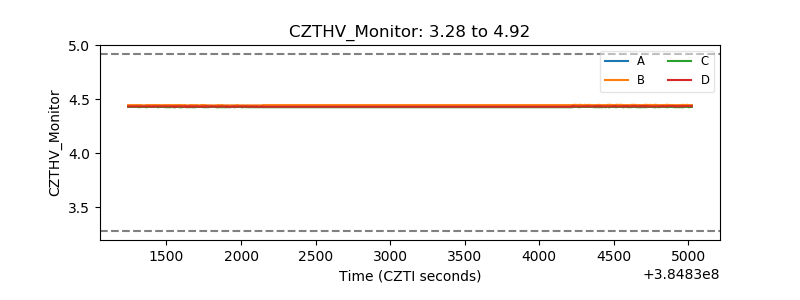 |
| D_VDD | 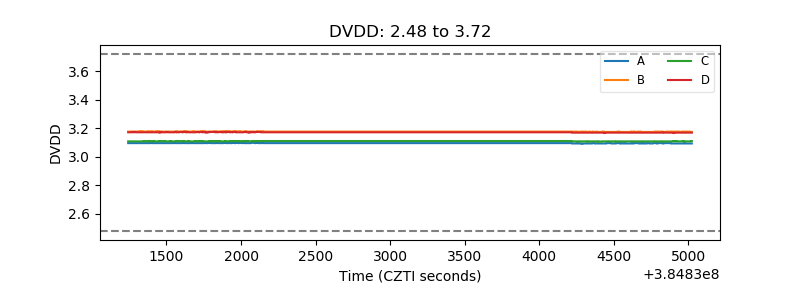 |
| Temperature 1 | 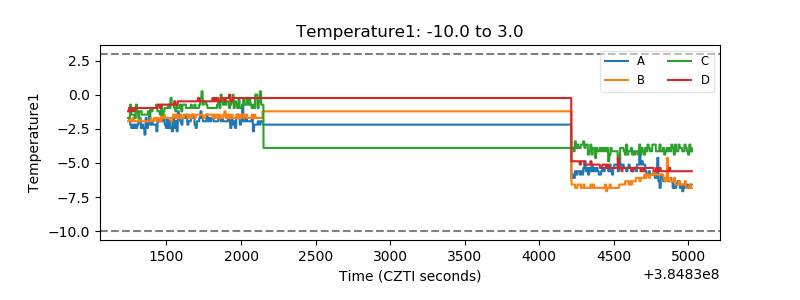 |
| Veto HV Monitor |  |
| Veto LLD | 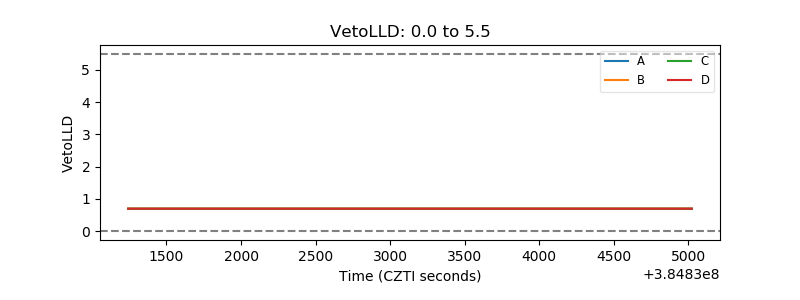 |
| Alpha Counter | 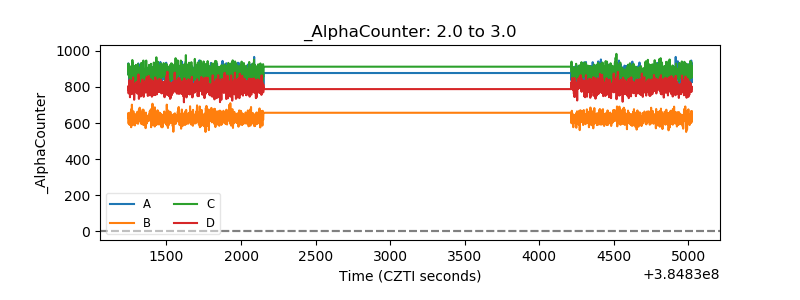 |
| _CPM_Rate | 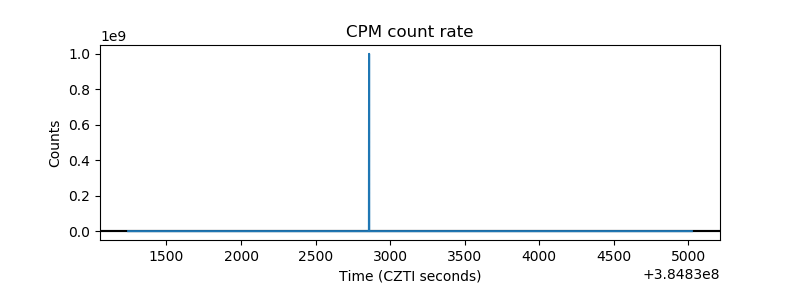 |
| CZT Counter | 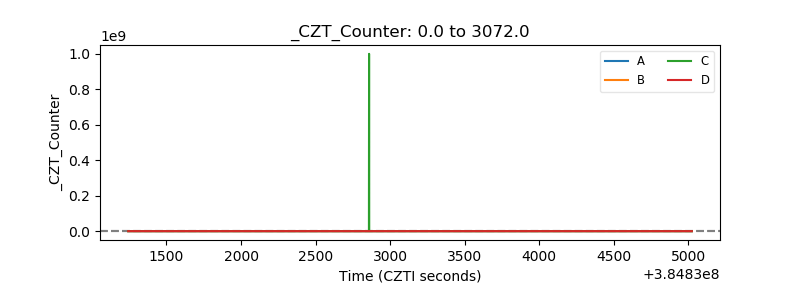 |
| +2.5 Volts monitor | 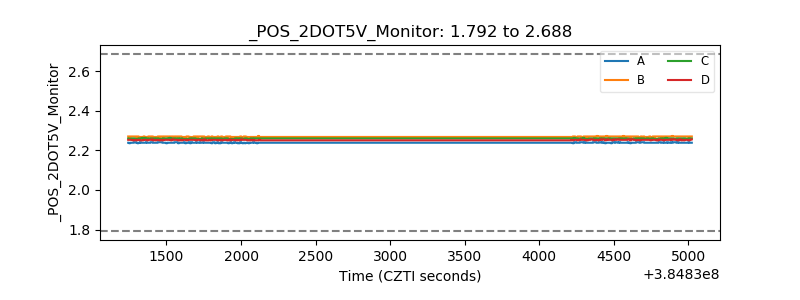 |
| +5 Volts monitor | 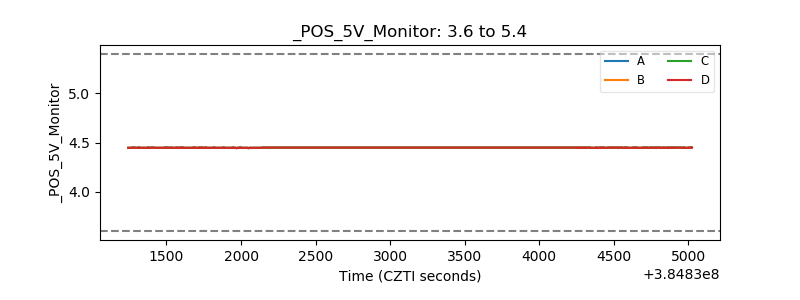 |
| _ROLL_ROT | 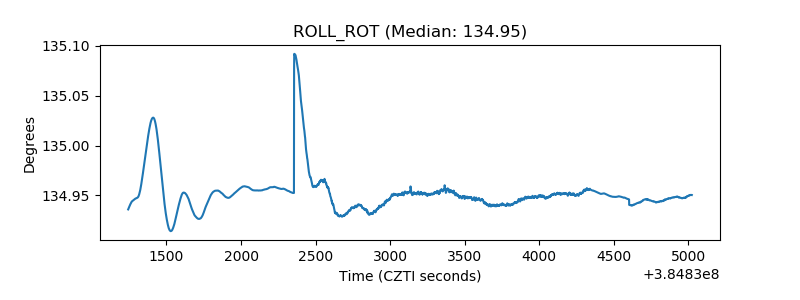 |
| _Roll_DEC | 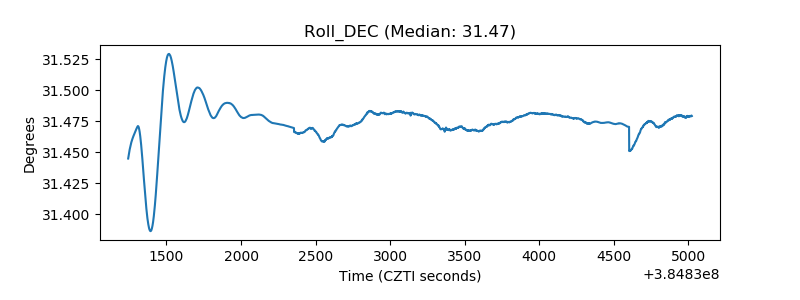 |
| _Roll_RA | 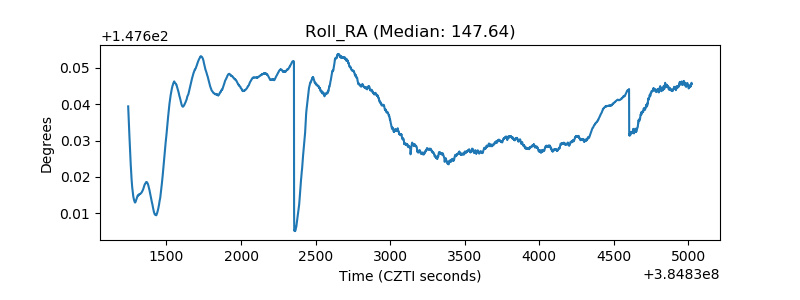 |
| Veto Counter | 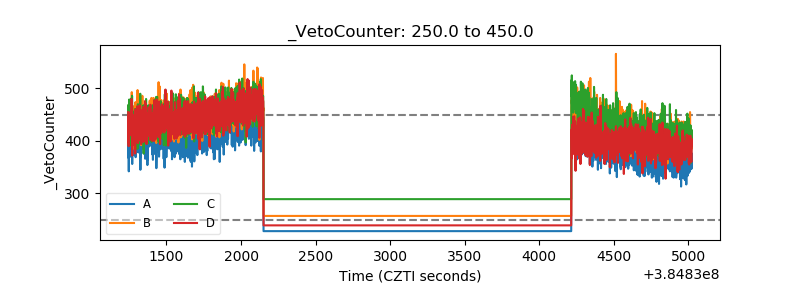 |