| Param | Original file | Final file |
|---|---|---|
| Filename | modeM0/AS1T04_077T01_9000004994_34895cztM0_level2.evt | modeM0/AS1T04_077T01_9000004994_34895cztM0_level2_quad_clean.evt |
| Size (bytes) | 258,989,760 | 59,886,720 |
| Size | 247.0 MB | 57.1 MB |
| Events in quadrant A | 1,494,046 | 404,538 |
| Events in quadrant B | 1,737,224 | 407,092 |
| Events in quadrant C | 1,647,931 | 398,459 |
| Events in quadrant D | 2,741,292 | 371,655 |
| Mode M9 | |||
|---|---|---|---|
| Quadrant | BADHDUFLAG | Total packets | Discarded packets |
| A | 0 | 3 | 0 |
| B | 0 | 3 | 0 |
| C | 0 | 3 | 0 |
| D | 0 | 4 | 0 |
| Mode M0 | |||
|---|---|---|---|
| Quadrant | BADHDUFLAG | Total packets | Discarded packets |
| A | 0 | 6681 | 1 |
| B | 0 | 7280 | 1 |
| C | 0 | 6850 | 1 |
| D | 0 | 10396 | 1 |
| Mode SS | |||
|---|---|---|---|
| Quadrant | BADHDUFLAG | Total packets | Discarded packets |
| A | 0 | 64 | 0 |
| B | 0 | 64 | 0 |
| C | 0 | 64 | 0 |
| D | 0 | 64 | 0 |
| Quadrant | Total seconds | Saturated seconds | Saturation percentage |
|---|---|---|---|
| A | 3266 | 2 | 0.061237% |
| B | 3266 | 30 | 0.918555% |
| C | 3266 | 19 | 0.581751% |
| D | 3266 | 128 | 3.919167% |
Noise dominated data is calculated using 1-second bins in cleaned event files. If a bin has >2000 counts, and if more than 50% of those come from <1% of pixels, then it is considered to be noise-dominated and hence unusable.
| Quadrant | # 1 sec bins | Bins with >0 counts | Bins with >2000 counts | High rate bins dominated by noise | Noise dominated (total time) | Noise dominated (detector-on time) | Marked lightcurve |
|---|---|---|---|---|---|---|---|
| A | 3266 | 3266 | 0 | 0 | 0.00% | 0.00% | 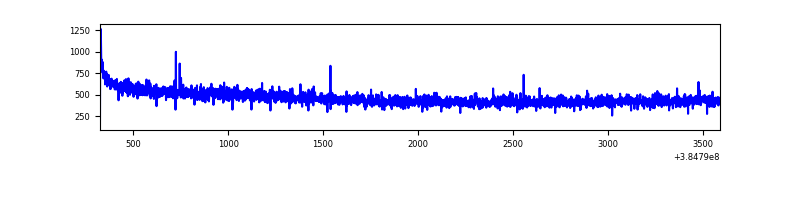 |
| B | 3266 | 3266 | 21 | 21 | 0.64% | 0.64% | 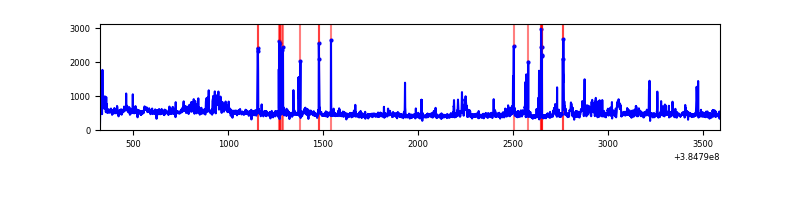 |
| C | 3266 | 3266 | 16 | 16 | 0.49% | 0.49% | 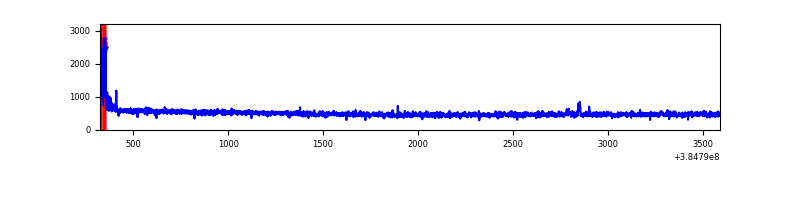 |
| D | 3266 | 3266 | 102 | 102 | 3.12% | 3.12% | 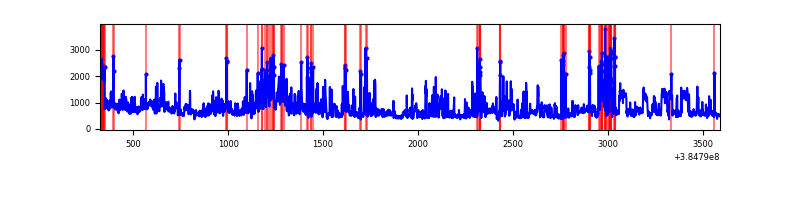 |
Top three noisy pixels from each quadrant. If the there are fewer than three noisy pixels in the level2.evt file, extra rows are filled as -1
| Pixel properties | Quadrant properties | ||||||
|---|---|---|---|---|---|---|---|
| Quadrant | DetID | PixID | Counts | Sigma | Mean | Median | Sigma |
| A | 10 | 83 | 30912 | 399.61 | 376 | 369 | 76.4 |
| A | 13 | 254 | 4828 | 58.34 | 376 | 369 | 76.4 |
| A | 13 | 6 | 4345 | 52.02 | 376 | 369 | 76.4 |
| B | 5 | 172 | 86643 | 1175.74 | 371 | 361 | 73.4 |
| B | 0 | 190 | 84223 | 1142.76 | 371 | 361 | 73.4 |
| B | 4 | 171 | 27818 | 374.15 | 371 | 361 | 73.4 |
| C | 15 | 214 | 147272 | 1693.24 | 367 | 369 | 86.8 |
| C | 0 | 10 | 54590 | 624.97 | 367 | 369 | 86.8 |
| C | 14 | 67 | 8628 | 95.2 | 367 | 369 | 86.8 |
| D | 8 | 195 | 577420 | 6455.78 | 364 | 354 | 89.4 |
| D | 7 | 223 | 276483 | 3089.12 | 364 | 354 | 89.4 |
| D | 13 | 249 | 142741 | 1592.92 | 364 | 354 | 89.4 |
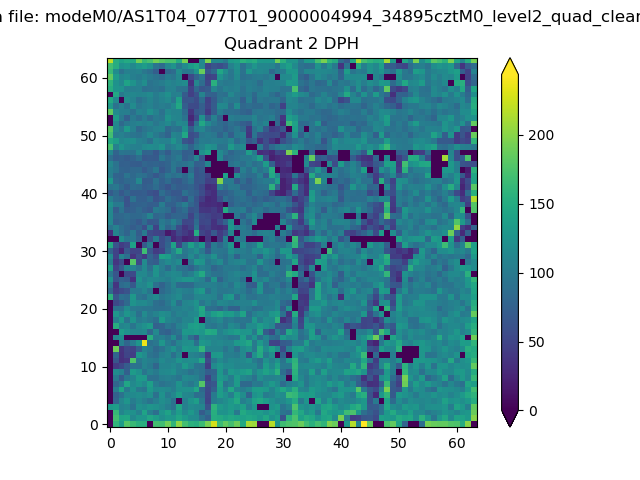
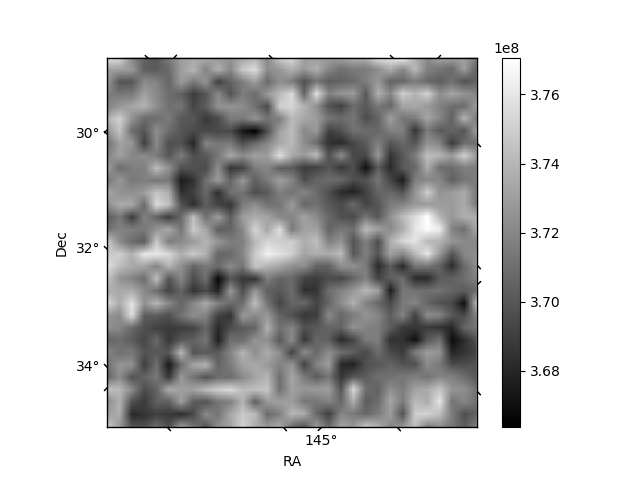
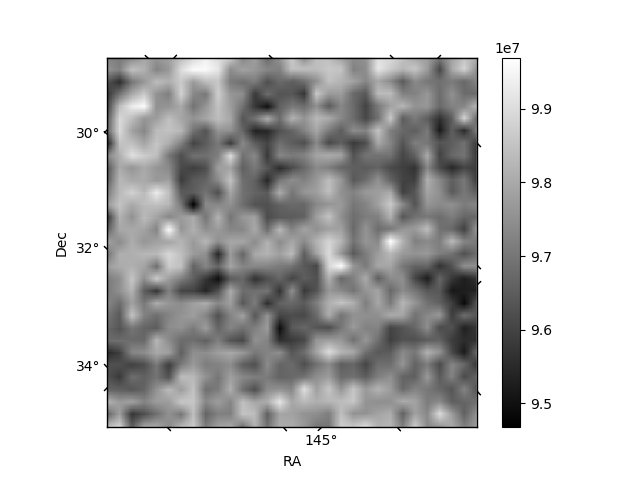
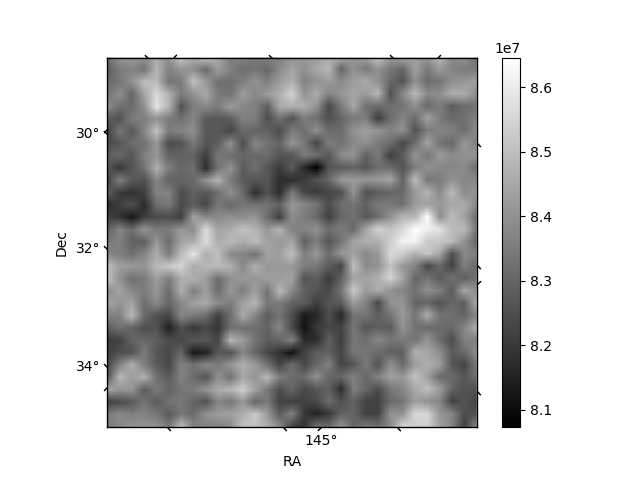
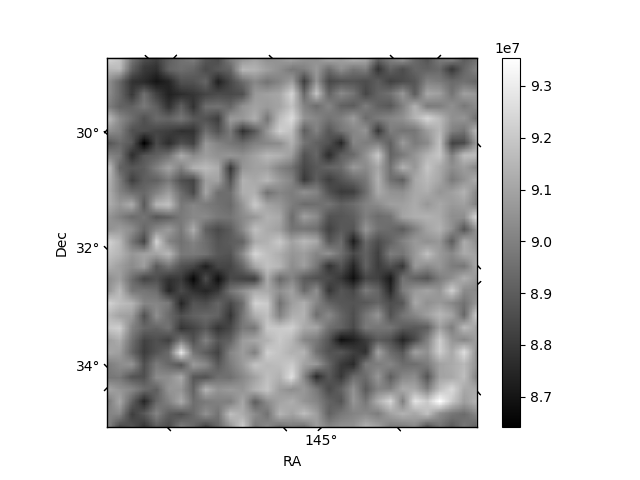
Histogram calculated using DETX and DETY for each event in the final _common_clean file
| Quadrant A | 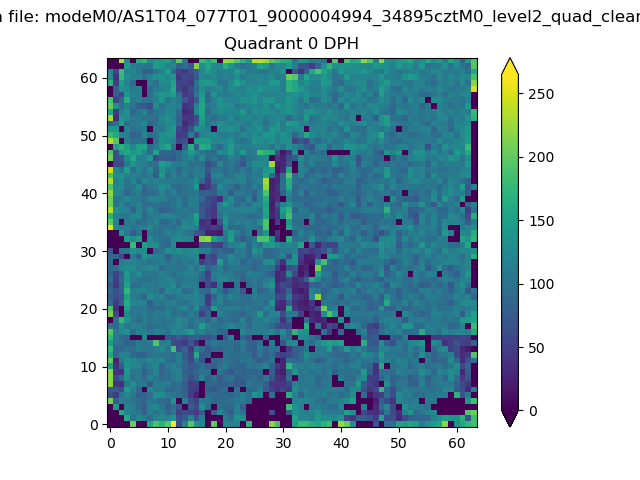 |
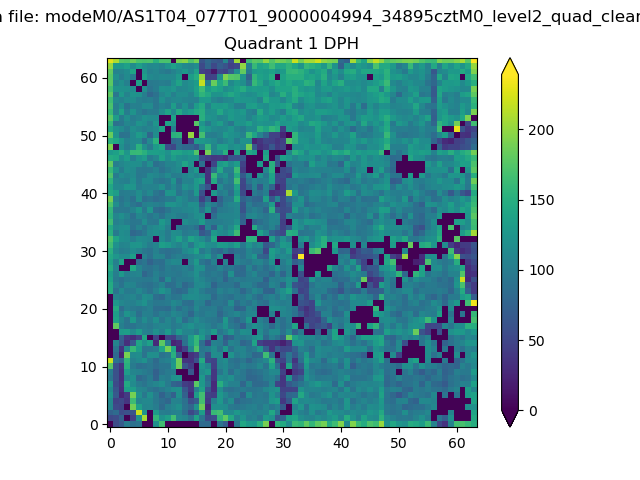 |
Quadrant B |
|---|---|---|---|
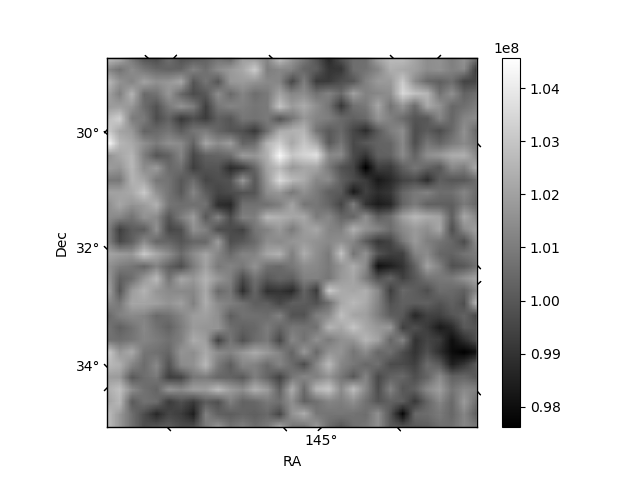
| Quadrant D | 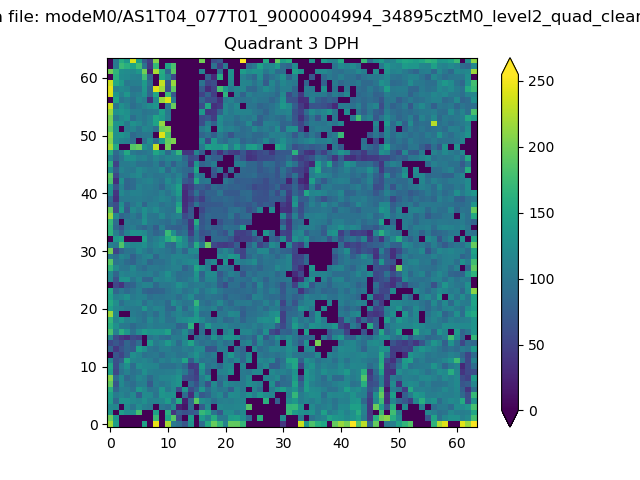 |
 |
Quadrant C |
| Plot type | Count rate plots | Images |
|---|---|---|
| Comparison with Poisson distribution Blue bars denote a histogram of data divided into 1 sec bins. Red curve is a Poisson curve with rate = median count rate of data. |
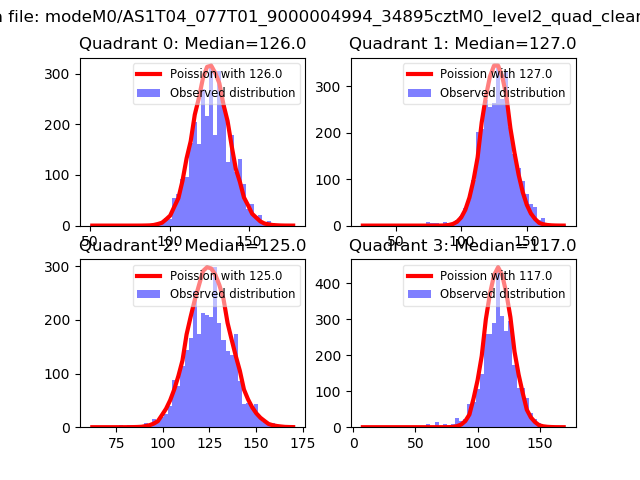 |
 |
| Quadrant-wise count rates Data is divided into 100 sec bins |
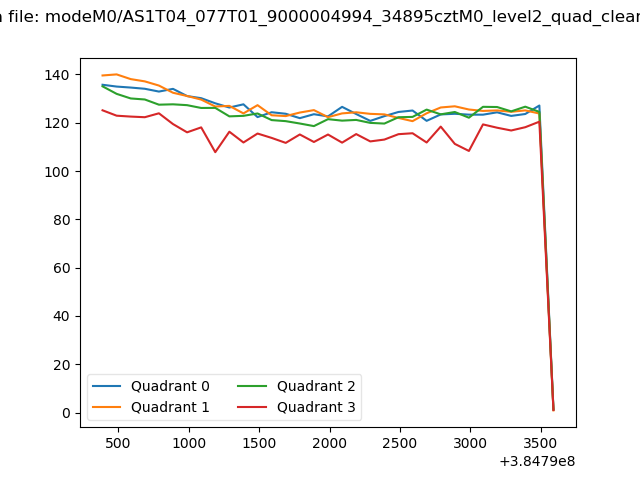 |
|
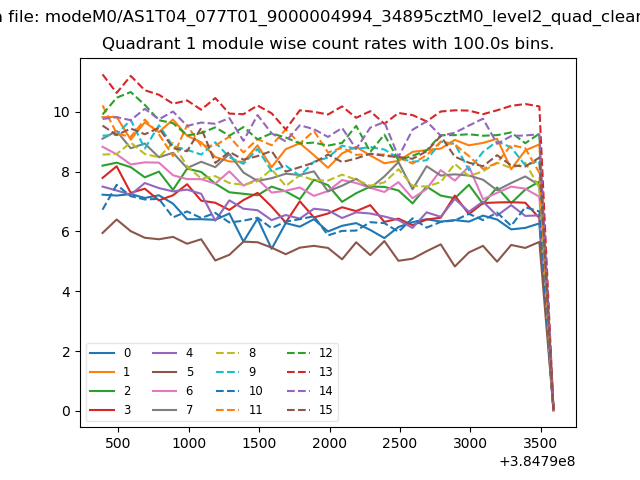
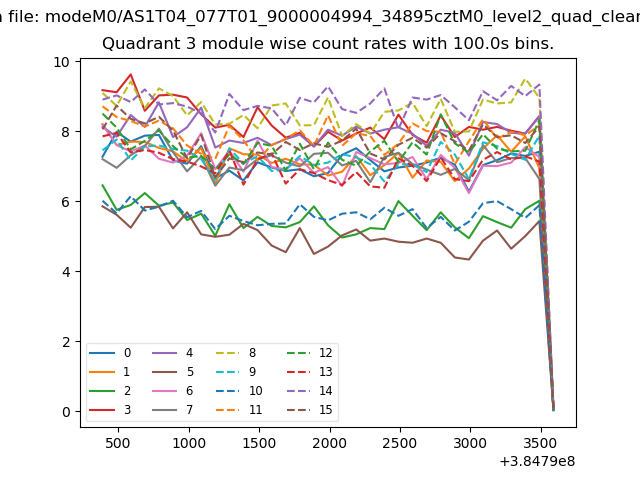
| Module-wise count rates for Quadrant A Data is divided into 100 sec bins |
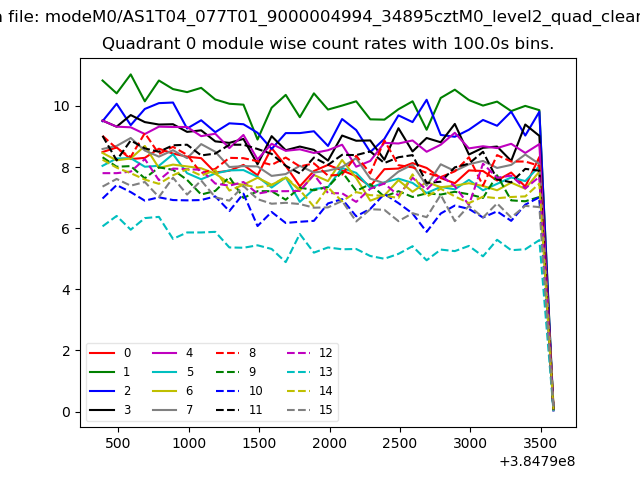 |
 |
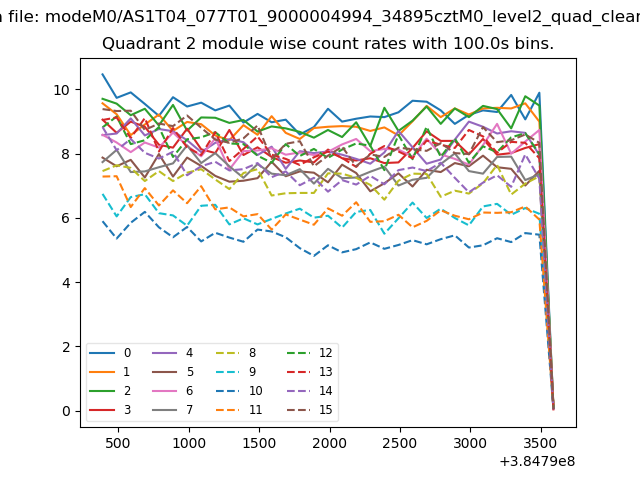
| Module-wise count rates for Quadrant B Data is divided into 100 sec bins |
 |
 |
| Module-wise count rates for Quadrant C Data is divided into 100 sec bins |
 |
 |
| Module-wise count rates for Quadrant D Data is divided into 100 sec bins |
 |
 |
| Parameter | Plot |
|---|---|
| CZT HV Monitor | 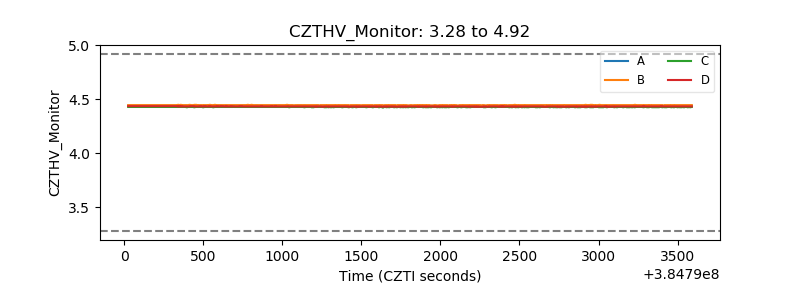 |
| D_VDD | 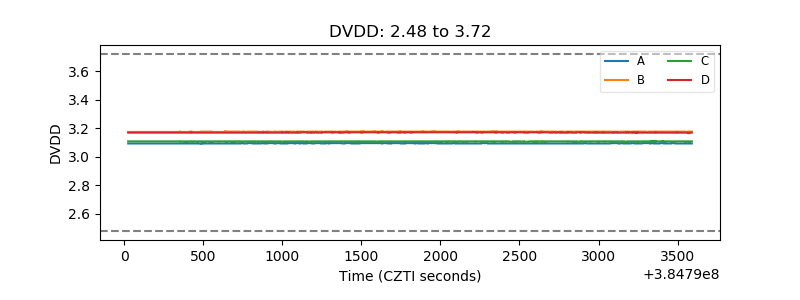 |
| Temperature 1 | 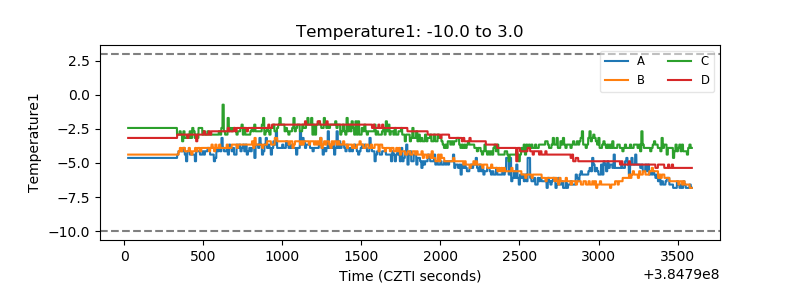 |
| Veto HV Monitor | 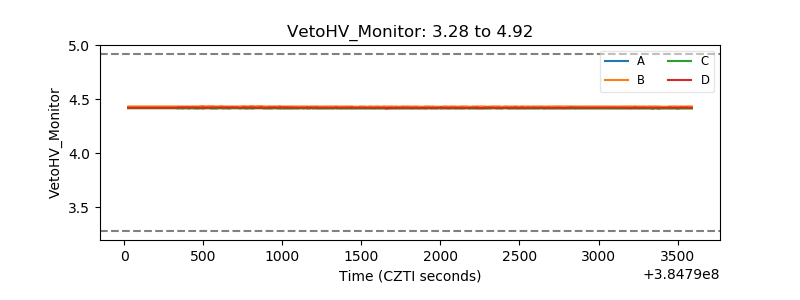 |
| Veto LLD | 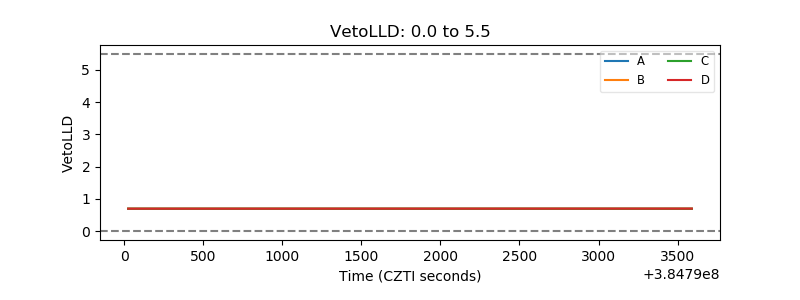 |
| Alpha Counter | 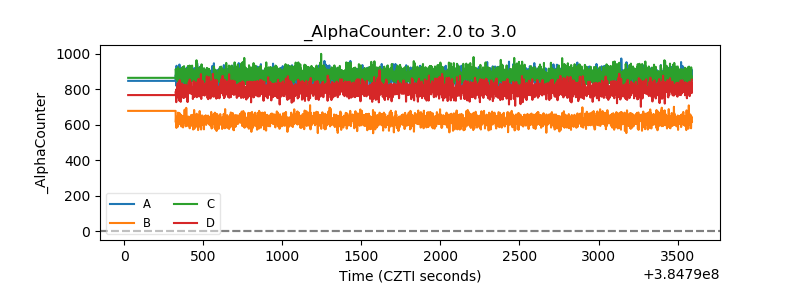 |
| _CPM_Rate | 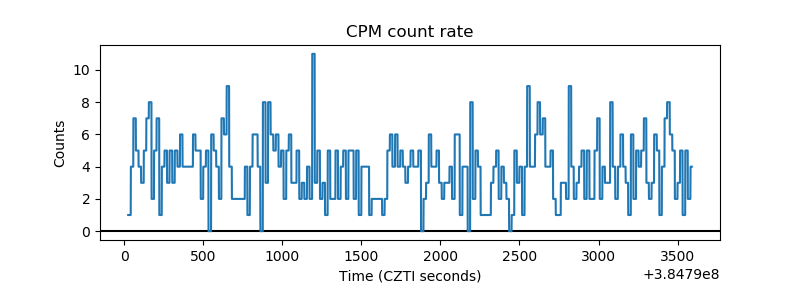 |
| CZT Counter | 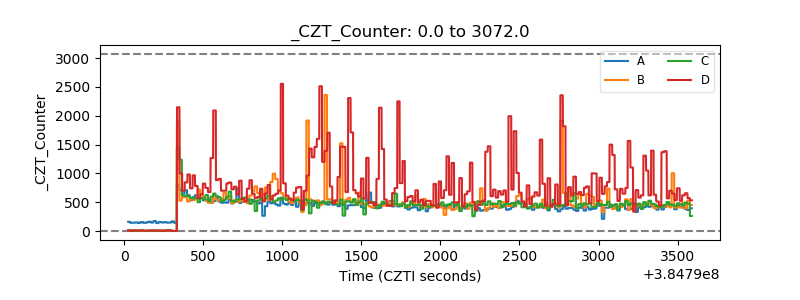 |
| +2.5 Volts monitor | 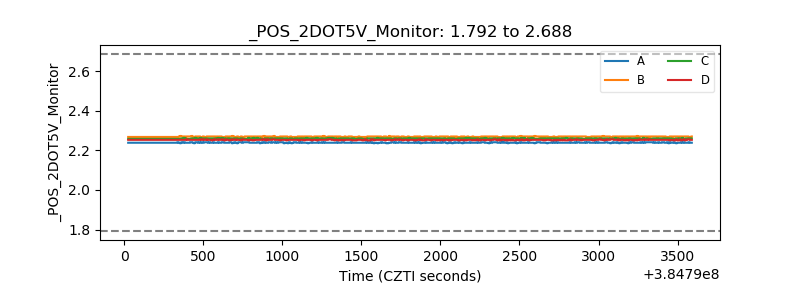 |
| +5 Volts monitor | 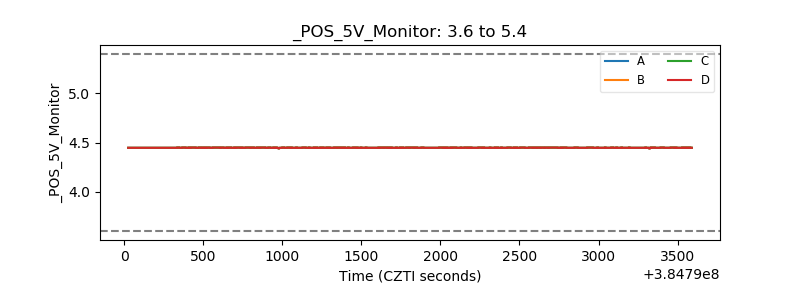 |
| _ROLL_ROT | 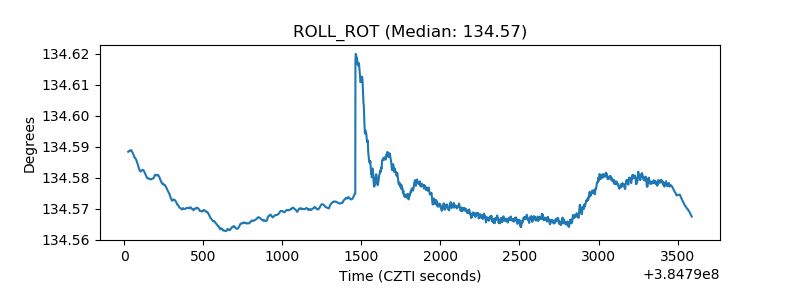 |
| _Roll_DEC | 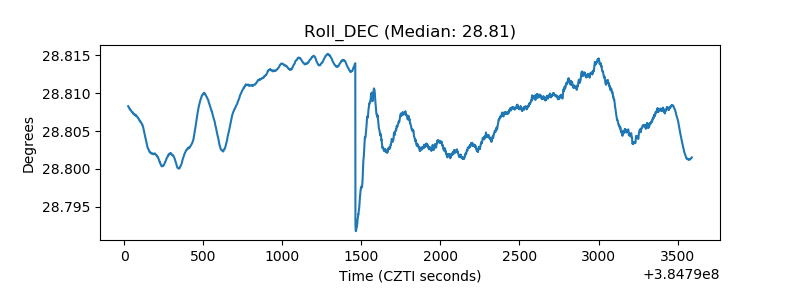 |
| _Roll_RA | 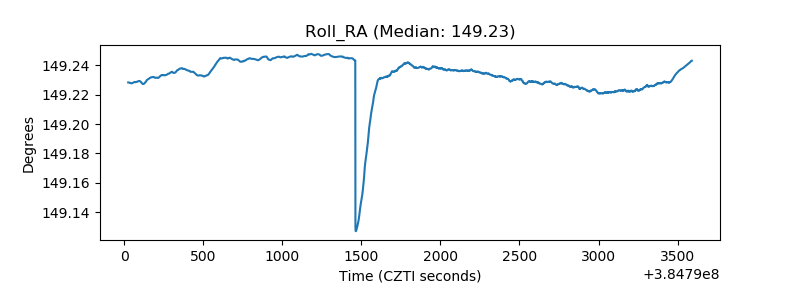 |
| Veto Counter | 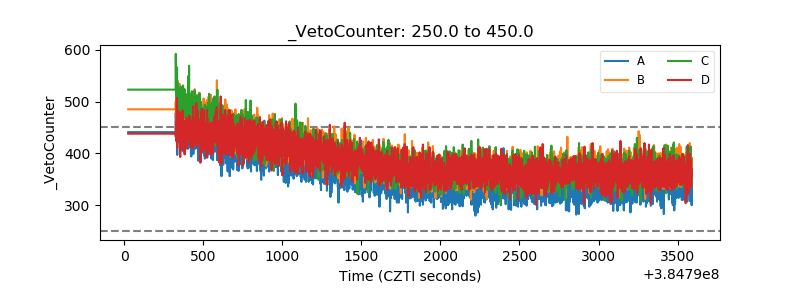 |