| Param | Original file | Final file |
|---|---|---|
| Filename | modeM0/AS1T04_077T01_9000004994_34888cztM0_level2.evt | modeM0/AS1T04_077T01_9000004994_34888cztM0_level2_quad_clean.evt |
| Size (bytes) | 475,649,280 | 57,432,960 |
| Size | 453.6 MB | 54.8 MB |
| Events in quadrant A | 2,458,116 | 355,622 |
| Events in quadrant B | 2,967,964 | 361,525 |
| Events in quadrant C | 3,049,659 | 347,143 |
| Events in quadrant D | 5,578,183 | 311,266 |
| Mode M9 | |||
|---|---|---|---|
| Quadrant | BADHDUFLAG | Total packets | Discarded packets |
| A | 0 | 41 | 0 |
| B | 0 | 41 | 0 |
| C | 0 | 41 | 0 |
| D | 0 | 41 | 0 |
| Mode M0 | |||
|---|---|---|---|
| Quadrant | BADHDUFLAG | Total packets | Discarded packets |
| A | 0 | 10577 | 3 |
| B | 0 | 12096 | 2 |
| C | 0 | 12134 | 2 |
| D | 0 | 20106 | 2 |
| Mode SS | |||
|---|---|---|---|
| Quadrant | BADHDUFLAG | Total packets | Discarded packets |
| A | 0 | 108 | 0 |
| B | 0 | 108 | 0 |
| C | 0 | 108 | 0 |
| D | 0 | 108 | 0 |
| Quadrant | Total seconds | Saturated seconds | Saturation percentage |
|---|---|---|---|
| A | 5181 | 3 | 0.057904% |
| B | 5181 | 56 | 1.080872% |
| C | 5181 | 93 | 1.795020% |
| D | 5181 | 459 | 8.859294% |
Noise dominated data is calculated using 1-second bins in cleaned event files. If a bin has >2000 counts, and if more than 50% of those come from <1% of pixels, then it is considered to be noise-dominated and hence unusable.
| Quadrant | # 1 sec bins | Bins with >0 counts | Bins with >2000 counts | High rate bins dominated by noise | Noise dominated (total time) | Noise dominated (detector-on time) | Marked lightcurve |
|---|---|---|---|---|---|---|---|
| A | 9277 | 5183 | 0 | 0 | 0.00% | 0.00% | 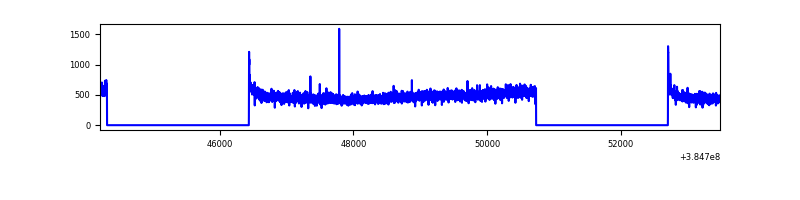 |
| B | 9277 | 5183 | 30 | 30 | 0.32% | 0.58% | 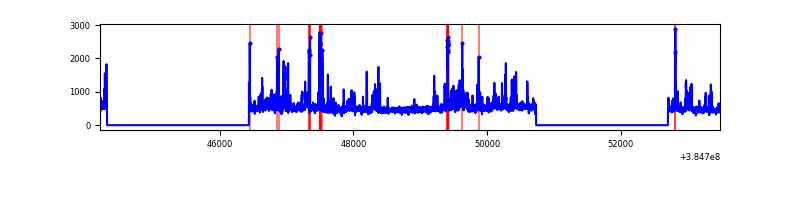 |
| C | 9277 | 5183 | 83 | 83 | 0.89% | 1.60% | 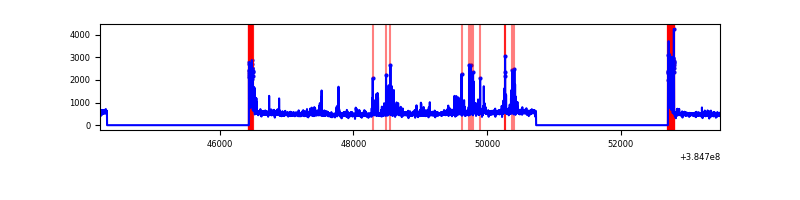 |
| D | 9277 | 5183 | 534 | 534 | 5.76% | 10.30% | 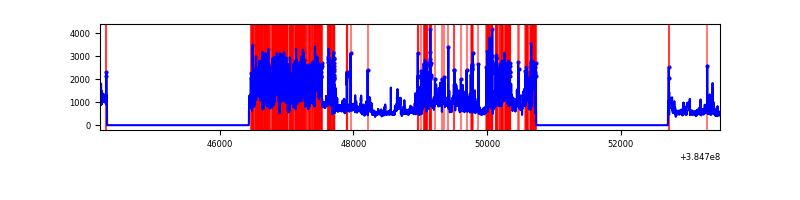 |
Top three noisy pixels from each quadrant. If the there are fewer than three noisy pixels in the level2.evt file, extra rows are filled as -1
| Pixel properties | Quadrant properties | ||||||
|---|---|---|---|---|---|---|---|
| Quadrant | DetID | PixID | Counts | Sigma | Mean | Median | Sigma |
| A | 10 | 83 | 56768 | 452.51 | 616 | 605 | 124.1 |
| A | 13 | 6 | 18114 | 141.07 | 616 | 605 | 124.1 |
| A | 13 | 254 | 8118 | 60.53 | 616 | 605 | 124.1 |
| B | 0 | 190 | 210877 | 1788.56 | 612 | 596 | 117.6 |
| B | 5 | 172 | 178962 | 1517.1 | 612 | 596 | 117.6 |
| B | 0 | 219 | 43094 | 361.47 | 612 | 596 | 117.6 |
| C | 0 | 207 | 250877 | 1824.25 | 591 | 596 | 137.2 |
| C | 0 | 10 | 235131 | 1709.48 | 591 | 596 | 137.2 |
| C | 15 | 214 | 234494 | 1704.83 | 591 | 596 | 137.2 |
| D | 1 | 52 | 1227634 | 8882.27 | 573 | 559 | 138.1 |
| D | 8 | 195 | 942438 | 6817.86 | 573 | 559 | 138.1 |
| D | 7 | 223 | 382352 | 2763.64 | 573 | 559 | 138.1 |
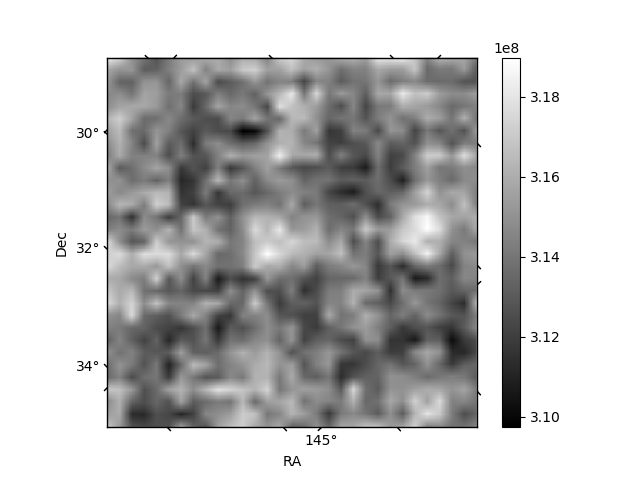
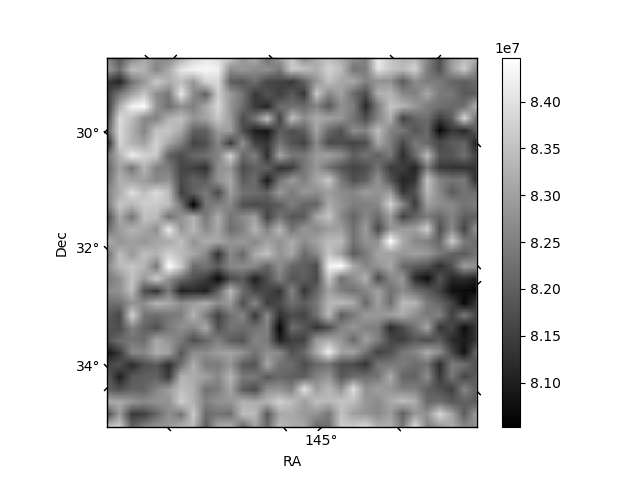
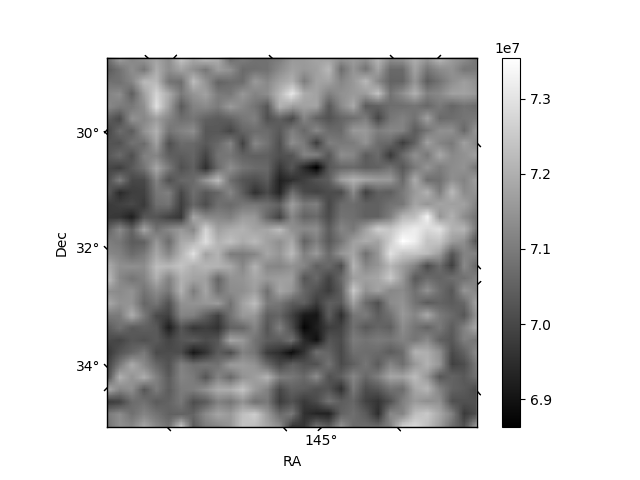
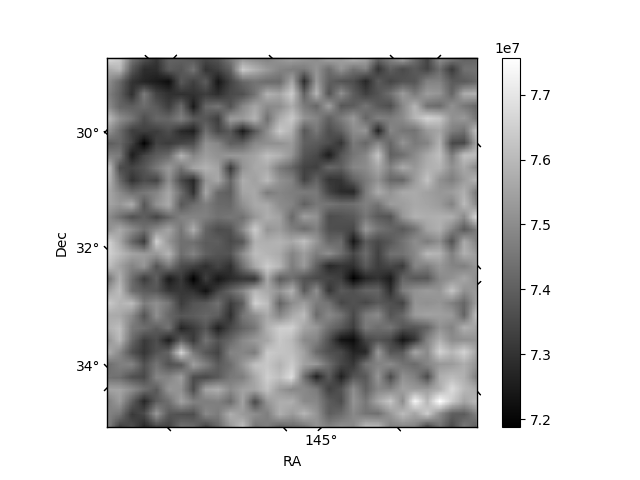
Histogram calculated using DETX and DETY for each event in the final _common_clean file
| Quadrant A | 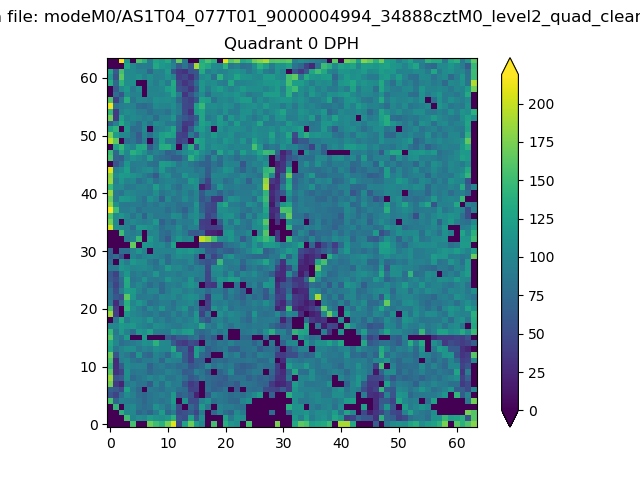 |
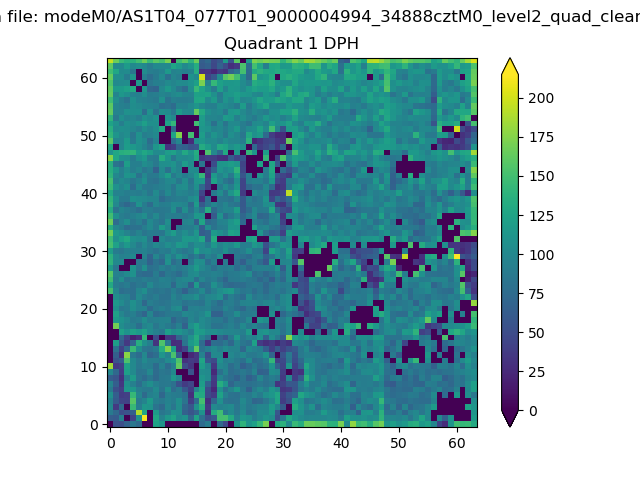 |
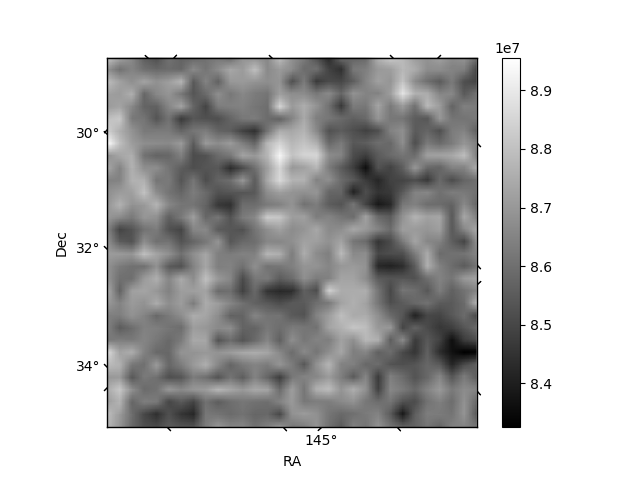
Quadrant B |
|---|---|---|---|
| Quadrant D | 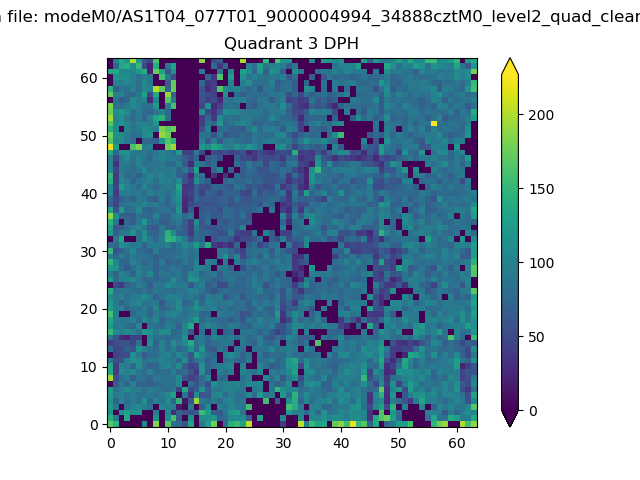 |
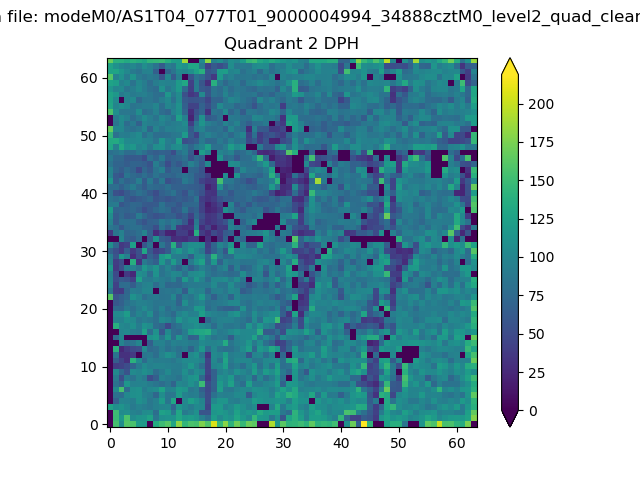 |
Quadrant C |
| Plot type | Count rate plots | Images |
|---|---|---|
| Comparison with Poisson distribution Blue bars denote a histogram of data divided into 1 sec bins. Red curve is a Poisson curve with rate = median count rate of data. |
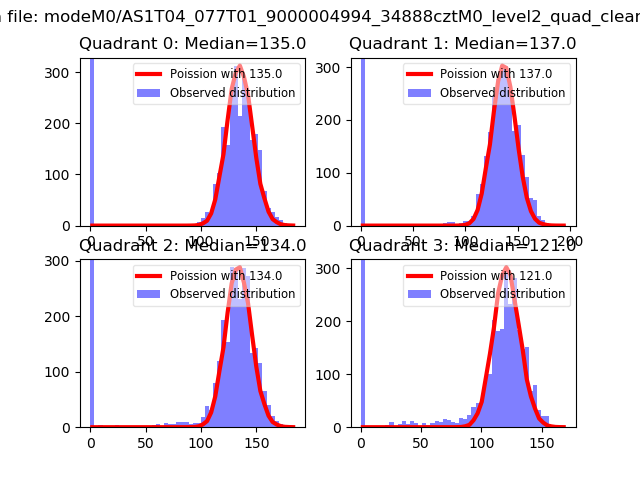 |
 |
| Quadrant-wise count rates Data is divided into 100 sec bins |
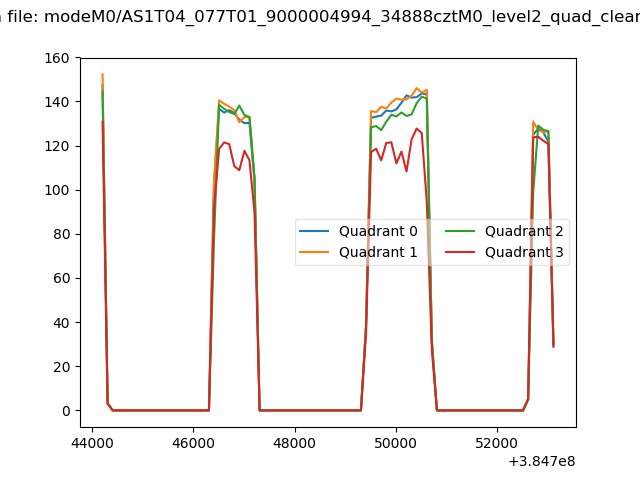 |
|
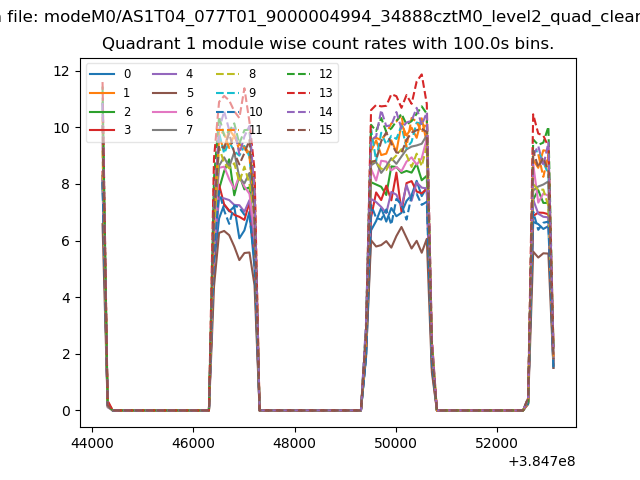
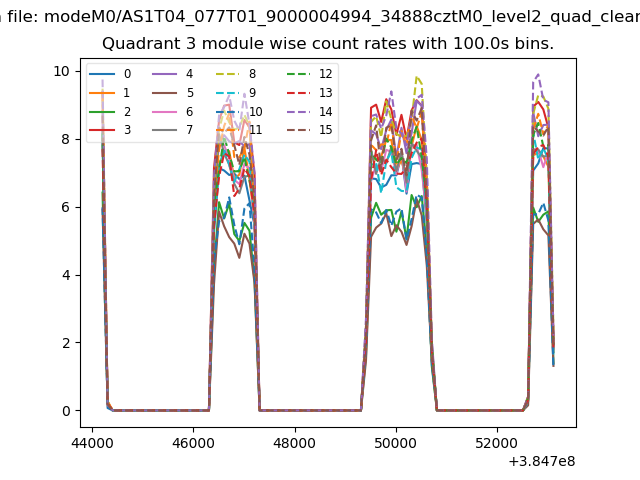
| Module-wise count rates for Quadrant A Data is divided into 100 sec bins |
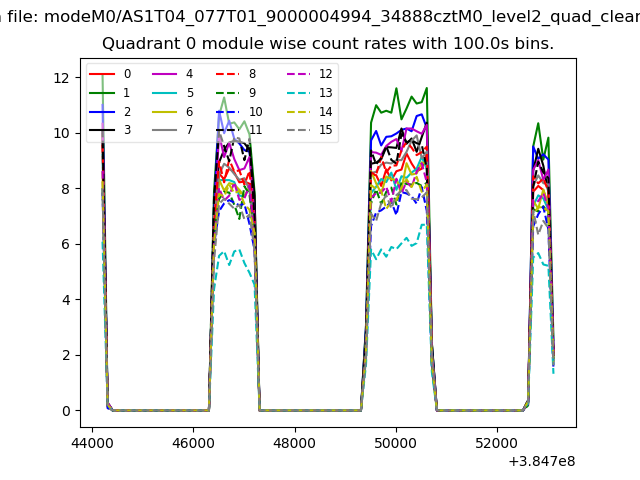 |
 |
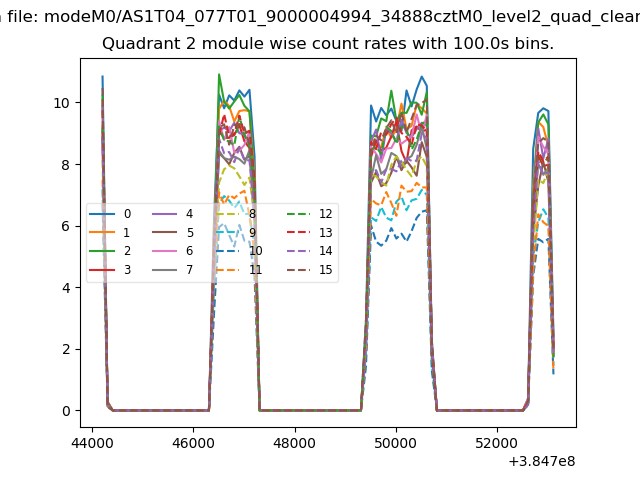
| Module-wise count rates for Quadrant B Data is divided into 100 sec bins |
 |
 |
| Module-wise count rates for Quadrant C Data is divided into 100 sec bins |
 |
 |
| Module-wise count rates for Quadrant D Data is divided into 100 sec bins |
 |
 |
| Parameter | Plot |
|---|---|
| CZT HV Monitor |  |
| D_VDD | 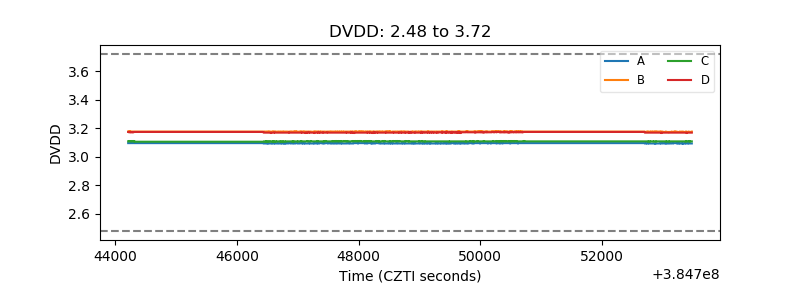 |
| Temperature 1 | 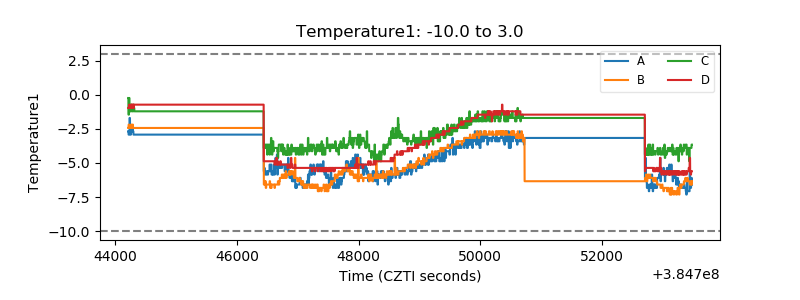 |
| Veto HV Monitor | 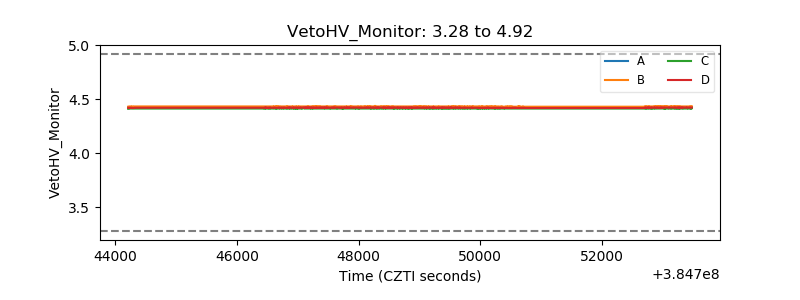 |
| Veto LLD | 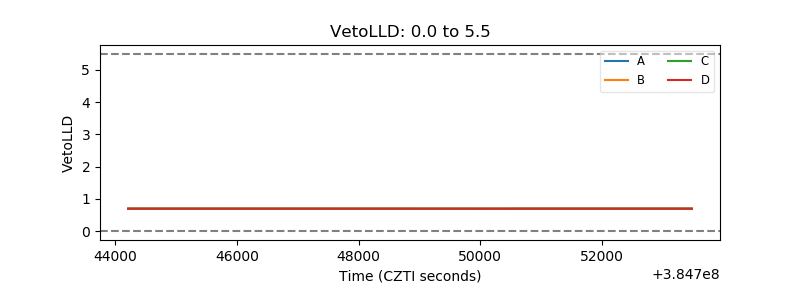 |
| Alpha Counter | 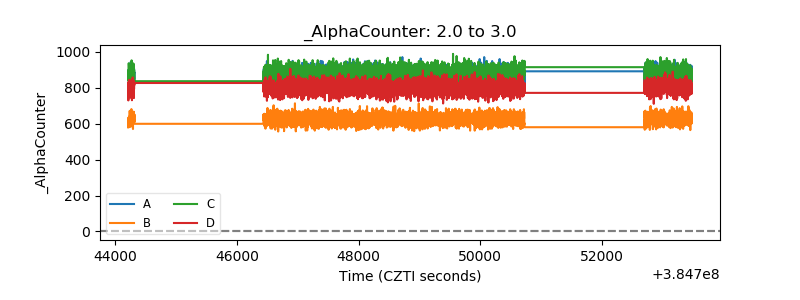 |
| _CPM_Rate | 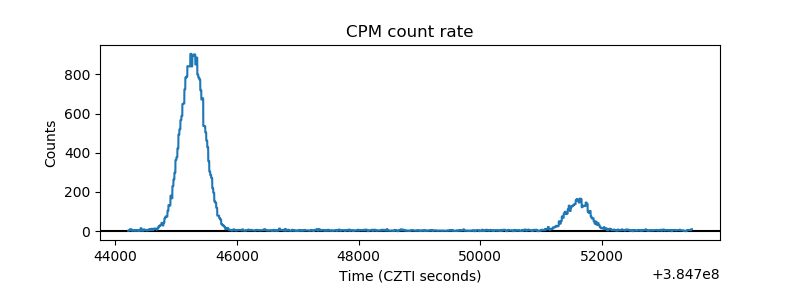 |
| CZT Counter | 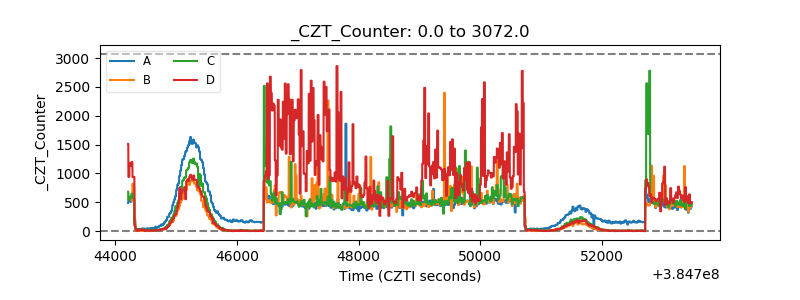 |
| +2.5 Volts monitor | 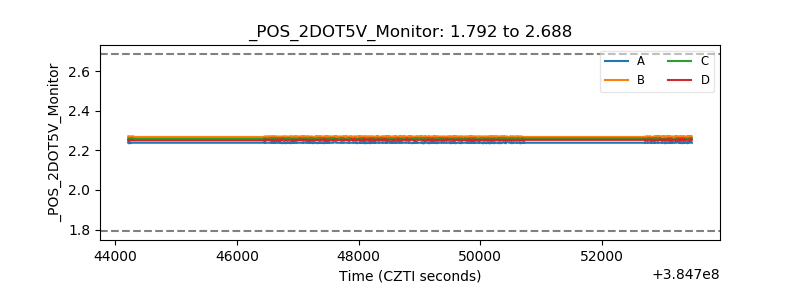 |
| +5 Volts monitor | 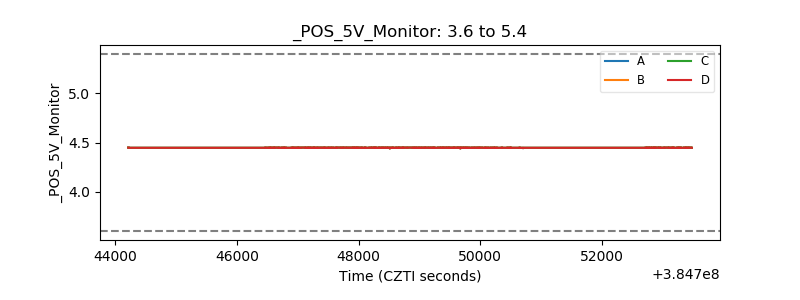 |
| _ROLL_ROT | 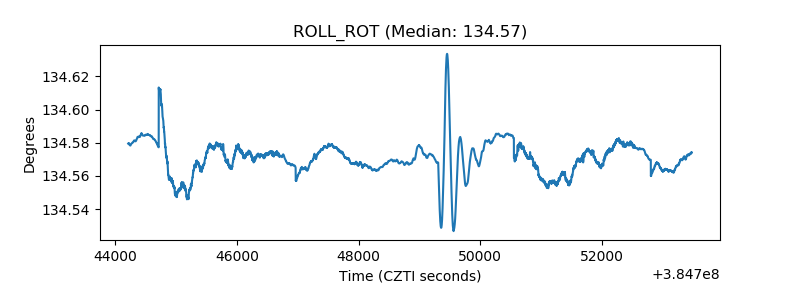 |
| _Roll_DEC | 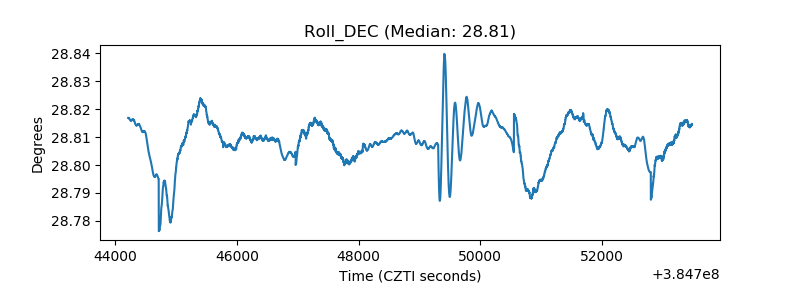 |
| _Roll_RA | 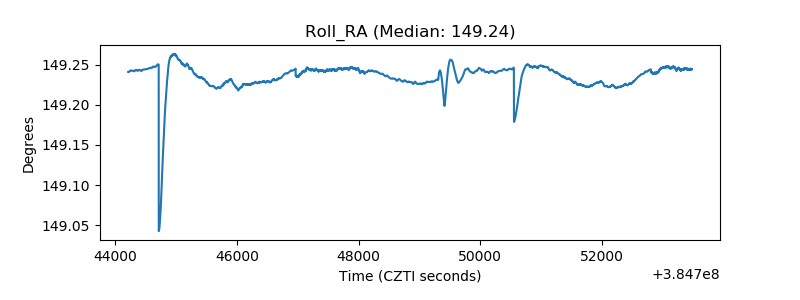 |
| Veto Counter | 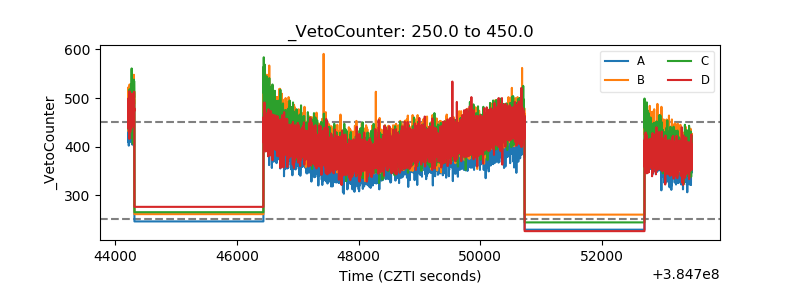 |