| Param | Original file | Final file |
|---|---|---|
| Filename | modeM0/AS1A11_053T01_9000004996_34902cztM0_level2.evt | modeM0/AS1A11_053T01_9000004996_34902cztM0_level2_quad_clean.evt |
| Size (bytes) | 185,803,200 | 48,021,120 |
| Size | 177.2 MB | 45.8 MB |
| Events in quadrant A | 1,094,285 | 315,849 |
| Events in quadrant B | 1,284,108 | 325,629 |
| Events in quadrant C | 1,300,546 | 327,577 |
| Events in quadrant D | 1,776,398 | 305,601 |
| Mode M9 | |||
|---|---|---|---|
| Quadrant | BADHDUFLAG | Total packets | Discarded packets |
| A | 0 | 12 | 0 |
| B | 0 | 12 | 0 |
| C | 0 | 12 | 0 |
| D | 0 | 13 | 0 |
| Mode SS | |||
|---|---|---|---|
| Quadrant | BADHDUFLAG | Total packets | Discarded packets |
| A | 0 | 50 | 0 |
| B | 0 | 50 | 0 |
| C | 0 | 50 | 0 |
| D | 0 | 50 | 0 |
| Mode M0 | |||
|---|---|---|---|
| Quadrant | BADHDUFLAG | Total packets | Discarded packets |
| A | 0 | 5065 | 1 |
| B | 0 | 5508 | 1 |
| C | 0 | 5389 | 1 |
| D | 0 | 7043 | 1 |
| Quadrant | Total seconds | Saturated seconds | Saturation percentage |
|---|---|---|---|
| A | 2496 | 2 | 0.080128% |
| B | 2496 | 48 | 1.923077% |
| C | 2496 | 32 | 1.282051% |
| D | 2496 | 11 | 0.440705% |
Noise dominated data is calculated using 1-second bins in cleaned event files. If a bin has >2000 counts, and if more than 50% of those come from <1% of pixels, then it is considered to be noise-dominated and hence unusable.
| Quadrant | # 1 sec bins | Bins with >0 counts | Bins with >2000 counts | High rate bins dominated by noise | Noise dominated (total time) | Noise dominated (detector-on time) | Marked lightcurve |
|---|---|---|---|---|---|---|---|
| A | 2496 | 2496 | 0 | 0 | 0.00% | 0.00% | 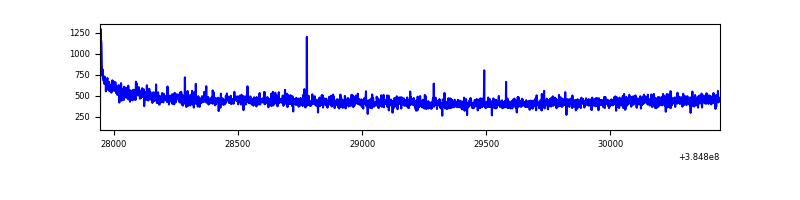 |
| B | 2496 | 2496 | 36 | 36 | 1.44% | 1.44% | 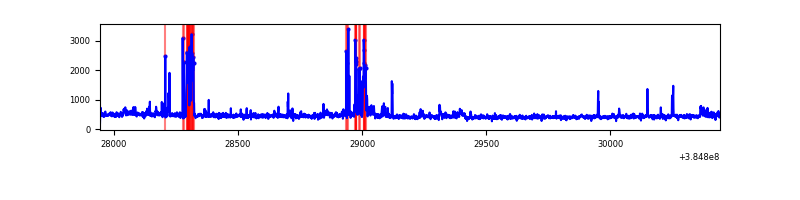 |
| C | 2496 | 2496 | 30 | 30 | 1.20% | 1.20% | 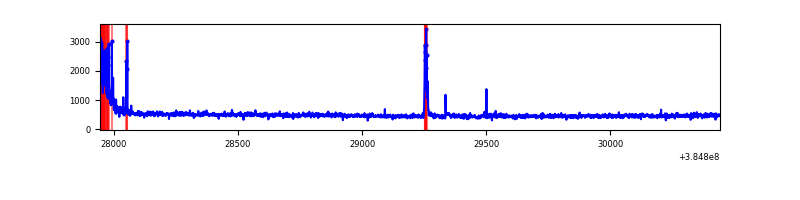 |
| D | 2496 | 2496 | 13 | 13 | 0.52% | 0.52% | 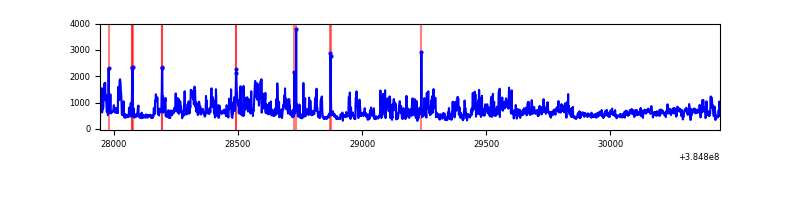 |
Top three noisy pixels from each quadrant. If the there are fewer than three noisy pixels in the level2.evt file, extra rows are filled as -1
| Pixel properties | Quadrant properties | ||||||
|---|---|---|---|---|---|---|---|
| Quadrant | DetID | PixID | Counts | Sigma | Mean | Median | Sigma |
| A | 10 | 83 | 29052 | 517.38 | 271 | 266 | 55.6 |
| A | 13 | 6 | 8573 | 149.31 | 271 | 266 | 55.6 |
| A | 13 | 254 | 4357 | 73.53 | 271 | 266 | 55.6 |
| B | 5 | 172 | 106401 | 2031.94 | 272 | 266 | 52.2 |
| B | 0 | 190 | 37410 | 711.12 | 272 | 266 | 52.2 |
| B | 0 | 218 | 33620 | 638.56 | 272 | 266 | 52.2 |
| C | 15 | 214 | 112619 | 1770.63 | 267 | 269 | 63.5 |
| C | 0 | 10 | 88708 | 1393.79 | 267 | 269 | 63.5 |
| C | 12 | 250 | 31447 | 491.36 | 267 | 269 | 63.5 |
| D | 8 | 195 | 427513 | 6642.89 | 262 | 255 | 64.3 |
| D | 12 | 217 | 265826 | 4129.02 | 262 | 255 | 64.3 |
| D | 12 | 128 | 32381 | 499.49 | 262 | 255 | 64.3 |
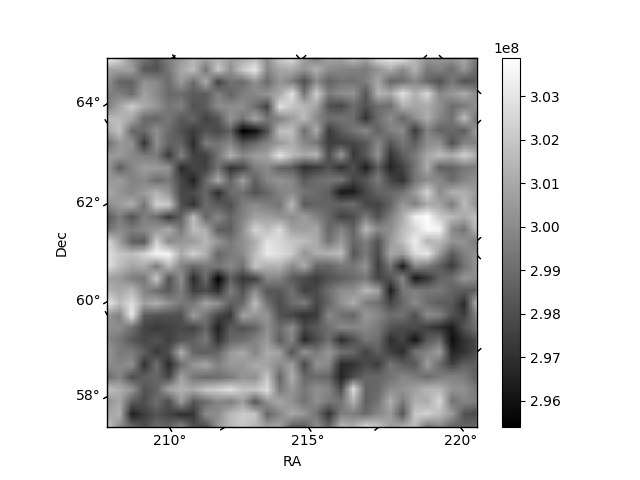
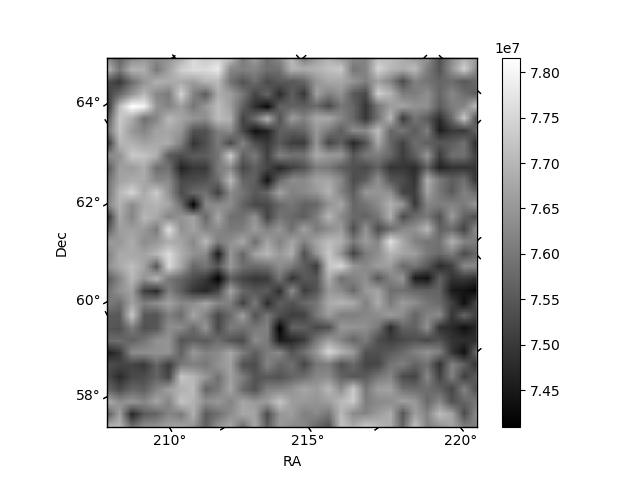
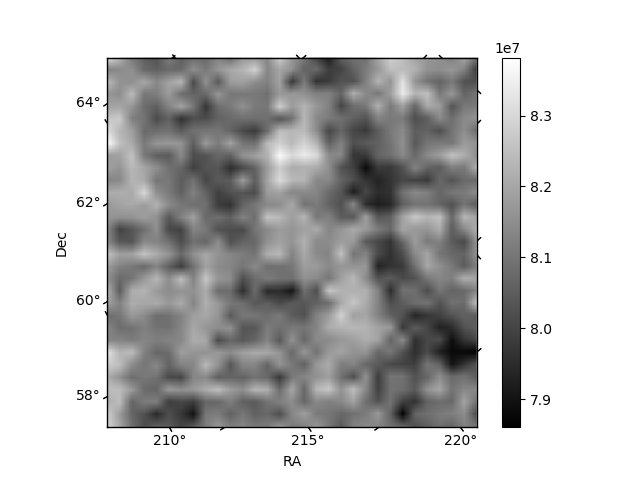
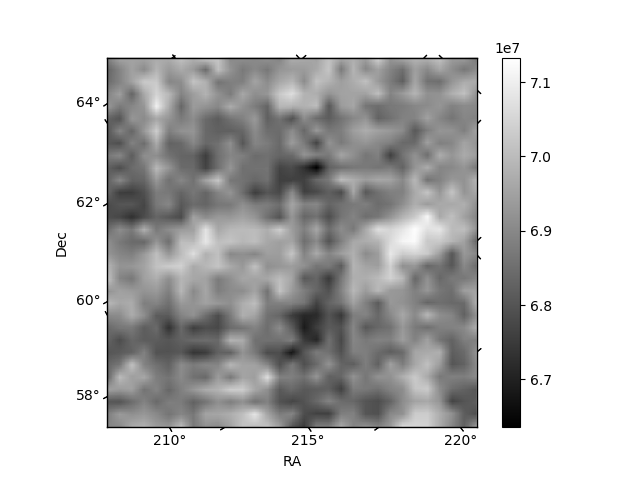
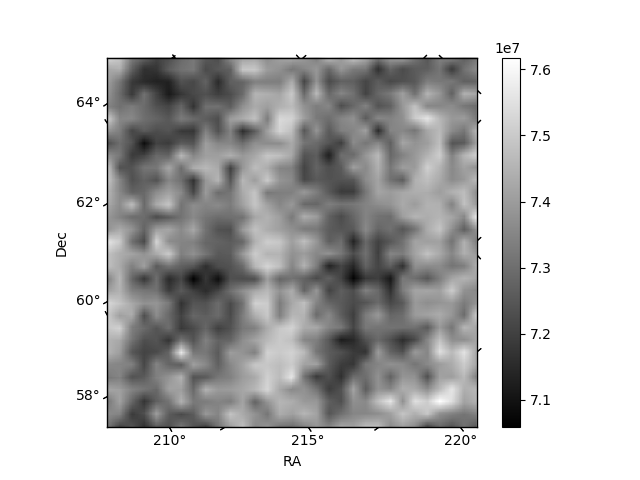
Histogram calculated using DETX and DETY for each event in the final _common_clean file
| Quadrant A | 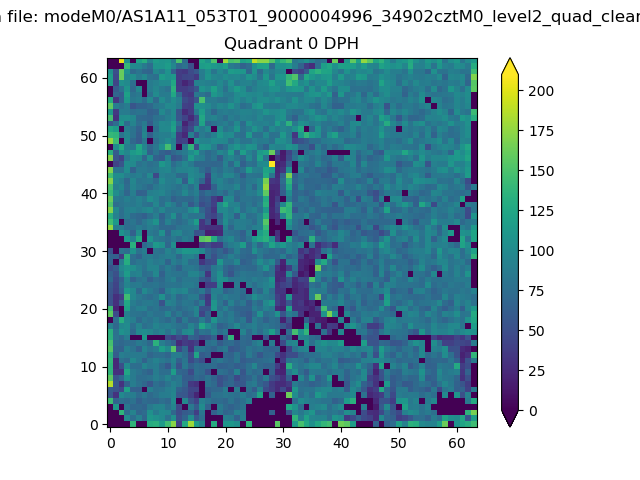 |
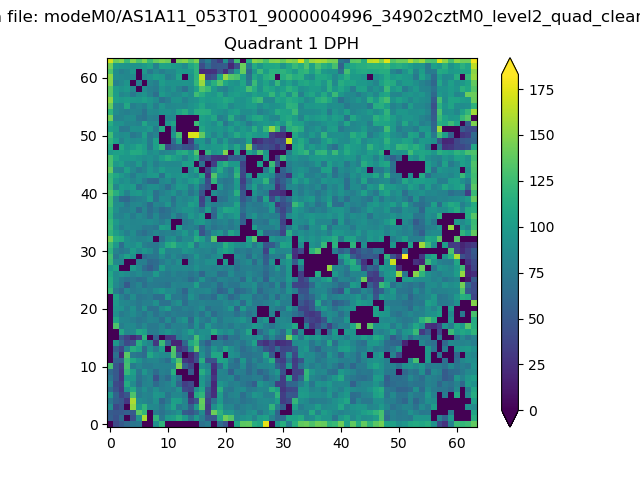 |
Quadrant B |
|---|---|---|---|
| Quadrant D | 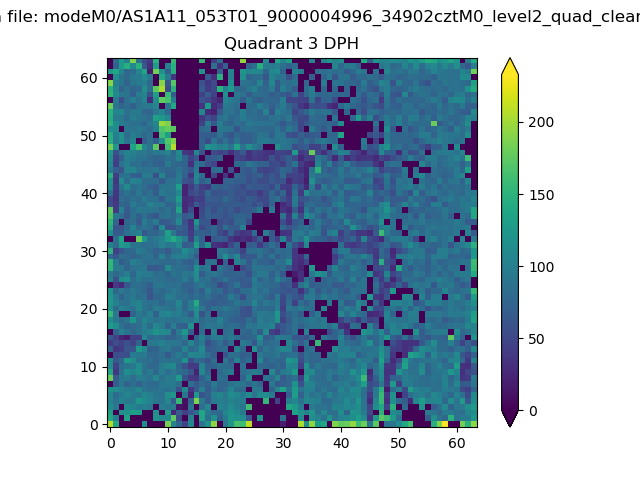 |
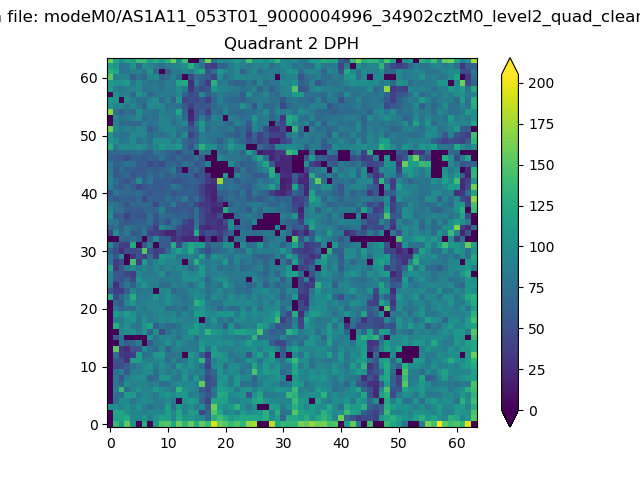 |
Quadrant C |
| Plot type | Count rate plots | Images |
|---|---|---|
| Comparison with Poisson distribution Blue bars denote a histogram of data divided into 1 sec bins. Red curve is a Poisson curve with rate = median count rate of data. |
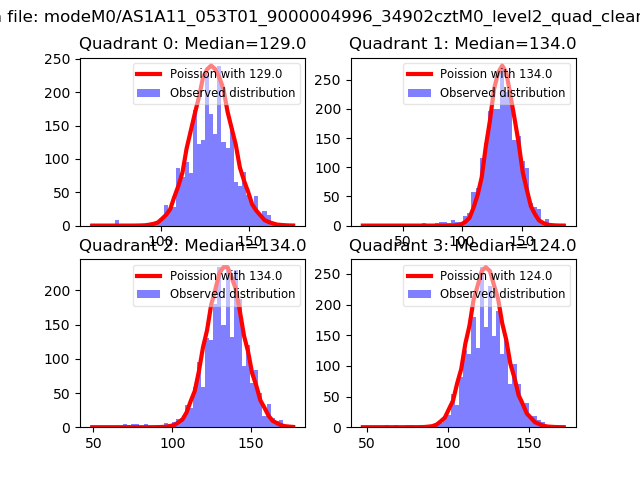 |
 |
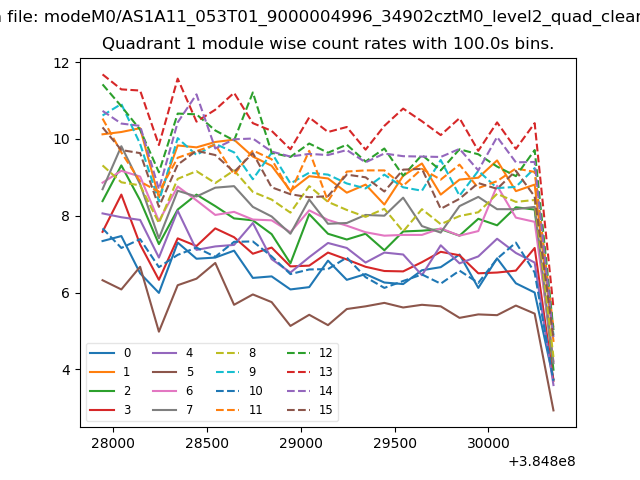
| Quadrant-wise count rates Data is divided into 100 sec bins |
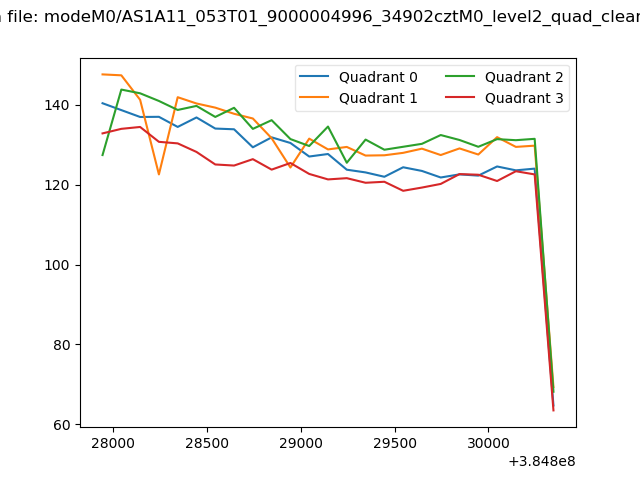 |
|
| Module-wise count rates for Quadrant A Data is divided into 100 sec bins |
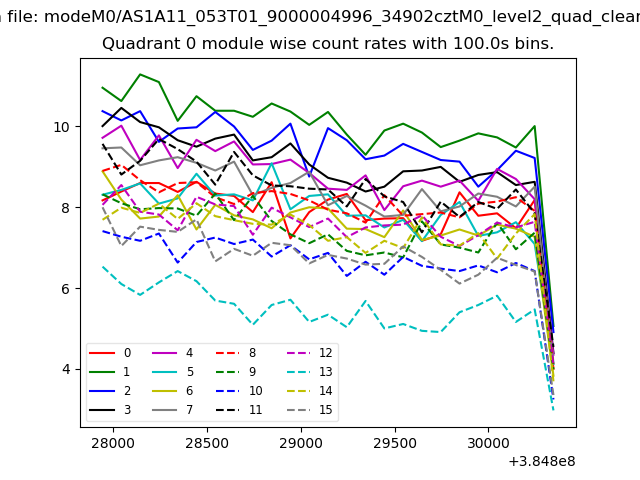 |
 |
| Module-wise count rates for Quadrant B Data is divided into 100 sec bins |
 |
 |
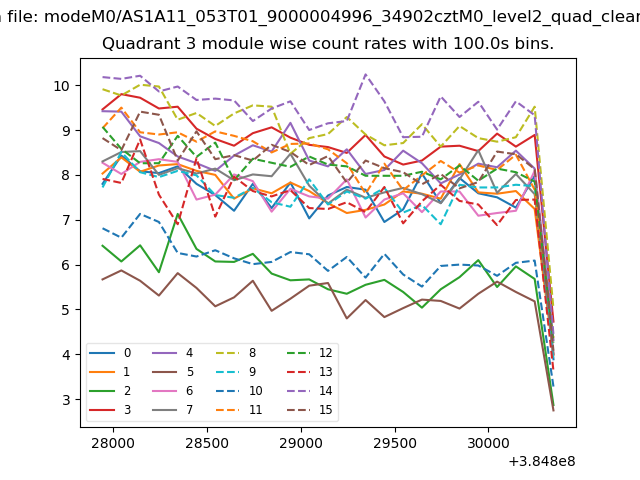
| Module-wise count rates for Quadrant C Data is divided into 100 sec bins |
 |
 |
| Module-wise count rates for Quadrant D Data is divided into 100 sec bins |
 |
 |
| Parameter | Plot |
|---|---|
| CZT HV Monitor | 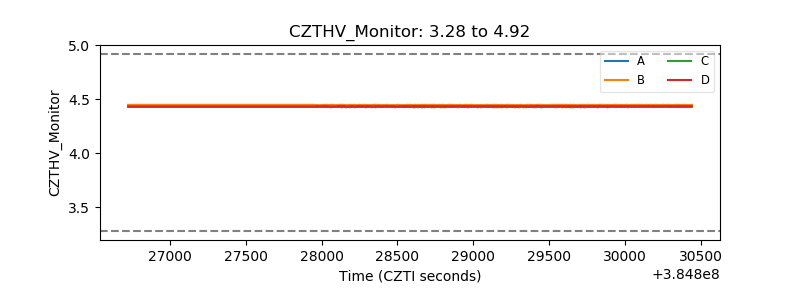 |
| D_VDD | 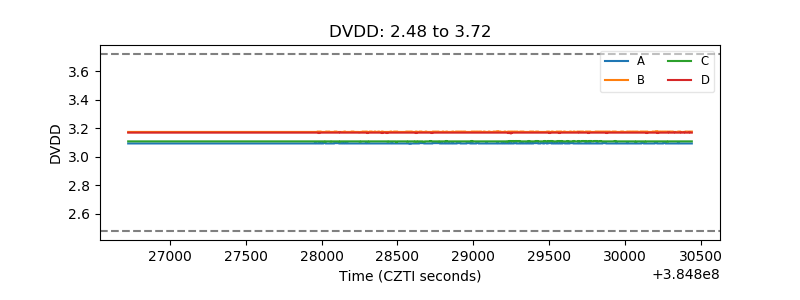 |
| Temperature 1 | 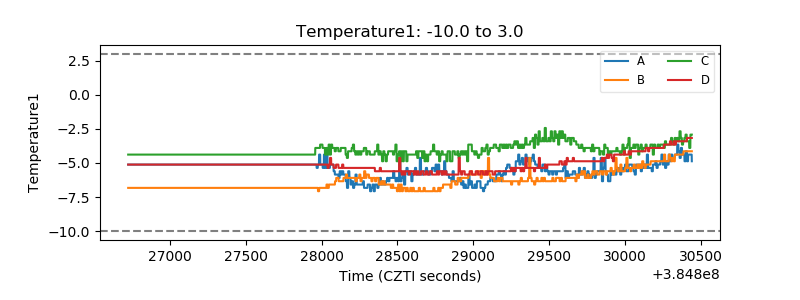 |
| Veto HV Monitor | 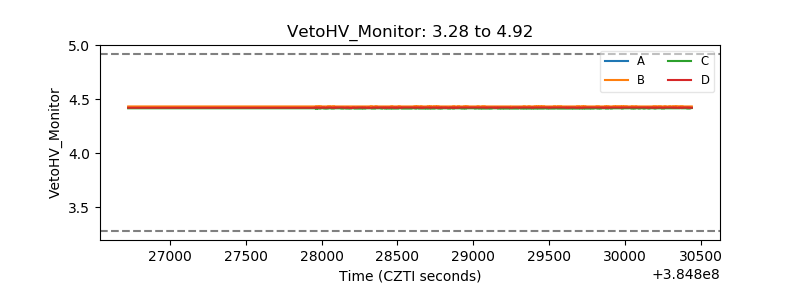 |
| Veto LLD | 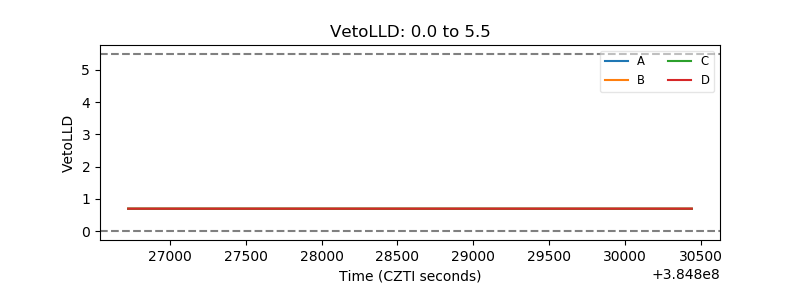 |
| Alpha Counter | 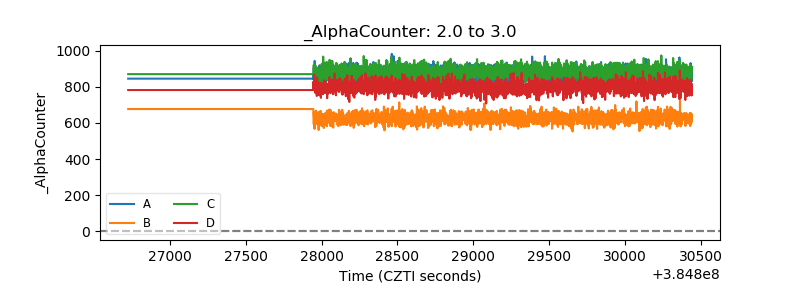 |
| _CPM_Rate | 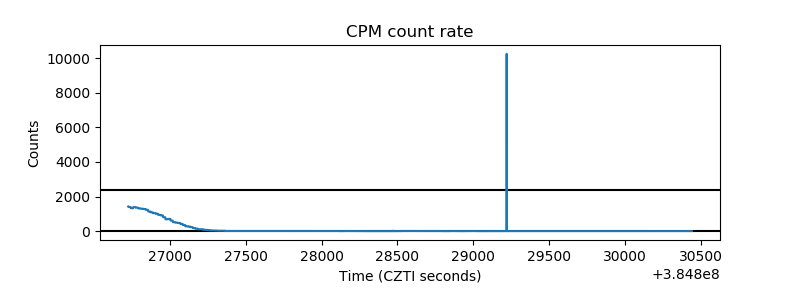 |
| CZT Counter | 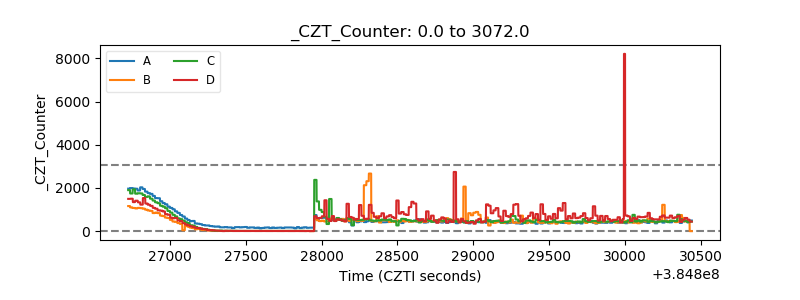 |
| +2.5 Volts monitor | 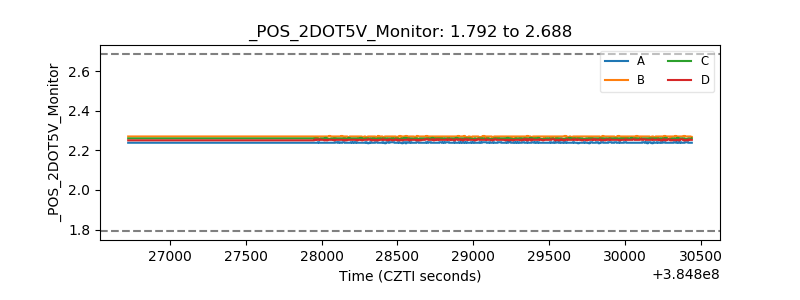 |
| +5 Volts monitor | 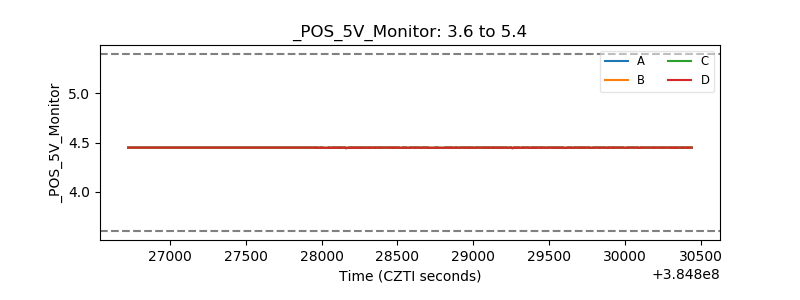 |
| _ROLL_ROT | 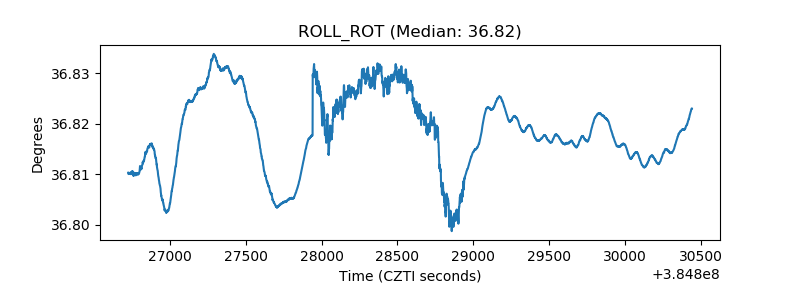 |
| _Roll_DEC | 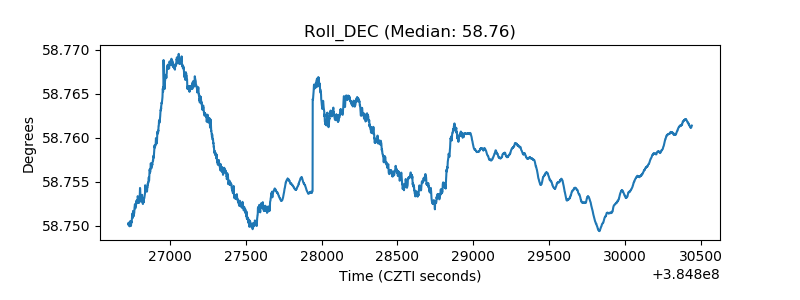 |
| _Roll_RA | 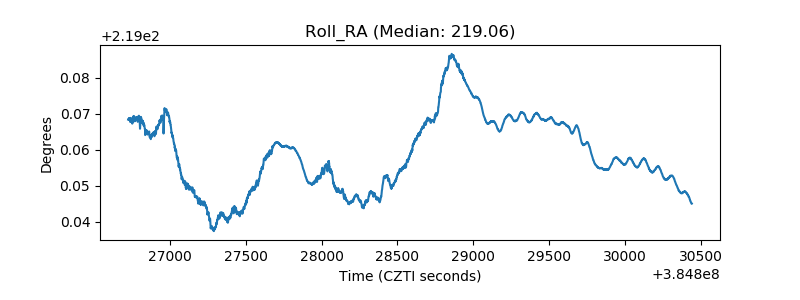 |
| Veto Counter | 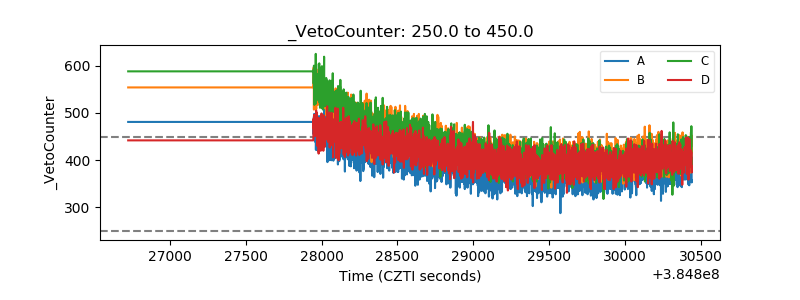 |