| Param | Original file | Final file |
|---|---|---|
| Filename | modeM0/AS1A11_053T01_9000004996_34899cztM0_level2.evt | modeM0/AS1A11_053T01_9000004996_34899cztM0_level2_quad_clean.evt |
| Size (bytes) | 455,290,560 | 96,408,000 |
| Size | 434.2 MB | 91.9 MB |
| Events in quadrant A | 2,558,210 | 646,185 |
| Events in quadrant B | 3,163,435 | 664,127 |
| Events in quadrant C | 2,911,375 | 669,718 |
| Events in quadrant D | 4,800,256 | 572,905 |
| Mode M9 | |||
|---|---|---|---|
| Quadrant | BADHDUFLAG | Total packets | Discarded packets |
| A | 0 | 40 | 0 |
| B | 0 | 40 | 0 |
| C | 0 | 40 | 0 |
| D | 0 | 40 | 0 |
| Mode SS | |||
|---|---|---|---|
| Quadrant | BADHDUFLAG | Total packets | Discarded packets |
| A | 0 | 108 | 0 |
| B | 0 | 108 | 0 |
| C | 0 | 108 | 0 |
| D | 0 | 108 | 0 |
| Mode M0 | |||
|---|---|---|---|
| Quadrant | BADHDUFLAG | Total packets | Discarded packets |
| A | 0 | 10927 | 3 |
| B | 0 | 12827 | 2 |
| C | 0 | 11760 | 2 |
| D | 0 | 18071 | 2 |
| Quadrant | Total seconds | Saturated seconds | Saturation percentage |
|---|---|---|---|
| A | 5236 | 9 | 0.171887% |
| B | 5236 | 113 | 2.158136% |
| C | 5236 | 69 | 1.317800% |
| D | 5236 | 596 | 11.382735% |
Noise dominated data is calculated using 1-second bins in cleaned event files. If a bin has >2000 counts, and if more than 50% of those come from <1% of pixels, then it is considered to be noise-dominated and hence unusable.
| Quadrant | # 1 sec bins | Bins with >0 counts | Bins with >2000 counts | High rate bins dominated by noise | Noise dominated (total time) | Noise dominated (detector-on time) | Marked lightcurve |
|---|---|---|---|---|---|---|---|
| A | 9183 | 5238 | 0 | 0 | 0.00% | 0.00% | 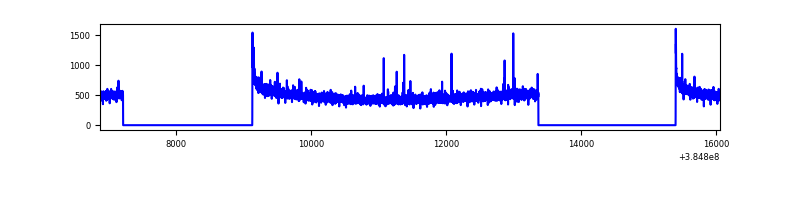 |
| B | 9183 | 5238 | 79 | 79 | 0.86% | 1.51% | 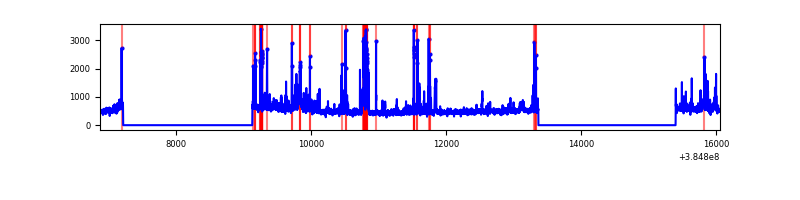 |
| C | 9183 | 5238 | 53 | 53 | 0.58% | 1.01% | 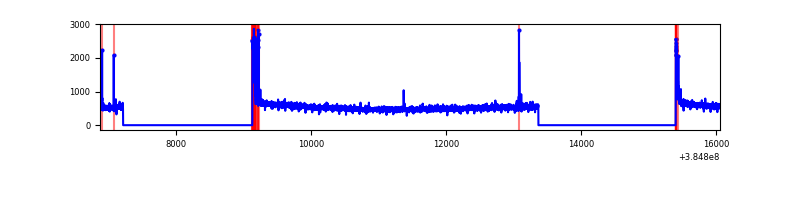 |
| D | 9183 | 5238 | 554 | 554 | 6.03% | 10.58% | 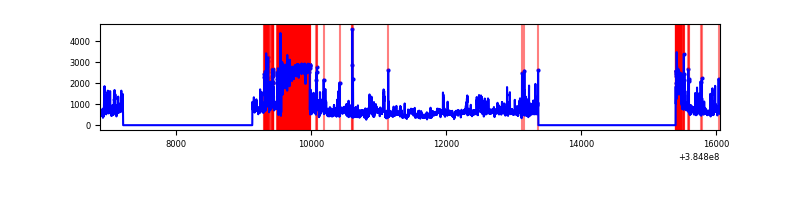 |
Top three noisy pixels from each quadrant. If the there are fewer than three noisy pixels in the level2.evt file, extra rows are filled as -1
| Pixel properties | Quadrant properties | ||||||
|---|---|---|---|---|---|---|---|
| Quadrant | DetID | PixID | Counts | Sigma | Mean | Median | Sigma |
| A | 10 | 83 | 58976 | 451.59 | 639 | 629 | 129.2 |
| A | 9 | 143 | 11812 | 86.55 | 639 | 629 | 129.2 |
| A | 7 | 16 | 10560 | 76.86 | 639 | 629 | 129.2 |
| B | 5 | 172 | 204840 | 1693.32 | 641 | 627 | 120.6 |
| B | 3 | 112 | 126756 | 1045.85 | 641 | 627 | 120.6 |
| B | 0 | 190 | 121327 | 1000.84 | 641 | 627 | 120.6 |
| C | 15 | 214 | 236991 | 1618.63 | 634 | 641 | 146.0 |
| C | 0 | 10 | 150678 | 1027.52 | 634 | 641 | 146.0 |
| C | 14 | 67 | 19404 | 128.5 | 634 | 641 | 146.0 |
| D | 1 | 52 | 997789 | 7039.64 | 586 | 571 | 141.7 |
| D | 8 | 195 | 955915 | 6744.04 | 586 | 571 | 141.7 |
| D | 10 | 118 | 232860 | 1639.79 | 586 | 571 | 141.7 |
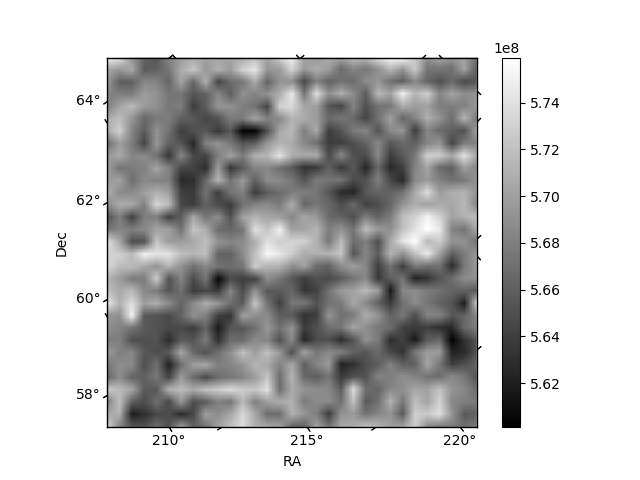
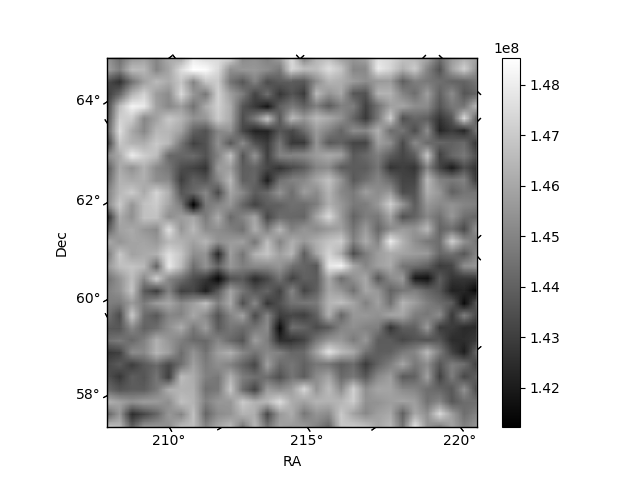
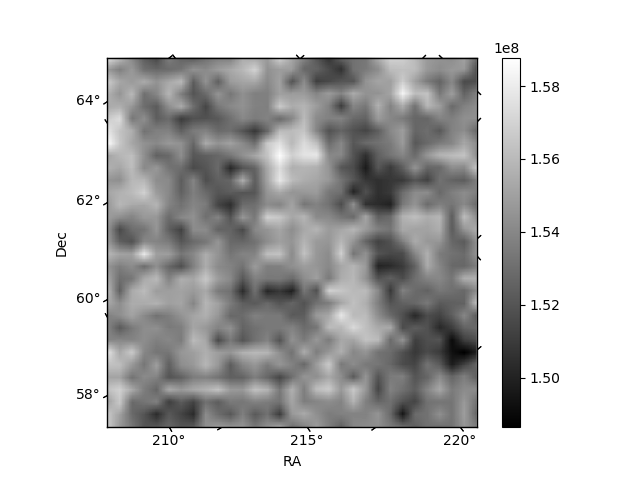
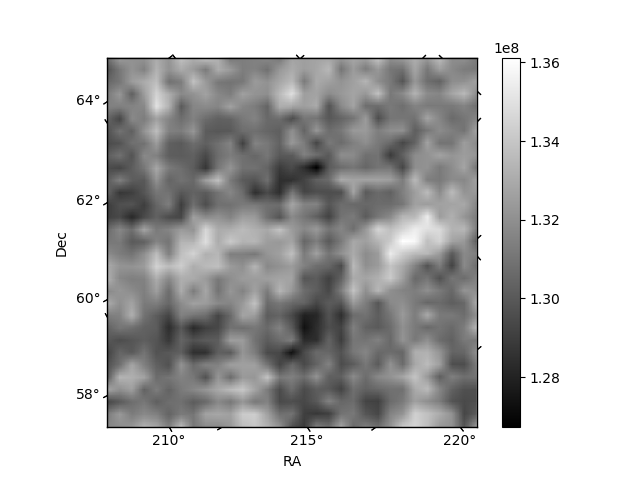
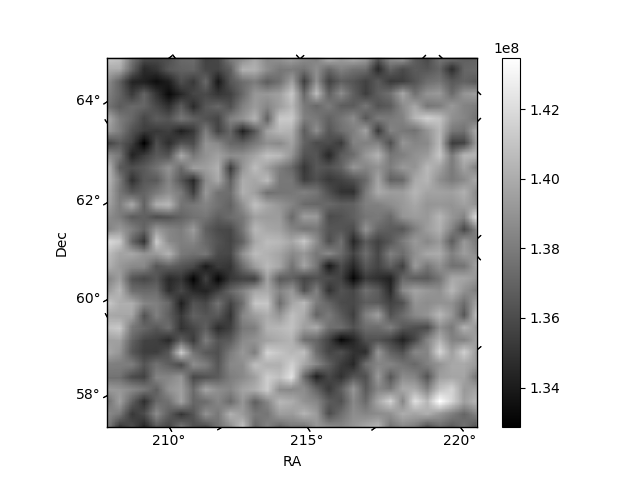
Histogram calculated using DETX and DETY for each event in the final _common_clean file
| Quadrant A | 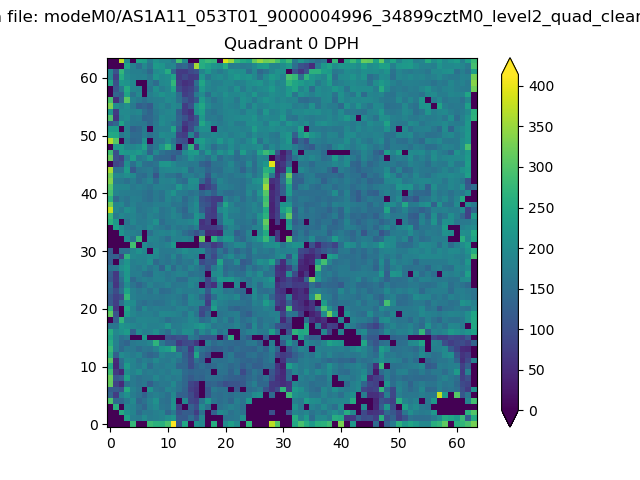 |
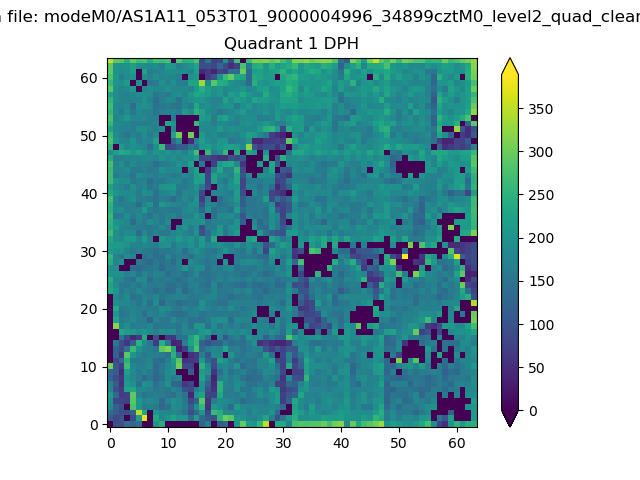 |
Quadrant B |
|---|---|---|---|
| Quadrant D | 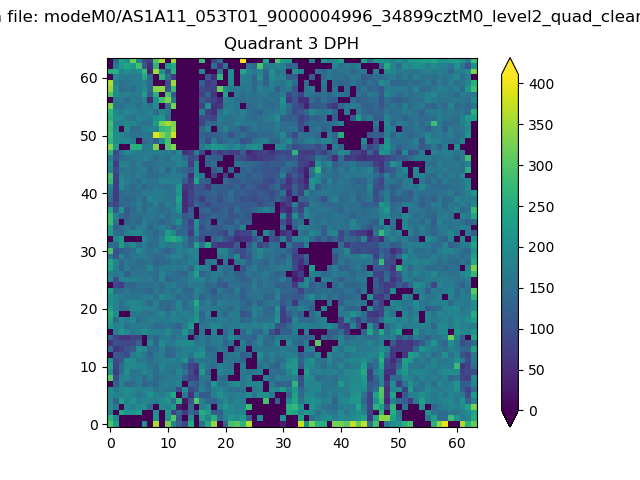 |
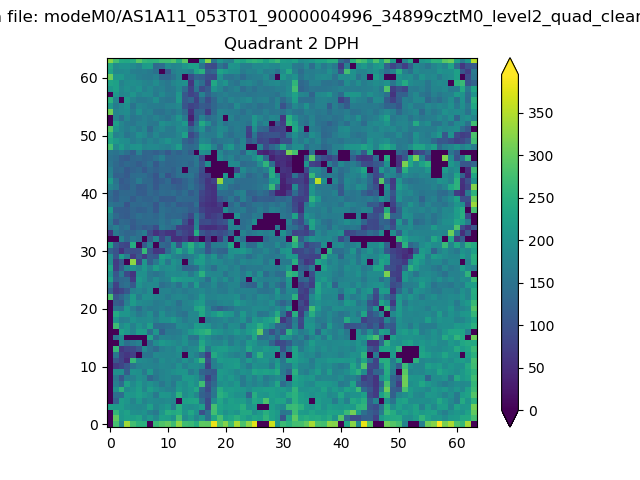 |
Quadrant C |
| Plot type | Count rate plots | Images |
|---|---|---|
| Comparison with Poisson distribution Blue bars denote a histogram of data divided into 1 sec bins. Red curve is a Poisson curve with rate = median count rate of data. |
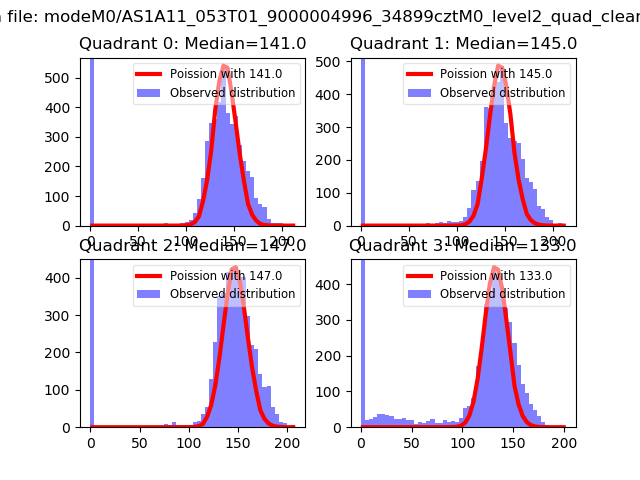 |
 |
| Quadrant-wise count rates Data is divided into 100 sec bins |
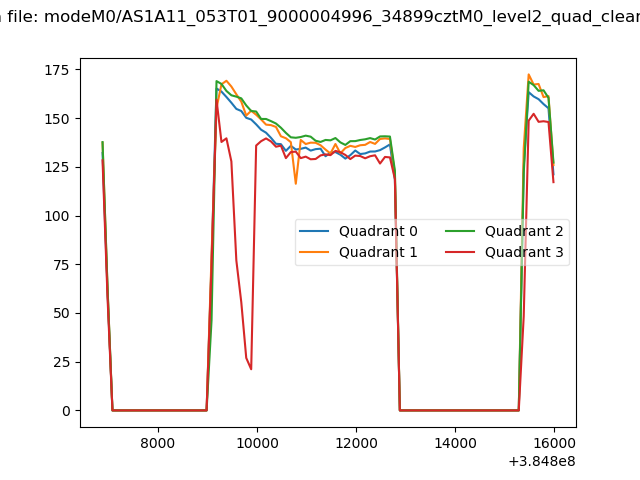 |
|
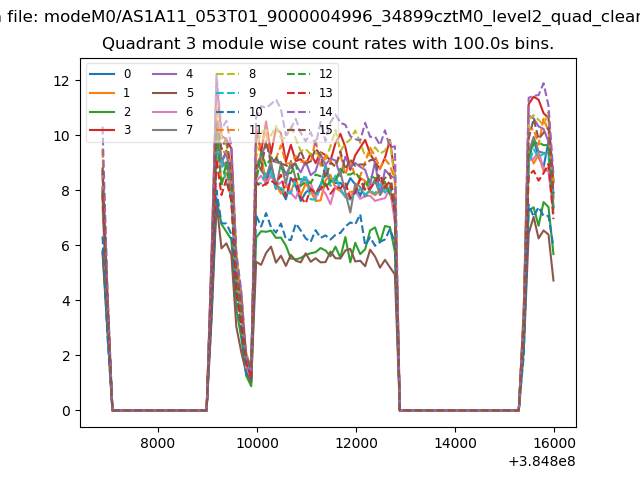
| Module-wise count rates for Quadrant A Data is divided into 100 sec bins |
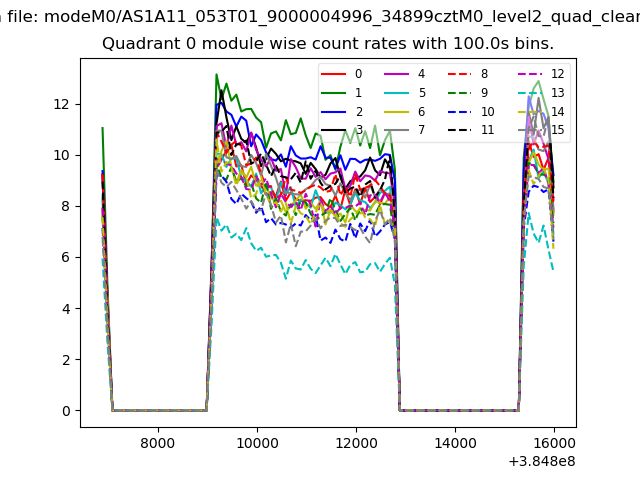 |
 |
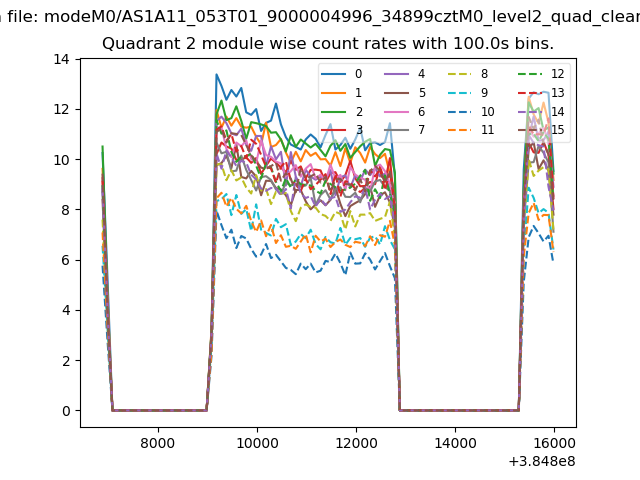
| Module-wise count rates for Quadrant B Data is divided into 100 sec bins |
 |
 |
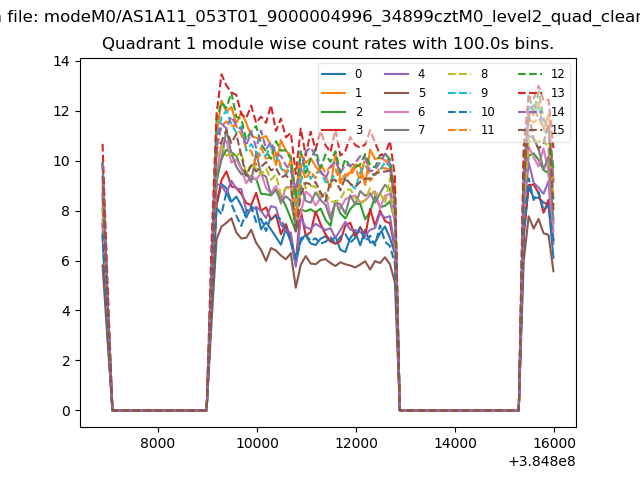
| Module-wise count rates for Quadrant C Data is divided into 100 sec bins |
 |
 |
| Module-wise count rates for Quadrant D Data is divided into 100 sec bins |
 |
 |
| Parameter | Plot |
|---|---|
| CZT HV Monitor | 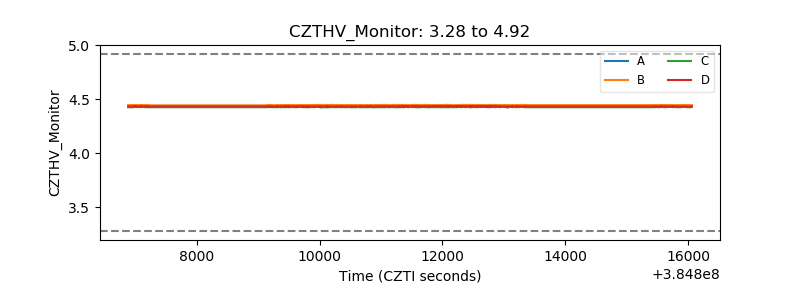 |
| D_VDD | 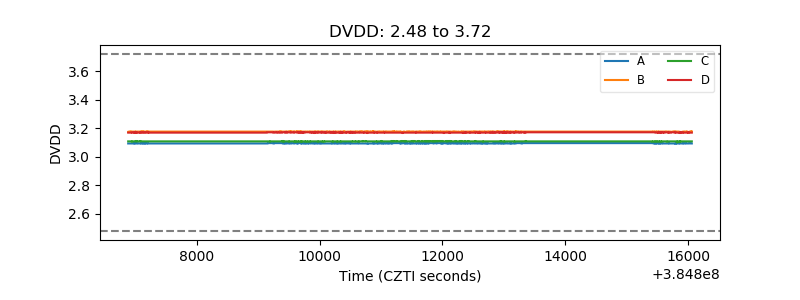 |
| Temperature 1 | 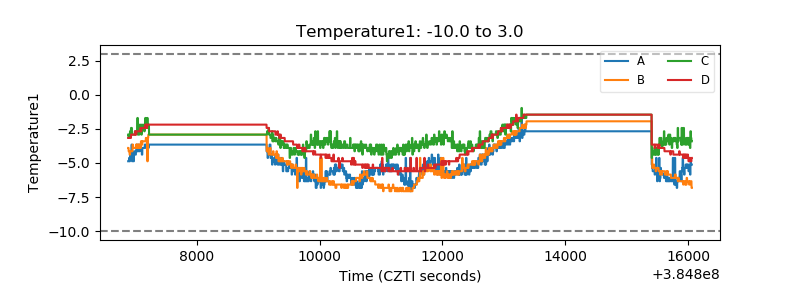 |
| Veto HV Monitor | 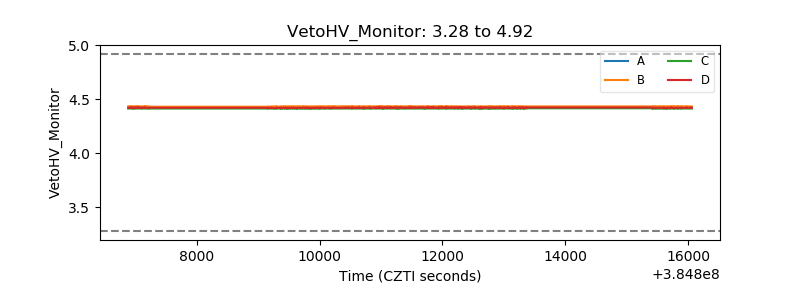 |
| Veto LLD | 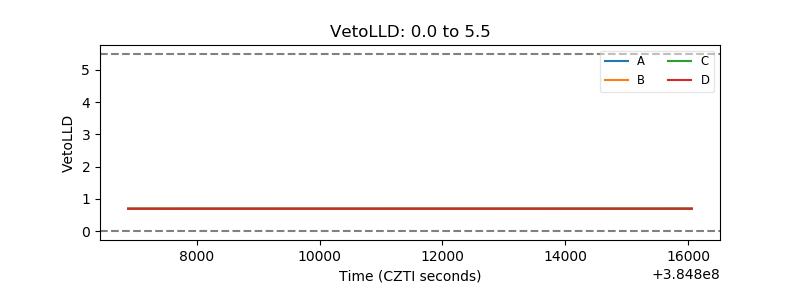 |
| Alpha Counter | 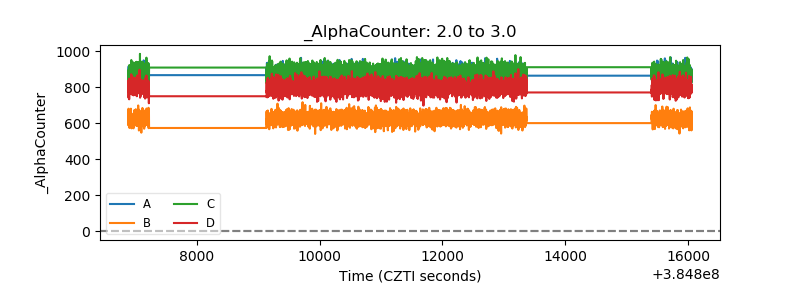 |
| _CPM_Rate | 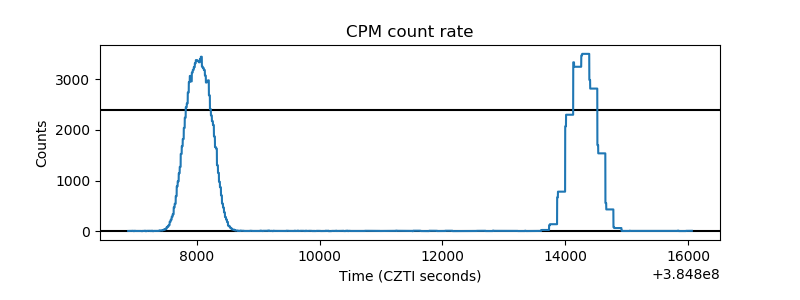 |
| CZT Counter | 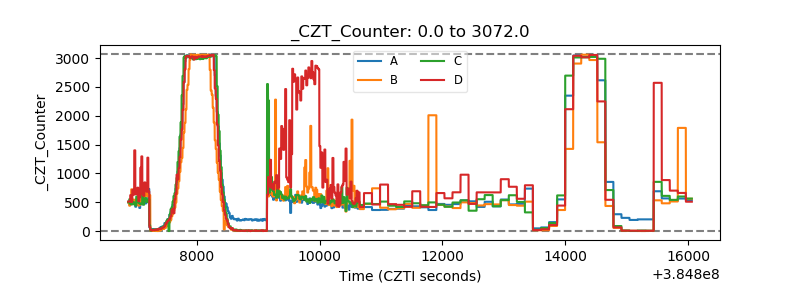 |
| +2.5 Volts monitor | 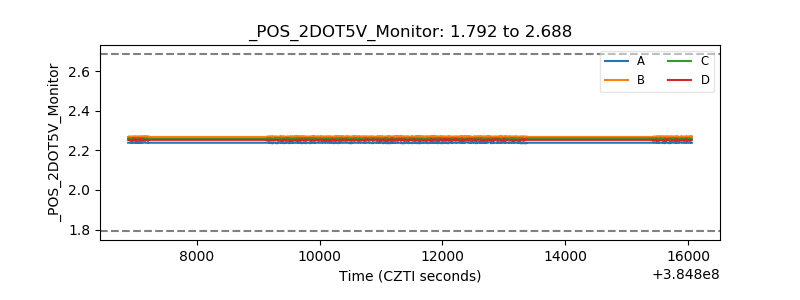 |
| +5 Volts monitor | 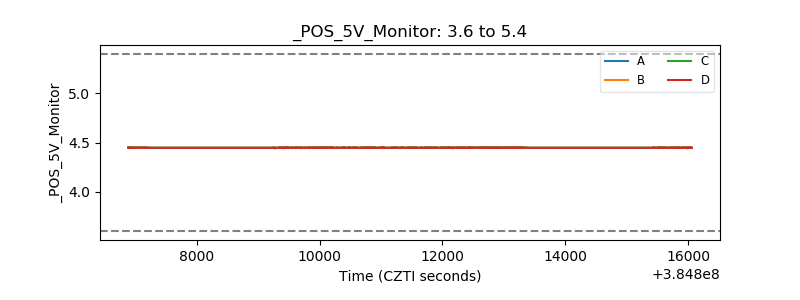 |
| _ROLL_ROT | 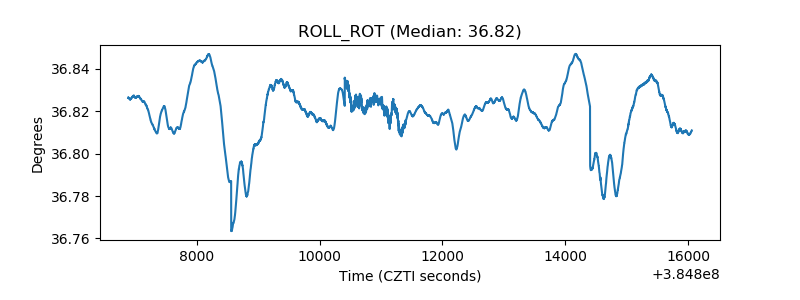 |
| _Roll_DEC | 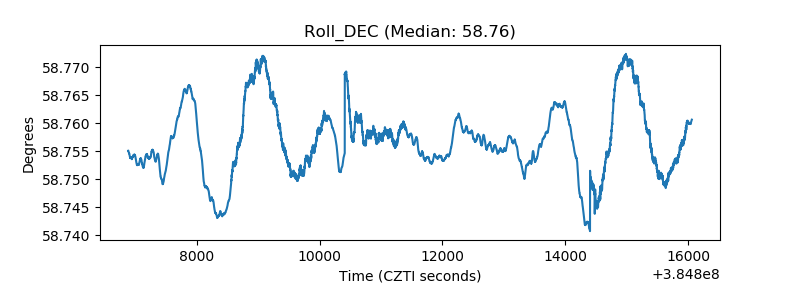 |
| _Roll_RA | 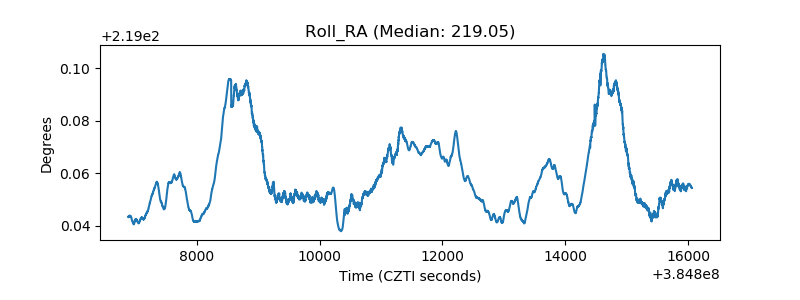 |
| Veto Counter | 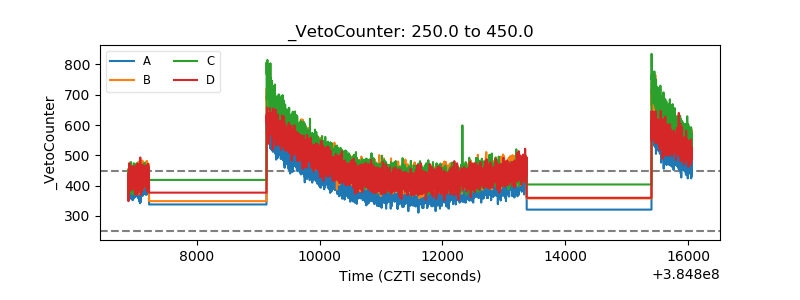 |