| Param | Original file | Final file |
|---|---|---|
| Filename | modeM0/AS1A11_053T01_9000004996_34898cztM0_level2.evt | modeM0/AS1A11_053T01_9000004996_34898cztM0_level2_quad_clean.evt |
| Size (bytes) | 449,737,920 | 96,808,320 |
| Size | 428.9 MB | 92.3 MB |
| Events in quadrant A | 2,459,338 | 653,277 |
| Events in quadrant B | 2,984,952 | 666,933 |
| Events in quadrant C | 2,884,829 | 672,227 |
| Events in quadrant D | 4,945,568 | 582,464 |
| Mode M9 | |||
|---|---|---|---|
| Quadrant | BADHDUFLAG | Total packets | Discarded packets |
| A | 0 | 24 | 0 |
| B | 0 | 24 | 0 |
| C | 0 | 24 | 0 |
| D | 0 | 25 | 0 |
| Mode SS | |||
|---|---|---|---|
| Quadrant | BADHDUFLAG | Total packets | Discarded packets |
| A | 0 | 102 | 0 |
| B | 0 | 102 | 0 |
| C | 0 | 102 | 0 |
| D | 0 | 102 | 0 |
| Mode M0 | |||
|---|---|---|---|
| Quadrant | BADHDUFLAG | Total packets | Discarded packets |
| A | 0 | 10685 | 3 |
| B | 0 | 12378 | 2 |
| C | 0 | 11723 | 2 |
| D | 0 | 18356 | 2 |
| Quadrant | Total seconds | Saturated seconds | Saturation percentage |
|---|---|---|---|
| A | 5097 | 5 | 0.098097% |
| B | 5097 | 99 | 1.942319% |
| C | 5097 | 98 | 1.922700% |
| D | 5097 | 743 | 14.577202% |
Noise dominated data is calculated using 1-second bins in cleaned event files. If a bin has >2000 counts, and if more than 50% of those come from <1% of pixels, then it is considered to be noise-dominated and hence unusable.
| Quadrant | # 1 sec bins | Bins with >0 counts | Bins with >2000 counts | High rate bins dominated by noise | Noise dominated (total time) | Noise dominated (detector-on time) | Marked lightcurve |
|---|---|---|---|---|---|---|---|
| A | 7011 | 5098 | 0 | 0 | 0.00% | 0.00% | 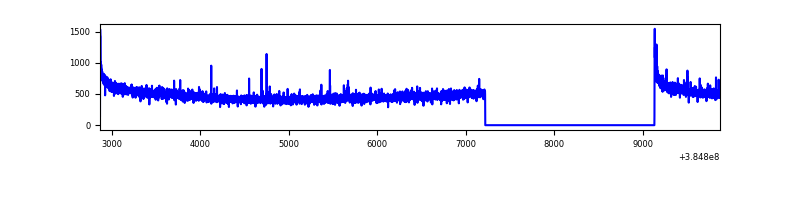 |
| B | 7011 | 5098 | 64 | 64 | 0.91% | 1.26% | 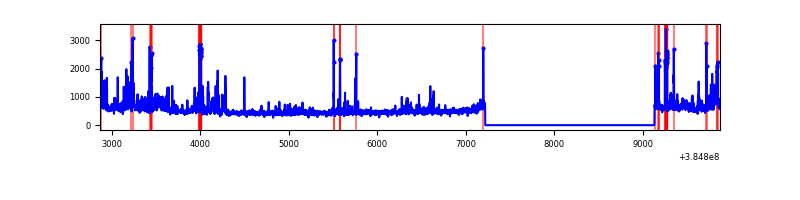 |
| C | 7011 | 5098 | 76 | 76 | 1.08% | 1.49% | 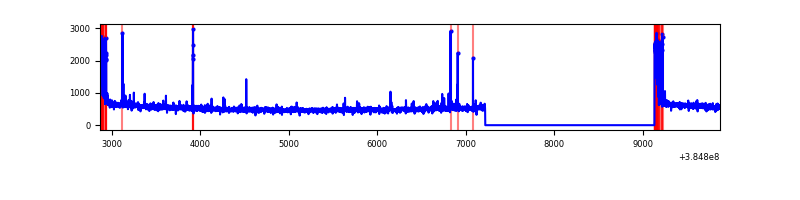 |
| D | 7010 | 5097 | 670 | 670 | 9.56% | 13.14% | 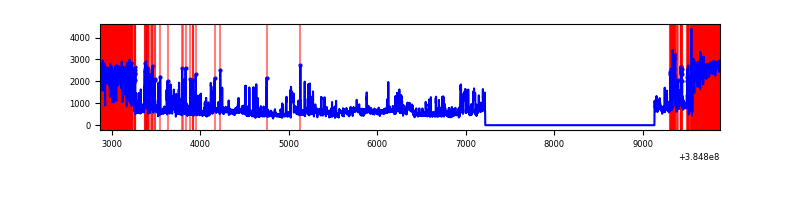 |
Top three noisy pixels from each quadrant. If the there are fewer than three noisy pixels in the level2.evt file, extra rows are filled as -1
| Pixel properties | Quadrant properties | ||||||
|---|---|---|---|---|---|---|---|
| Quadrant | DetID | PixID | Counts | Sigma | Mean | Median | Sigma |
| A | 10 | 83 | 60437 | 487.71 | 612 | 603 | 122.7 |
| A | 13 | 254 | 10084 | 77.28 | 612 | 603 | 122.7 |
| A | 7 | 16 | 7270 | 54.34 | 612 | 603 | 122.7 |
| B | 5 | 172 | 224372 | 1934.97 | 613 | 600 | 115.6 |
| B | 0 | 190 | 166956 | 1438.49 | 613 | 600 | 115.6 |
| B | 5 | 255 | 56189 | 480.68 | 613 | 600 | 115.6 |
| C | 15 | 214 | 231390 | 1659.64 | 607 | 612 | 139.1 |
| C | 0 | 10 | 203013 | 1455.56 | 607 | 612 | 139.1 |
| C | 12 | 250 | 26944 | 189.37 | 607 | 612 | 139.1 |
| D | 8 | 195 | 894557 | 6577.03 | 558 | 544 | 135.9 |
| D | 10 | 118 | 772796 | 5681.26 | 558 | 544 | 135.9 |
| D | 1 | 52 | 686778 | 5048.45 | 558 | 544 | 135.9 |
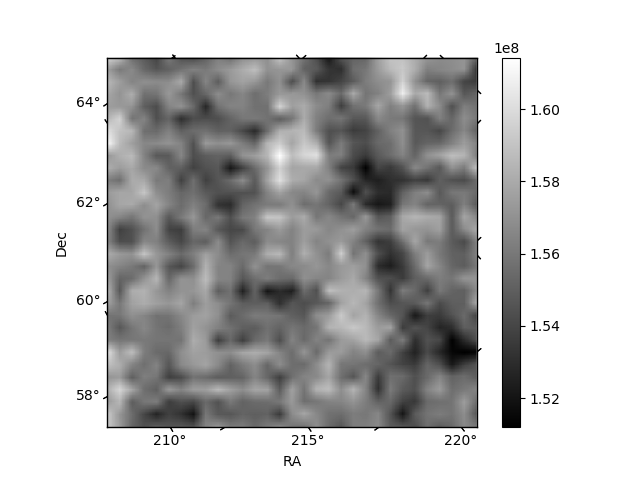
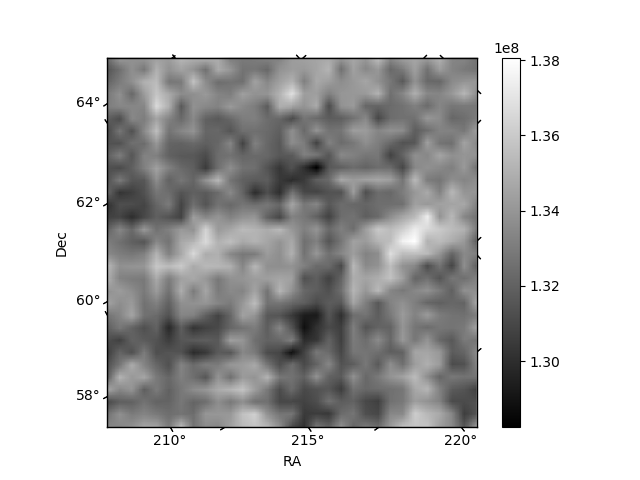
Histogram calculated using DETX and DETY for each event in the final _common_clean file
| Quadrant A | 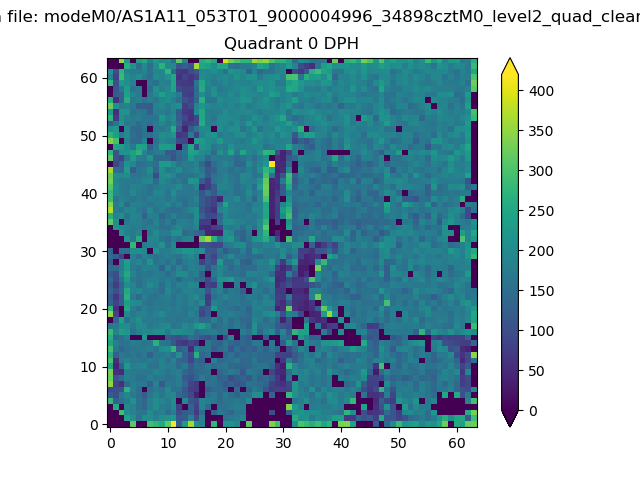 |
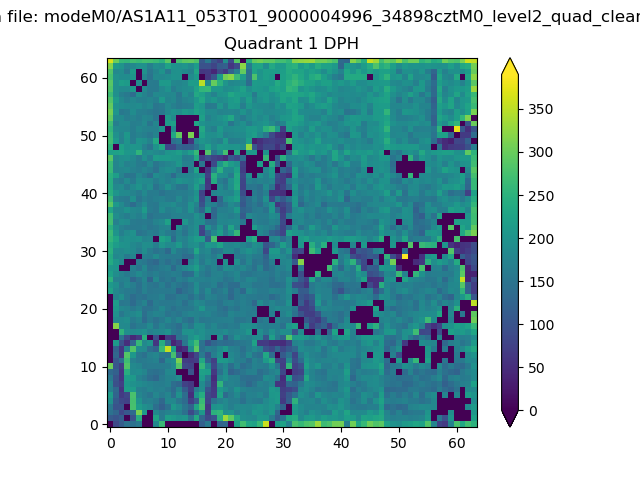 |
Quadrant B |
|---|---|---|---|
| Quadrant D | 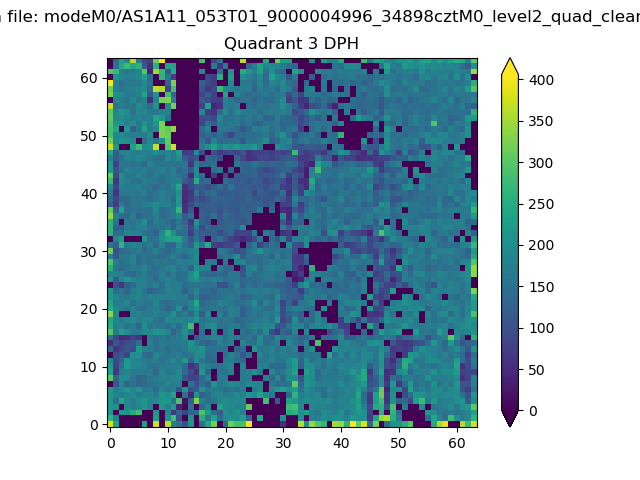 |
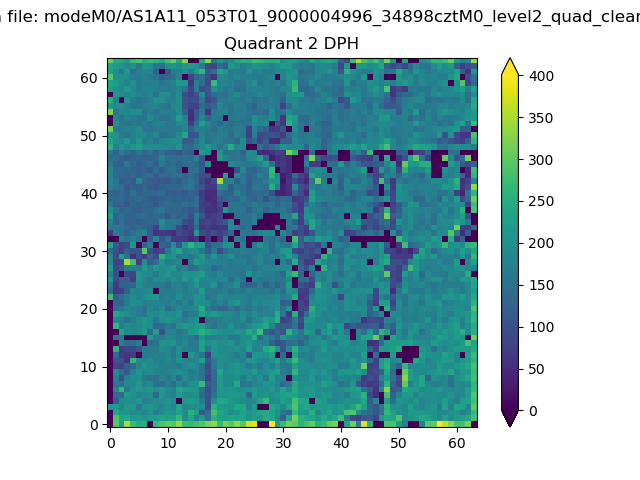 |
Quadrant C |
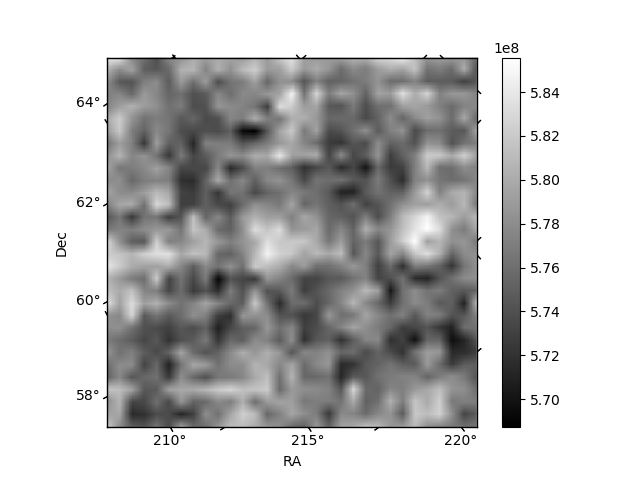
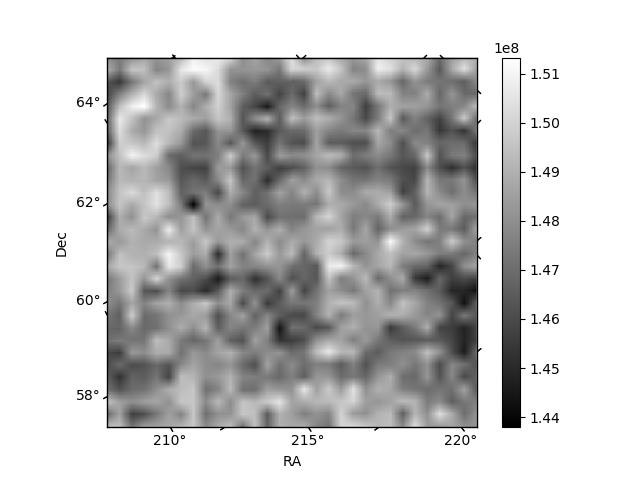
| Plot type | Count rate plots | Images |
|---|---|---|
| Comparison with Poisson distribution Blue bars denote a histogram of data divided into 1 sec bins. Red curve is a Poisson curve with rate = median count rate of data. |
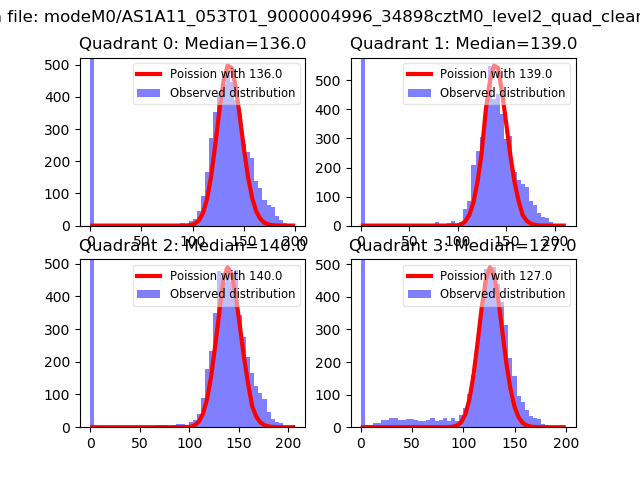 |
 |
| Quadrant-wise count rates Data is divided into 100 sec bins |
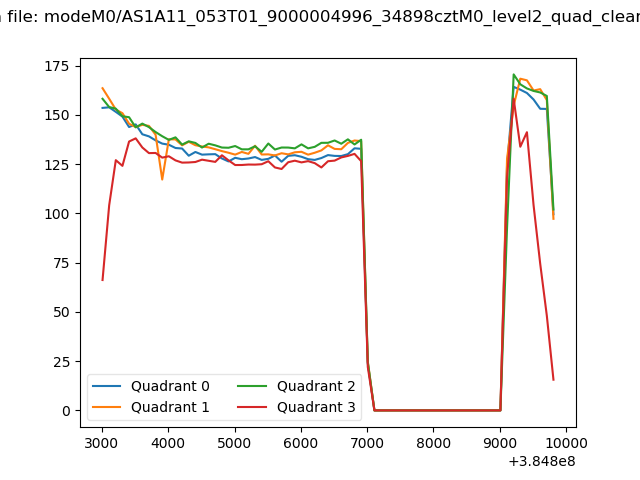 |
|
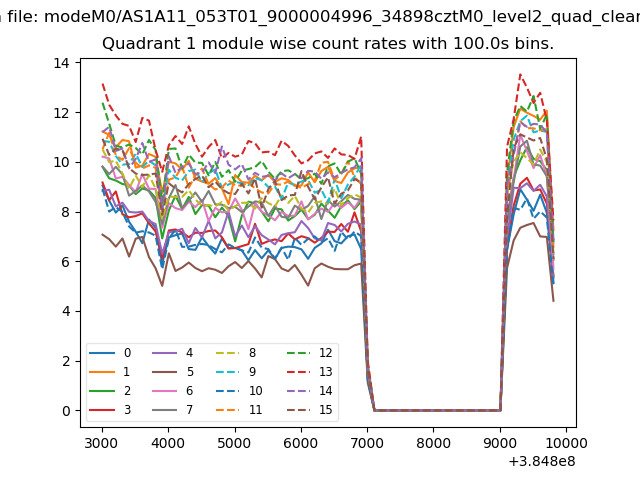
| Module-wise count rates for Quadrant A Data is divided into 100 sec bins |
 |
 |
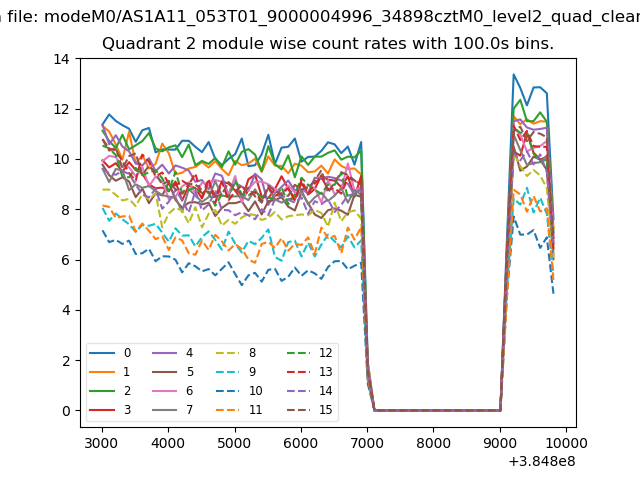
| Module-wise count rates for Quadrant B Data is divided into 100 sec bins |
 |
 |
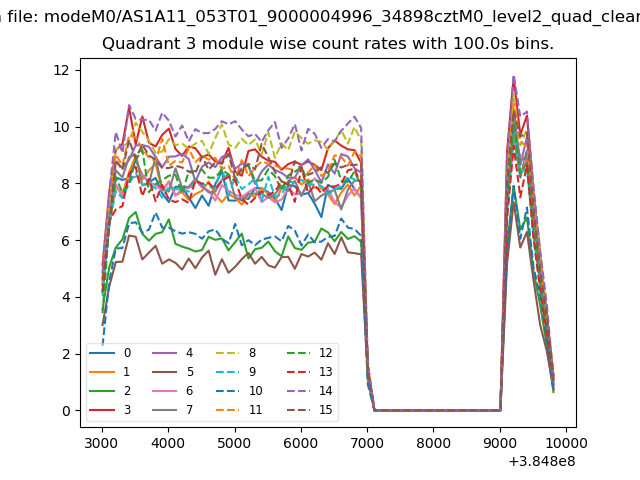
| Module-wise count rates for Quadrant C Data is divided into 100 sec bins |
 |
 |
| Module-wise count rates for Quadrant D Data is divided into 100 sec bins |
 |
 |
| Parameter | Plot |
|---|---|
| CZT HV Monitor |  |
| D_VDD | 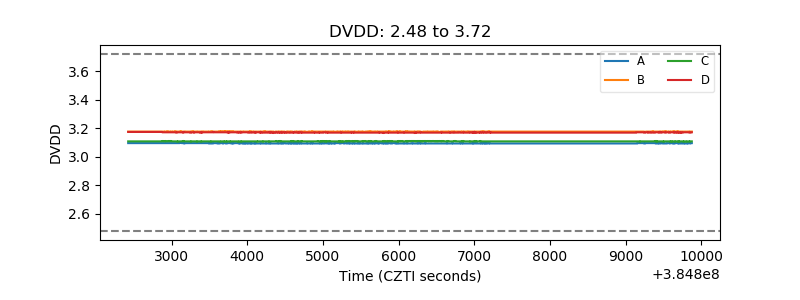 |
| Temperature 1 | 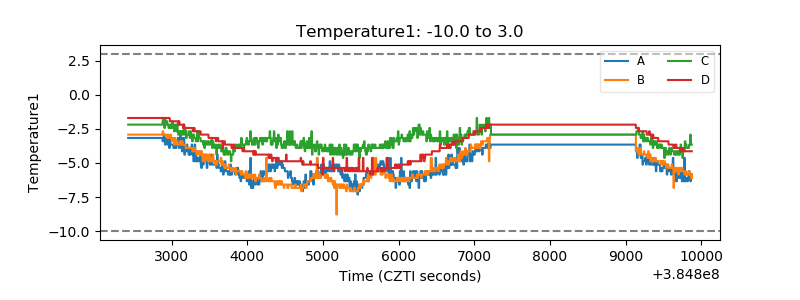 |
| Veto HV Monitor | 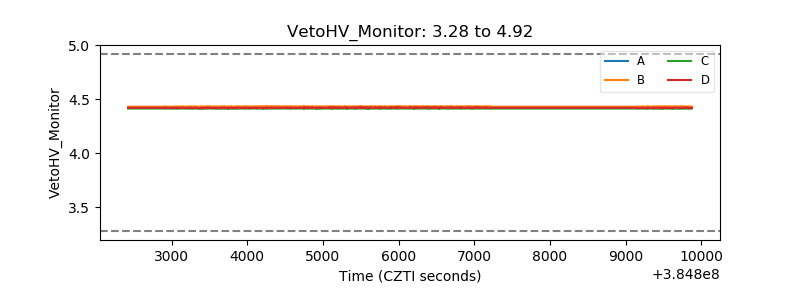 |
| Veto LLD | 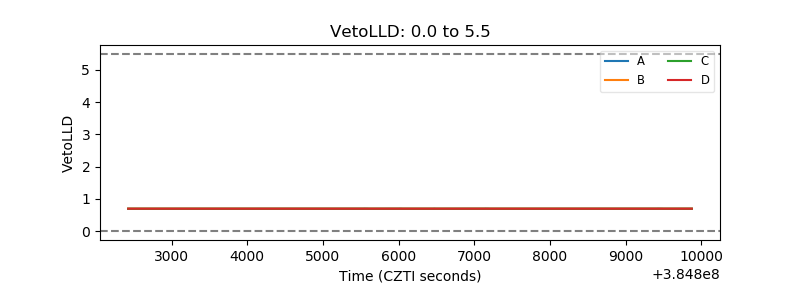 |
| Alpha Counter | 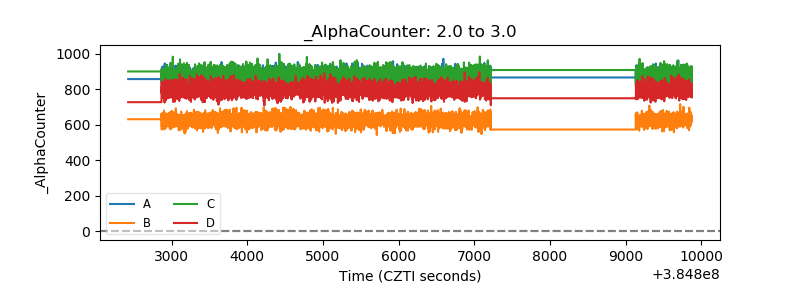 |
| _CPM_Rate | 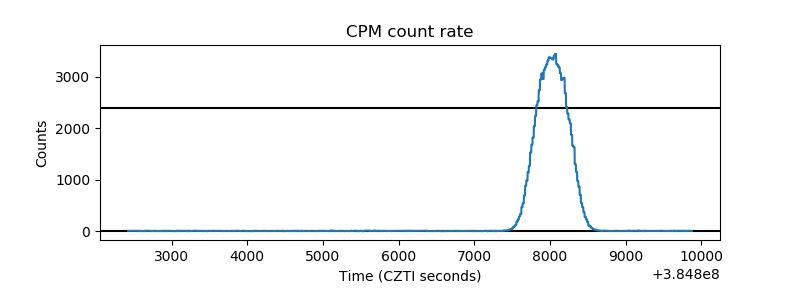 |
| CZT Counter | 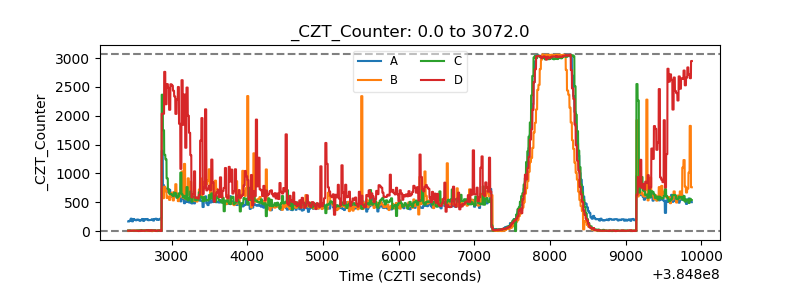 |
| +2.5 Volts monitor | 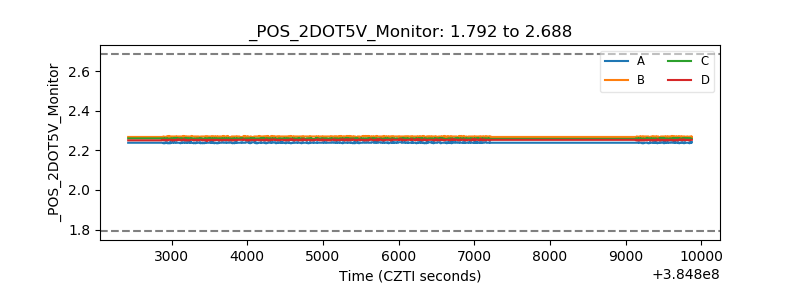 |
| +5 Volts monitor | 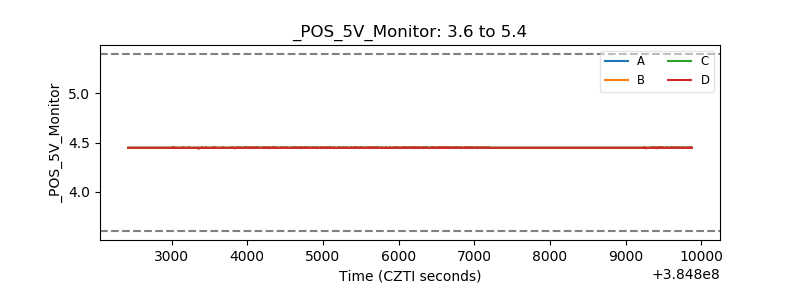 |
| _ROLL_ROT | 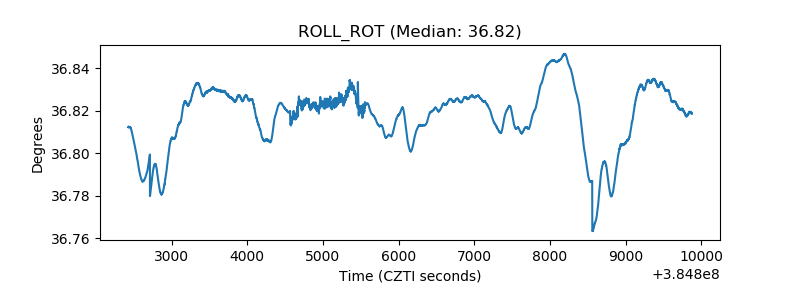 |
| _Roll_DEC | 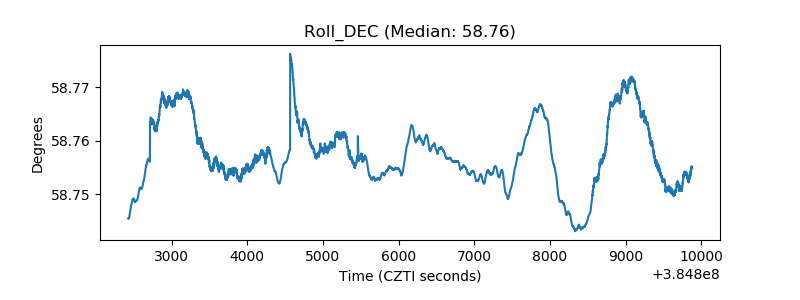 |
| _Roll_RA | 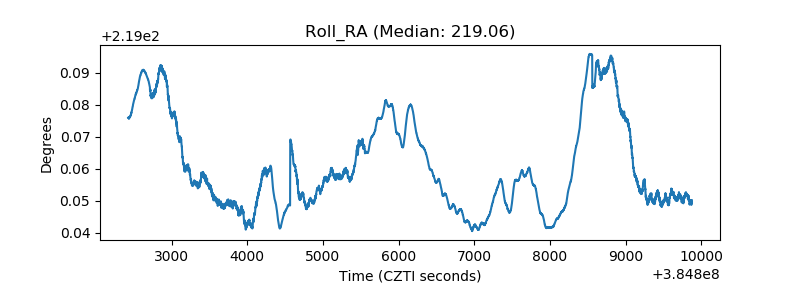 |
| Veto Counter | 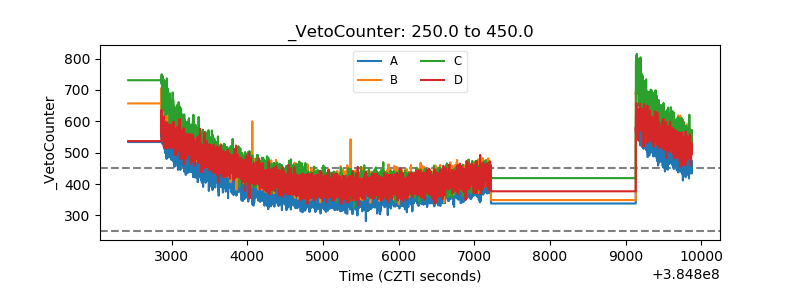 |