| Param | Original file | Final file |
|---|---|---|
| Filename | modeM0/AS1A11_053T01_9000004996cztM0_level2_bc.evt | modeM0/AS1A11_053T01_9000004996cztM0_level2_quad_clean.evt |
| Size (bytes) | 1,087,896,960 | 423,691,200 |
| Size | 1.0 GB | 404.1 MB |
| Events in quadrant A | 5,410,607 | 2,791,109 |
| Events in quadrant B | 6,965,311 | 2,853,248 |
| Events in quadrant C | 6,882,380 | 2,891,891 |
| Events in quadrant D | 12,025,533 | 2,620,739 |
| Mode M9 | |||
|---|---|---|---|
| Quadrant | BADHDUFLAG | Total packets | Discarded packets |
| A | 0 | 117 | 0 |
| B | 0 | 117 | 0 |
| C | 0 | 117 | 0 |
| D | 0 | 117 | 0 |
| Mode SS | |||
|---|---|---|---|
| Quadrant | BADHDUFLAG | Total packets | Discarded packets |
| A | 0 | 500 | 0 |
| B | 0 | 500 | 0 |
| C | 0 | 500 | 0 |
| D | 0 | 500 | 0 |
| Mode M0 | |||
|---|---|---|---|
| Quadrant | BADHDUFLAG | Total packets | Discarded packets |
| A | 0 | 50063 | 0 |
| B | 0 | 56929 | 0 |
| C | 0 | 52671 | 0 |
| D | 0 | 72506 | 0 |
| Quadrant | Total seconds | Saturated seconds | Saturation percentage |
|---|---|---|---|
| A | 24376 | 27 | 0.110765% |
| B | 24376 | 461 | 1.891204% |
| C | 24376 | 226 | 0.927141% |
| D | 24376 | 1261 | 5.173121% |
Noise dominated data is calculated using 1-second bins in cleaned event files. If a bin has >2000 counts, and if more than 50% of those come from <1% of pixels, then it is considered to be noise-dominated and hence unusable.
| Quadrant | # 1 sec bins | Bins with >0 counts | Bins with >2000 counts | High rate bins dominated by noise | Noise dominated (total time) | Noise dominated (detector-on time) | Marked lightcurve |
|---|---|---|---|---|---|---|---|
| A | 36035 | 24382 | 0 | 0 | 0.00% | 0.00% | 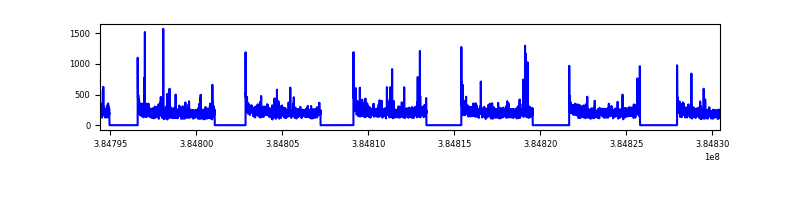 |
| B | 36035 | 24376 | 66 | 66 | 0.18% | 0.27% | 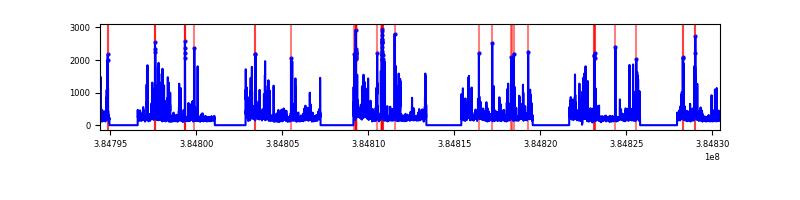 |
| C | 36035 | 24377 | 15 | 15 | 0.04% | 0.06% | 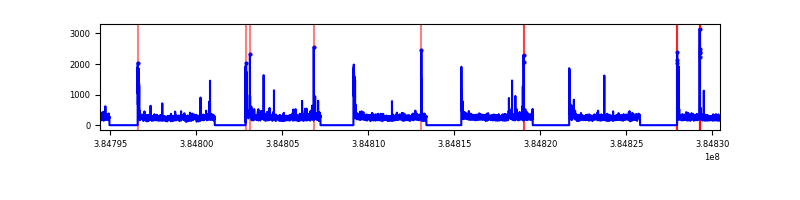 |
| D | 36035 | 24375 | 188 | 188 | 0.52% | 0.77% | 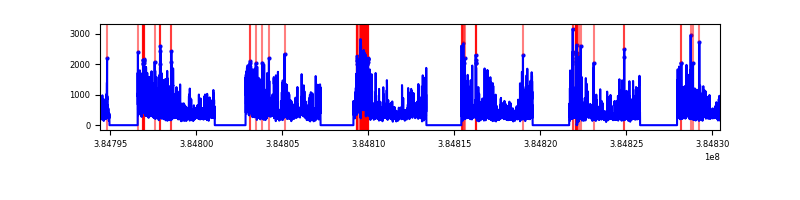 |
Top three noisy pixels from each quadrant. If the there are fewer than three noisy pixels in the level2.evt file, extra rows are filled as -1
| Pixel properties | Quadrant properties | ||||||
|---|---|---|---|---|---|---|---|
| Quadrant | DetID | PixID | Counts | Sigma | Mean | Median | Sigma |
| A | 10 | 83 | 197175 | 684.13 | 1311 | 1296 | 286.3 |
| A | 13 | 254 | 42017 | 142.22 | 1311 | 1296 | 286.3 |
| A | 7 | 16 | 38553 | 130.12 | 1311 | 1296 | 286.3 |
| B | 5 | 172 | 668263 | 2567.02 | 1334 | 1308 | 259.8 |
| B | 0 | 190 | 368046 | 1411.53 | 1334 | 1308 | 259.8 |
| B | 0 | 218 | 147671 | 563.33 | 1334 | 1308 | 259.8 |
| C | 15 | 214 | 1040385 | 3402.96 | 1330 | 1325 | 305.3 |
| C | 0 | 10 | 340360 | 1110.35 | 1330 | 1325 | 305.3 |
| C | 14 | 67 | 129760 | 420.63 | 1330 | 1325 | 305.3 |
| D | 8 | 195 | 3949002 | 13031.0 | 1279 | 1243 | 303.0 |
| D | 1 | 52 | 823281 | 2713.43 | 1279 | 1243 | 303.0 |
| D | 10 | 118 | 469943 | 1547.11 | 1279 | 1243 | 303.0 |
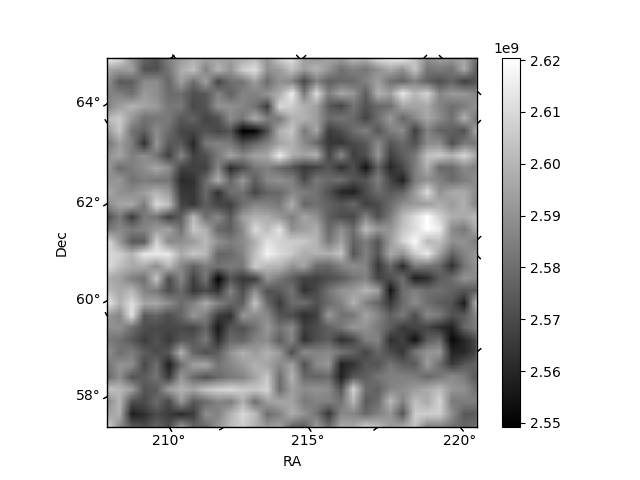
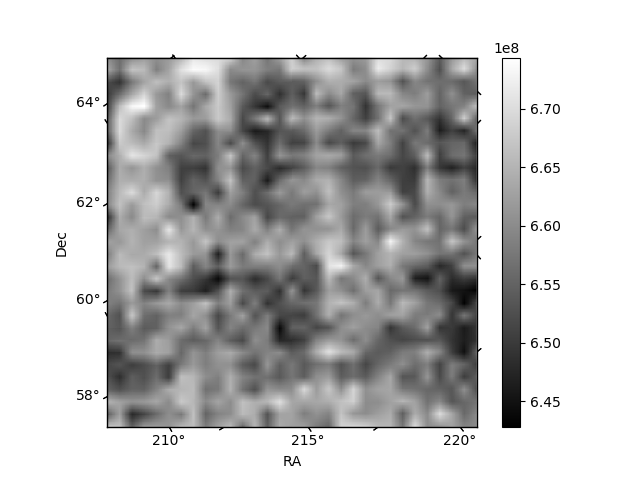
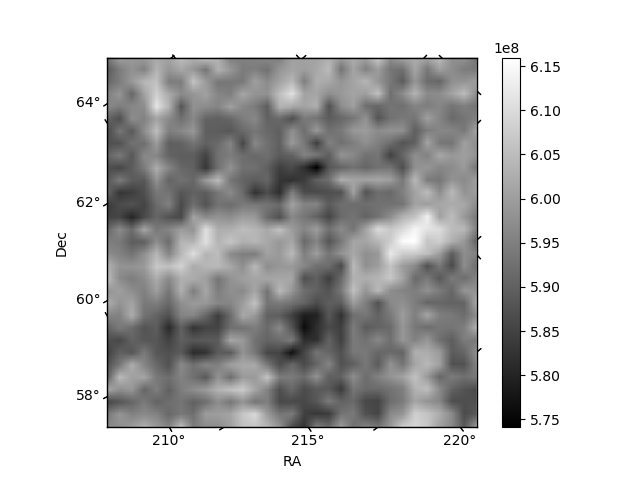
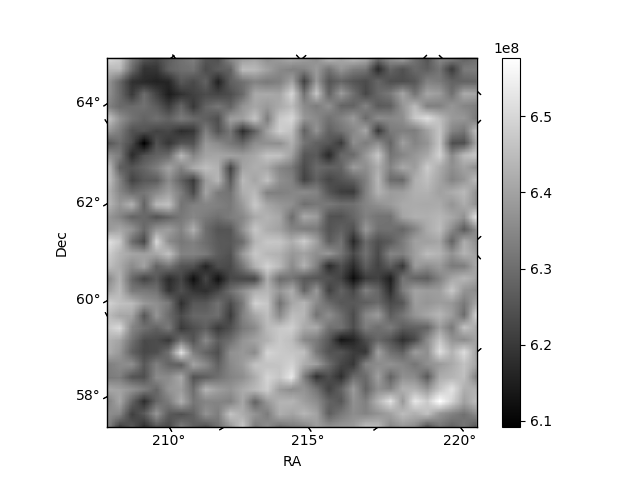
Histogram calculated using DETX and DETY for each event in the final _common_clean file
| Quadrant A | 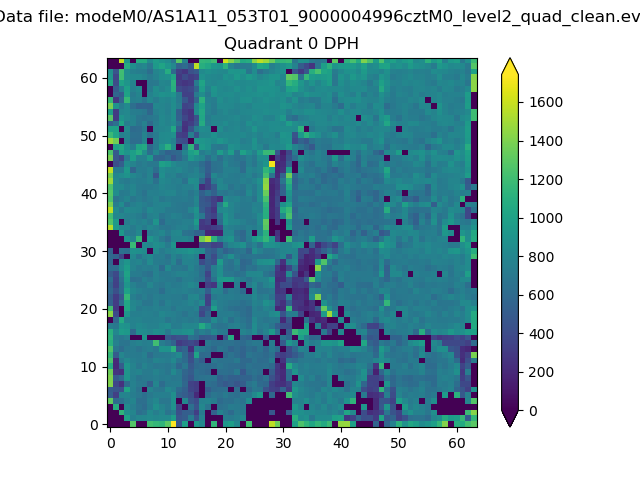 |
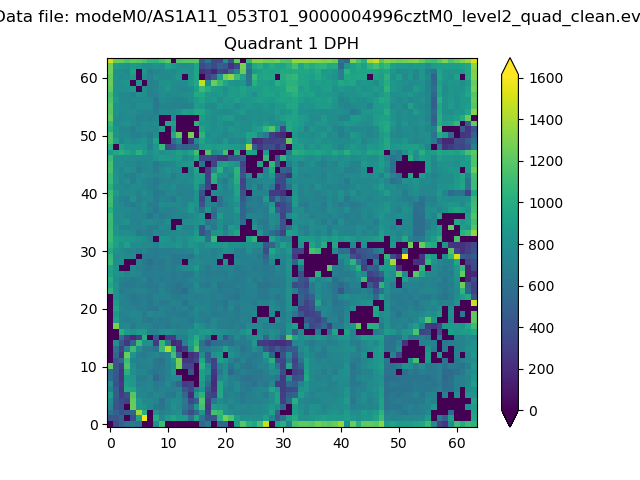 |
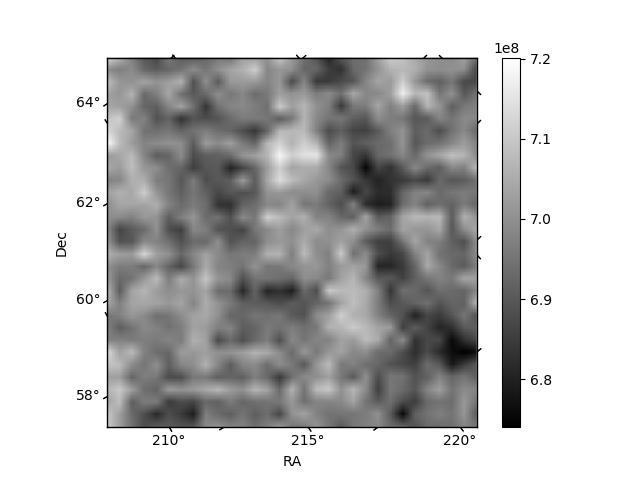
Quadrant B |
|---|---|---|---|
| Quadrant D | 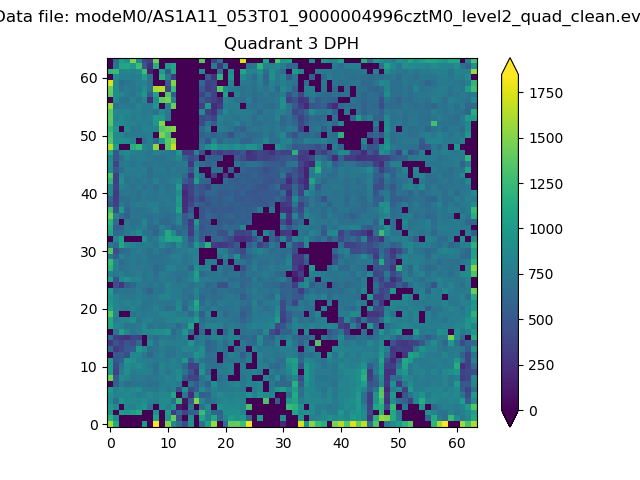 |
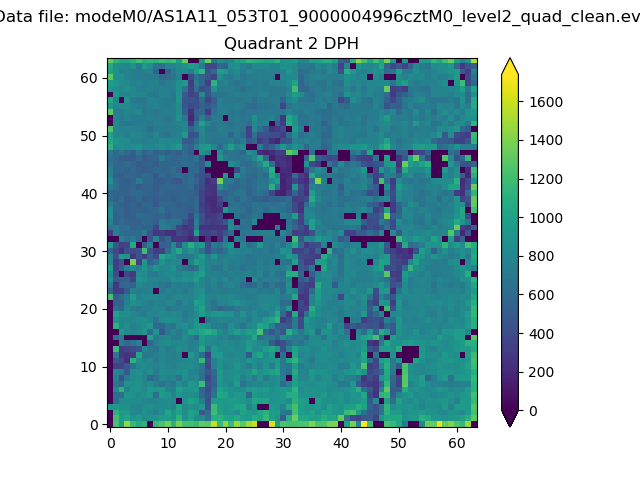 |
Quadrant C |
| Plot type | Count rate plots | Images |
|---|---|---|
| Comparison with Poisson distribution Blue bars denote a histogram of data divided into 1 sec bins. Red curve is a Poisson curve with rate = median count rate of data. |
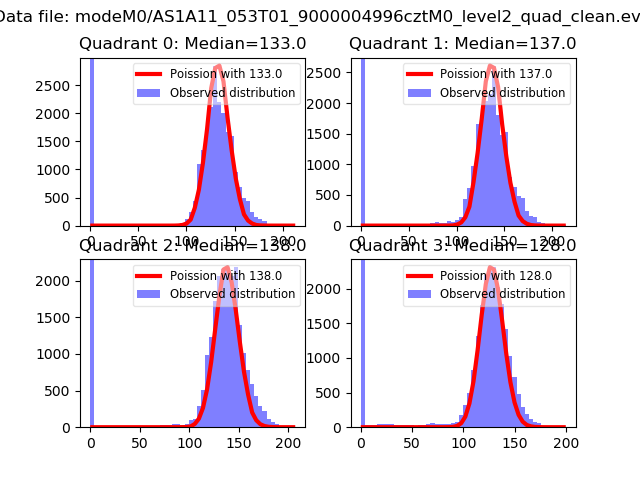 |
 |
| Quadrant-wise count rates Data is divided into 100 sec bins |
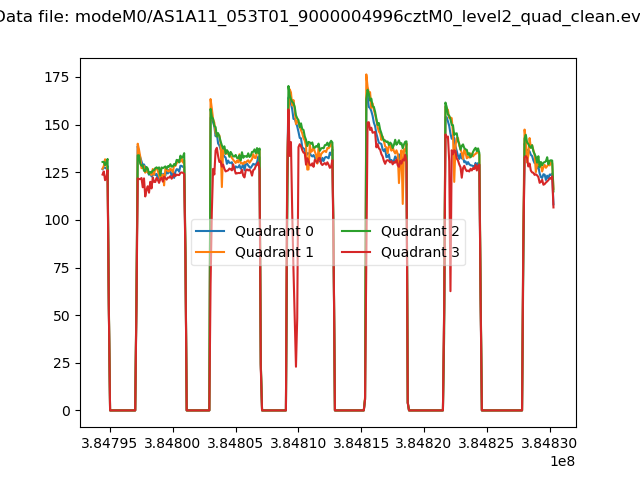 |
|
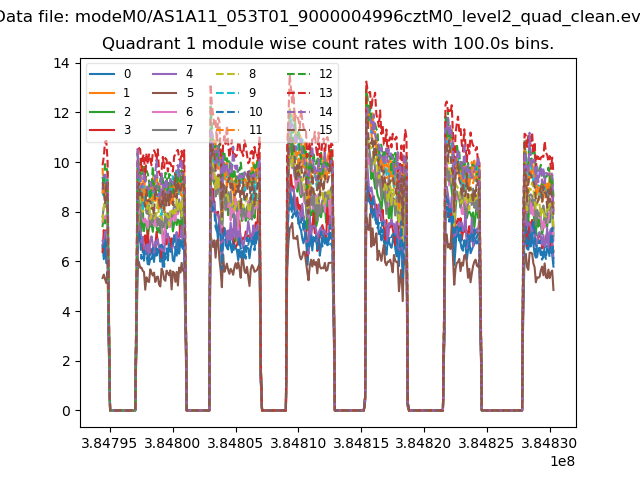
| Module-wise count rates for Quadrant A Data is divided into 100 sec bins |
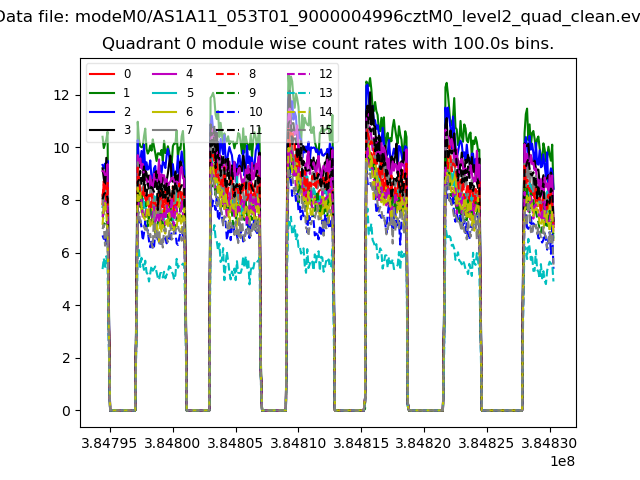 |
 |
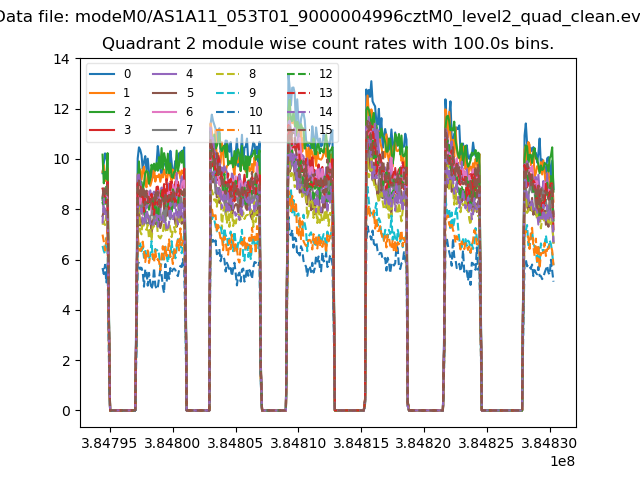
| Module-wise count rates for Quadrant B Data is divided into 100 sec bins |
 |
 |
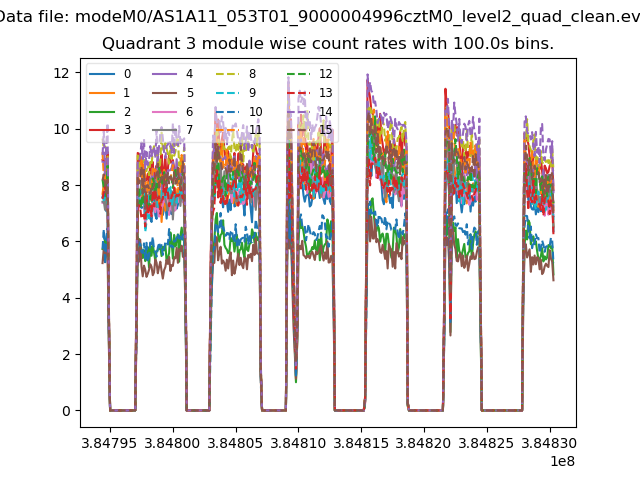
| Module-wise count rates for Quadrant C Data is divided into 100 sec bins |
 |
 |
| Module-wise count rates for Quadrant D Data is divided into 100 sec bins |
 |
 |
| Parameter | Plot |
|---|---|
| CZT HV Monitor | 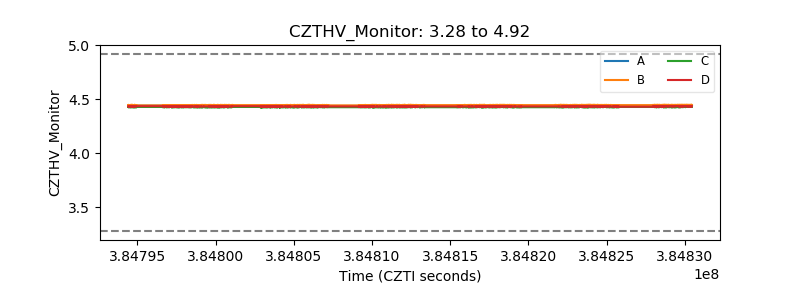 |
| D_VDD | 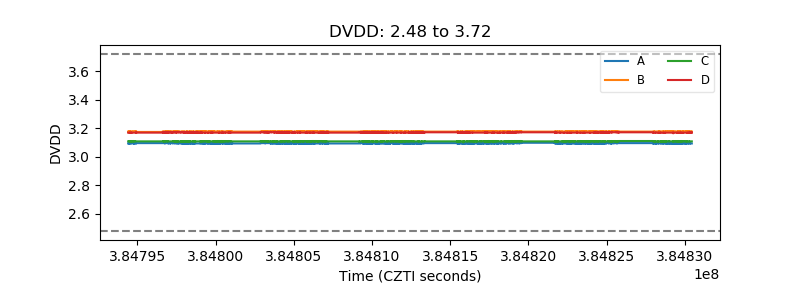 |
| Temperature 1 | 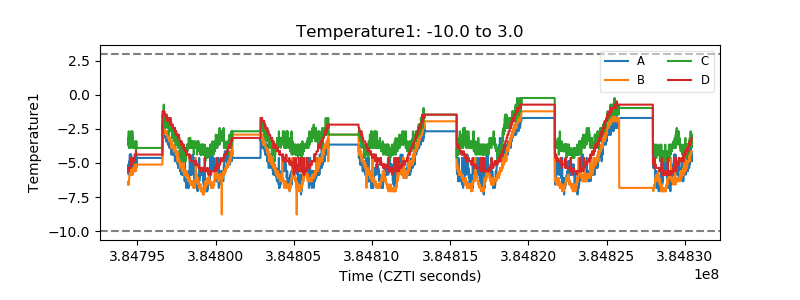 |
| Veto HV Monitor | 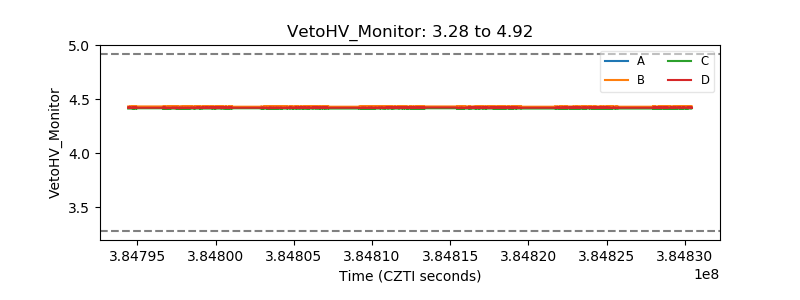 |
| Veto LLD | 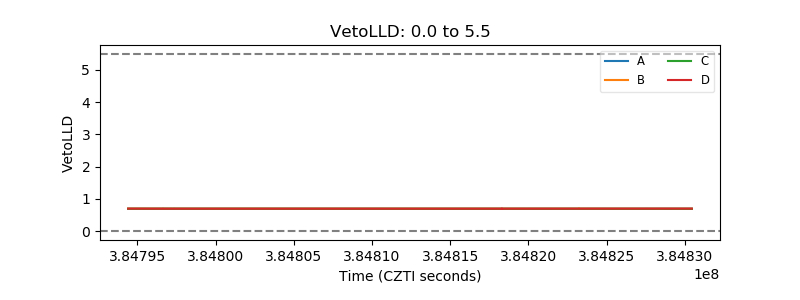 |
| Alpha Counter | 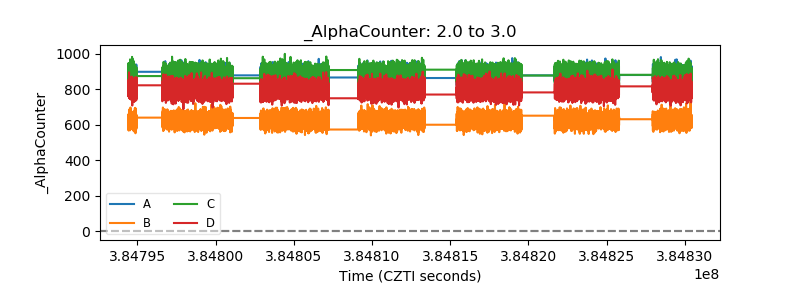 |
| _CPM_Rate | 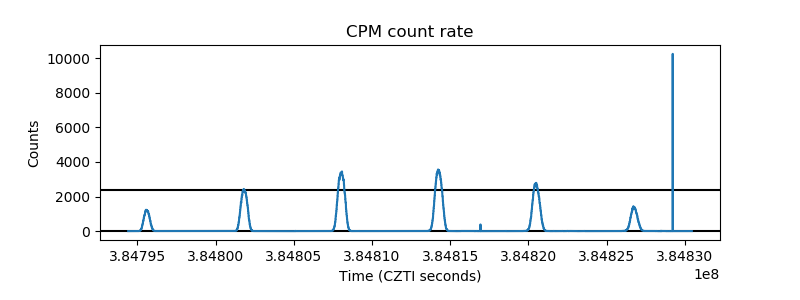 |
| CZT Counter | 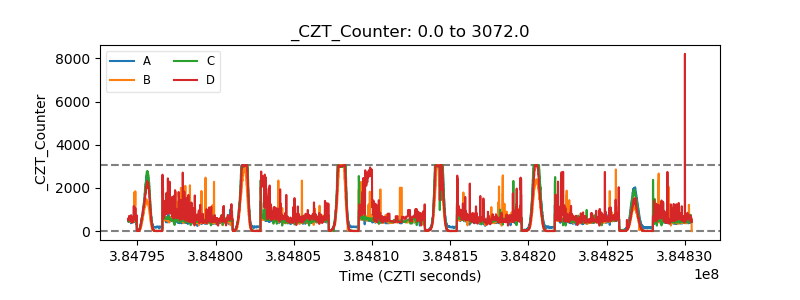 |
| +2.5 Volts monitor | 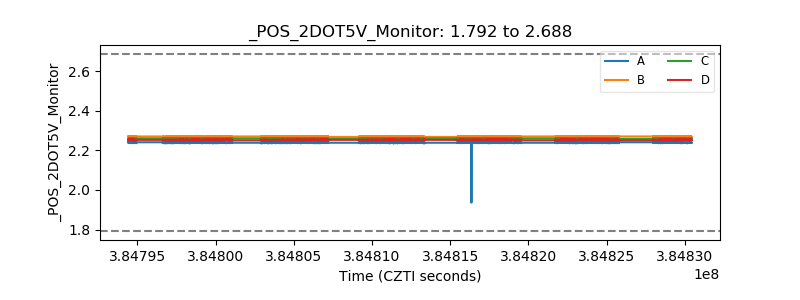 |
| +5 Volts monitor | 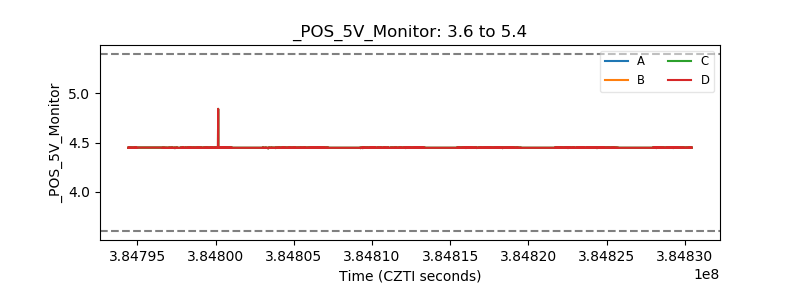 |
| _ROLL_ROT | 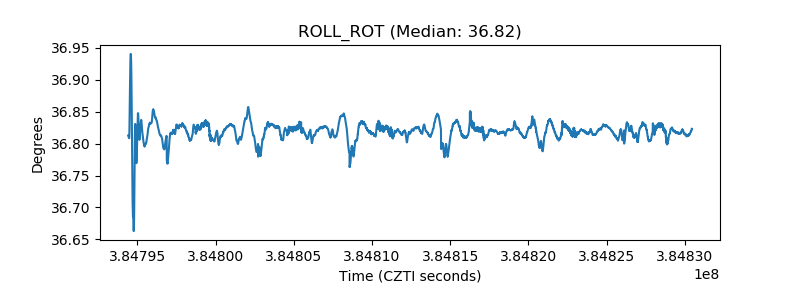 |
| _Roll_DEC | 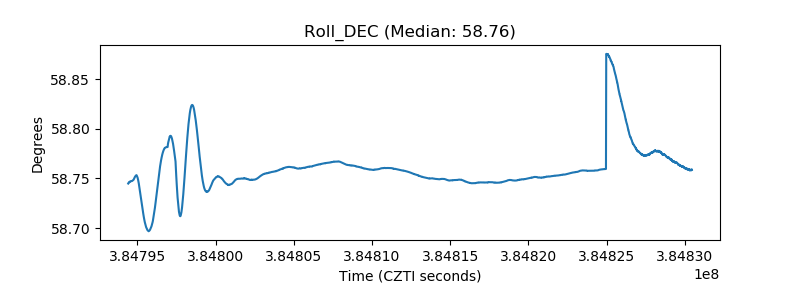 |
| _Roll_RA | 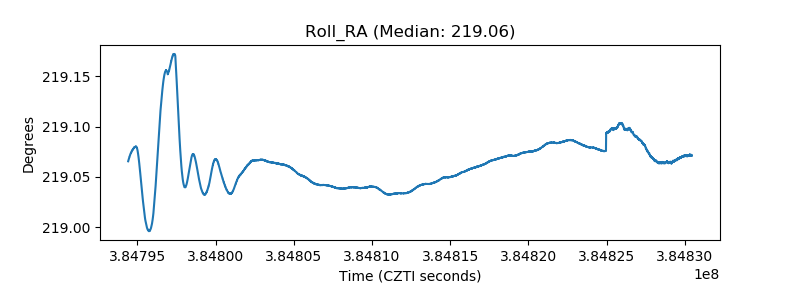 |
| Veto Counter | 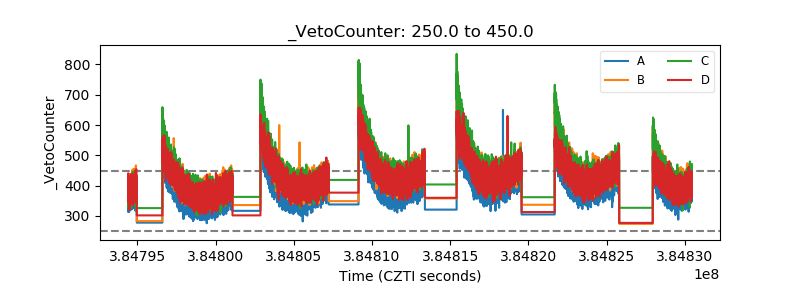 |