| Param | Original file | Final file |
|---|---|---|
| Filename | modeM0/AS1C07_005T01_9000004992_34884cztM0_level2.evt | modeM0/AS1C07_005T01_9000004992_34884cztM0_level2_quad_clean.evt |
| Size (bytes) | 454,052,160 | 86,425,920 |
| Size | 433.0 MB | 82.4 MB |
| Events in quadrant A | 3,034,464 | 570,692 |
| Events in quadrant B | 3,070,056 | 596,058 |
| Events in quadrant C | 2,780,071 | 570,762 |
| Events in quadrant D | 4,521,194 | 522,914 |
| Mode M9 | |||
|---|---|---|---|
| Quadrant | BADHDUFLAG | Total packets | Discarded packets |
| A | 0 | 32 | 0 |
| B | 0 | 32 | 0 |
| C | 0 | 32 | 0 |
| D | 0 | 33 | 0 |
| Mode M0 | |||
|---|---|---|---|
| Quadrant | BADHDUFLAG | Total packets | Discarded packets |
| A | 0 | 12229 | 3 |
| B | 0 | 12385 | 2 |
| C | 0 | 11127 | 2 |
| D | 0 | 17083 | 2 |
| Mode SS | |||
|---|---|---|---|
| Quadrant | BADHDUFLAG | Total packets | Discarded packets |
| A | 0 | 102 | 0 |
| B | 0 | 102 | 0 |
| C | 0 | 102 | 0 |
| D | 0 | 102 | 0 |
| Quadrant | Total seconds | Saturated seconds | Saturation percentage |
|---|---|---|---|
| A | 5095 | 204 | 4.003925% |
| B | 5095 | 74 | 1.452404% |
| C | 5095 | 41 | 0.804711% |
| D | 5095 | 358 | 7.026497% |
Noise dominated data is calculated using 1-second bins in cleaned event files. If a bin has >2000 counts, and if more than 50% of those come from <1% of pixels, then it is considered to be noise-dominated and hence unusable.
| Quadrant | # 1 sec bins | Bins with >0 counts | Bins with >2000 counts | High rate bins dominated by noise | Noise dominated (total time) | Noise dominated (detector-on time) | Marked lightcurve |
|---|---|---|---|---|---|---|---|
| A | 7068 | 5096 | 159 | 159 | 2.25% | 3.12% |  |
| B | 7068 | 5096 | 44 | 44 | 0.62% | 0.86% | 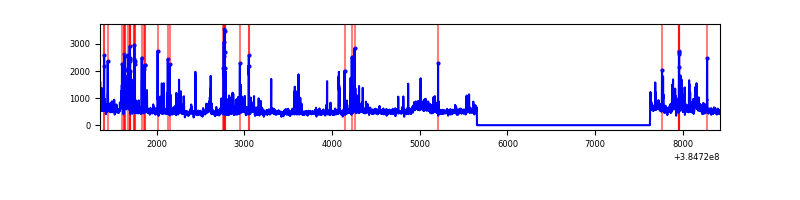 |
| C | 7068 | 5096 | 32 | 32 | 0.45% | 0.63% | 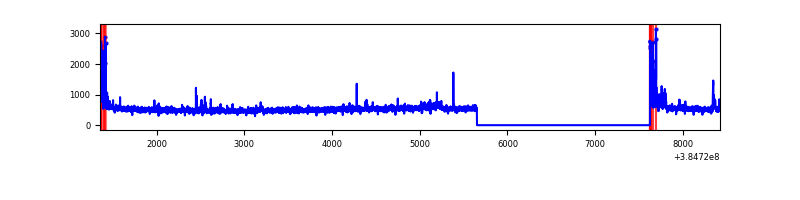 |
| D | 7068 | 5096 | 359 | 359 | 5.08% | 7.04% | 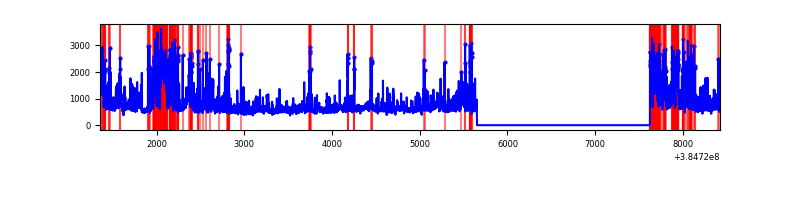 |
Top three noisy pixels from each quadrant. If the there are fewer than three noisy pixels in the level2.evt file, extra rows are filled as -1
| Pixel properties | Quadrant properties | ||||||
|---|---|---|---|---|---|---|---|
| Quadrant | DetID | PixID | Counts | Sigma | Mean | Median | Sigma |
| A | 15 | 237 | 595549 | 4907.99 | 608 | 598 | 121.2 |
| A | 10 | 83 | 55218 | 450.58 | 608 | 598 | 121.2 |
| A | 13 | 6 | 16405 | 130.4 | 608 | 598 | 121.2 |
| B | 5 | 172 | 210736 | 1844.11 | 619 | 605 | 113.9 |
| B | 0 | 190 | 122886 | 1073.14 | 619 | 605 | 113.9 |
| B | 15 | 85 | 90946 | 792.83 | 619 | 605 | 113.9 |
| C | 15 | 214 | 231953 | 1695.27 | 594 | 600 | 136.5 |
| C | 0 | 10 | 122262 | 891.49 | 594 | 600 | 136.5 |
| C | 0 | 207 | 70721 | 513.82 | 594 | 600 | 136.5 |
| D | 8 | 195 | 754883 | 4873.16 | 572 | 563 | 154.8 |
| D | 10 | 118 | 462160 | 2982.07 | 572 | 563 | 154.8 |
| D | 2 | 31 | 306877 | 1978.89 | 572 | 563 | 154.8 |
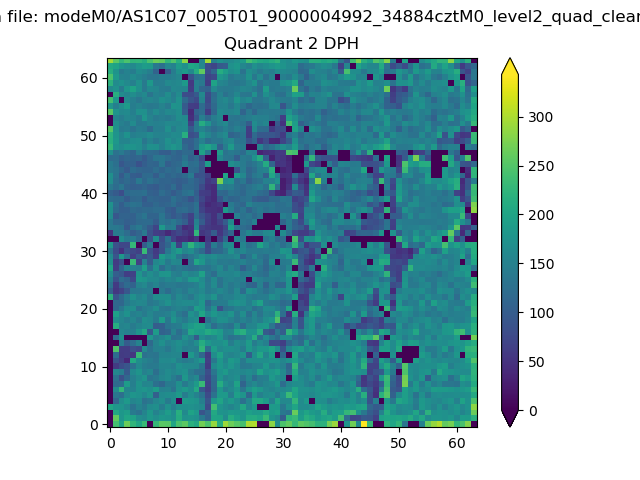
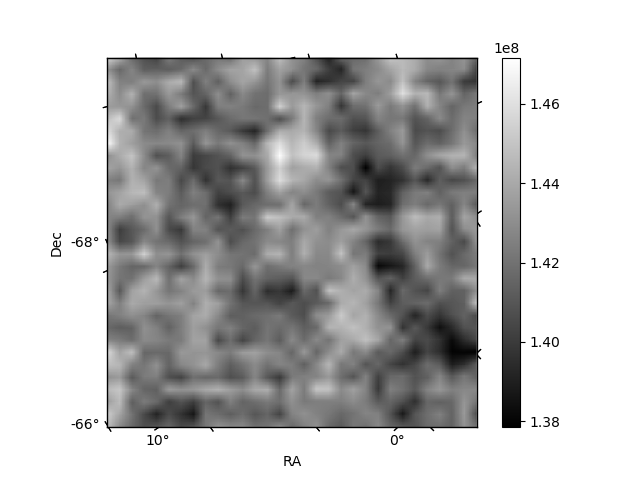
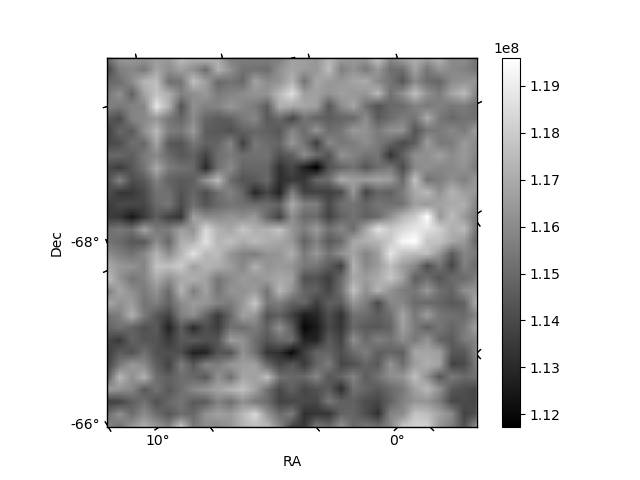
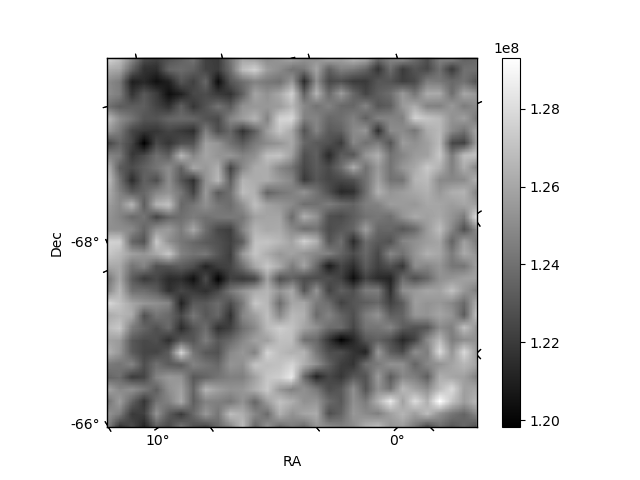
Histogram calculated using DETX and DETY for each event in the final _common_clean file
| Quadrant A | 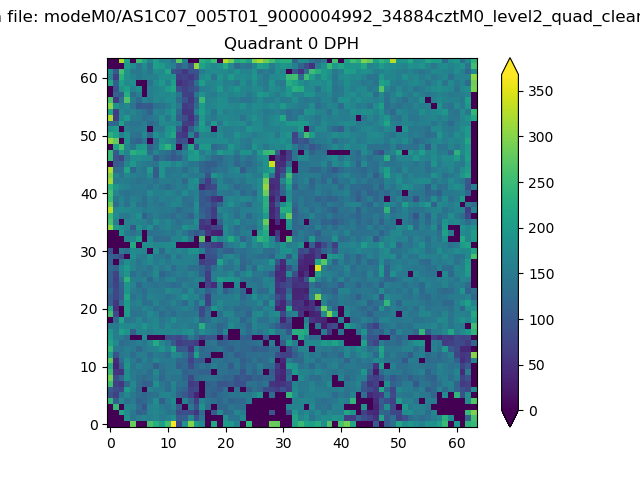 |
 |
Quadrant B |
|---|---|---|---|
| Quadrant D | 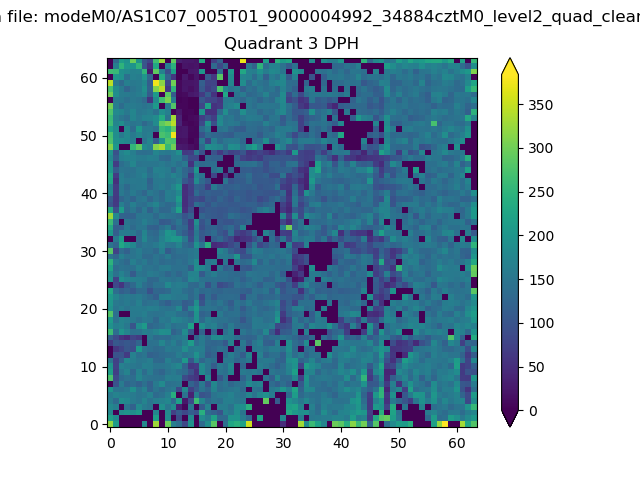 |
 |
Quadrant C |
| Plot type | Count rate plots | Images |
|---|---|---|
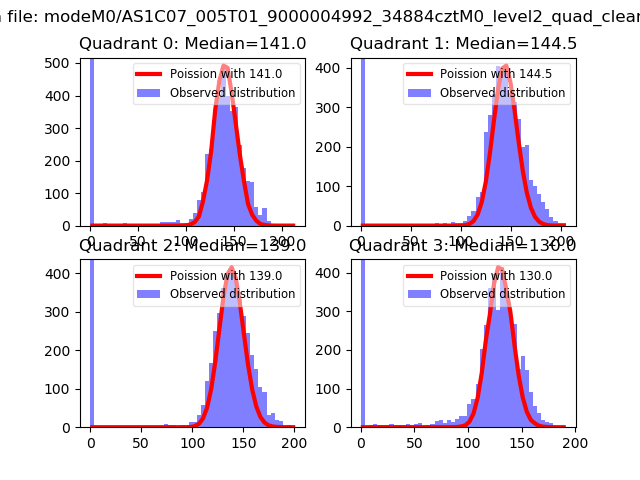
| Comparison with Poisson distribution Blue bars denote a histogram of data divided into 1 sec bins. Red curve is a Poisson curve with rate = median count rate of data. |
 |
 |
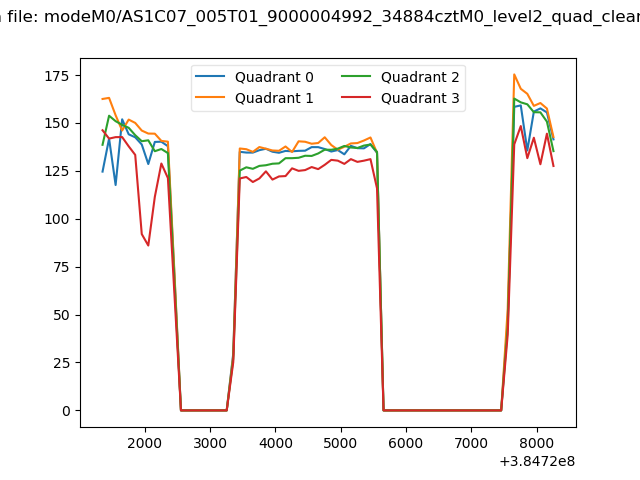
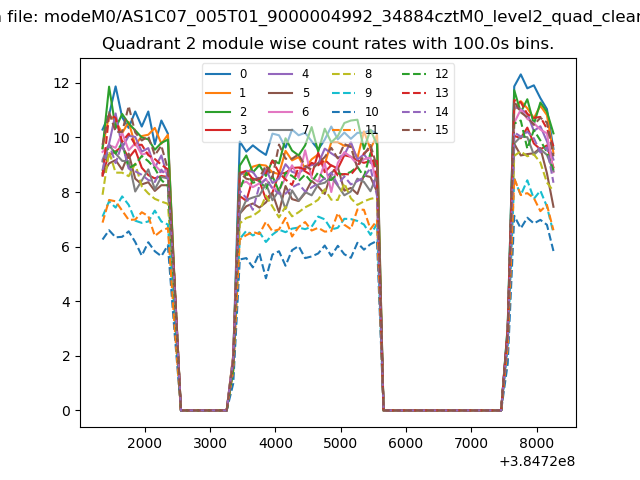
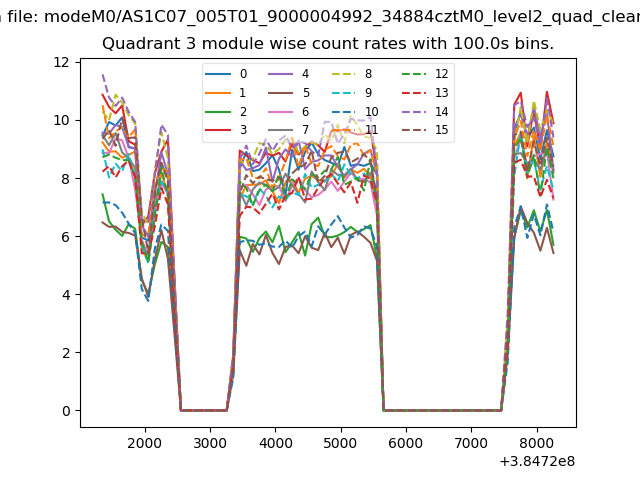
| Quadrant-wise count rates Data is divided into 100 sec bins |
 |
|
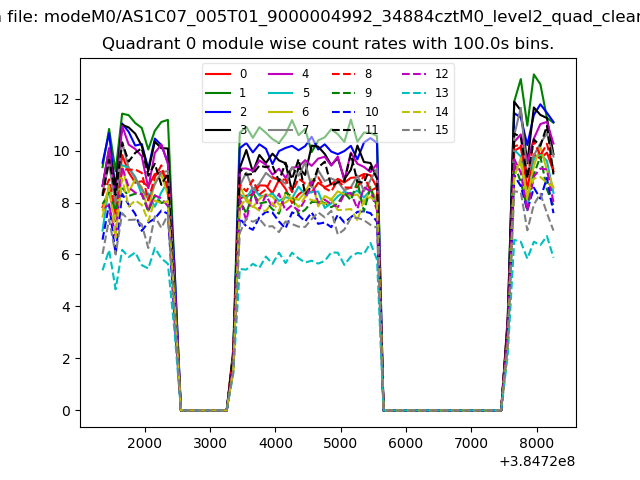
| Module-wise count rates for Quadrant A Data is divided into 100 sec bins |
 |
 |
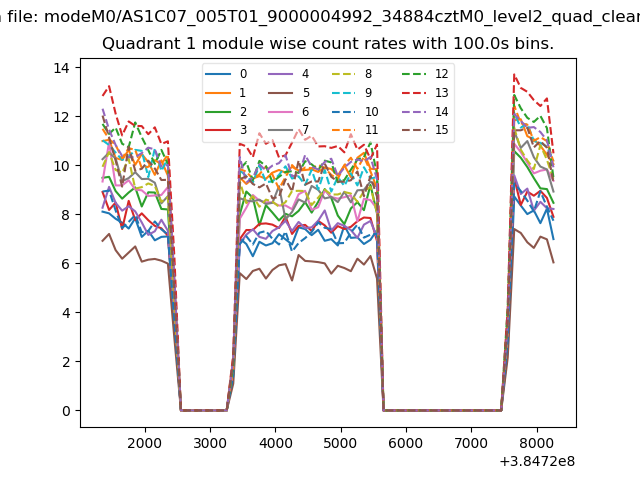
| Module-wise count rates for Quadrant B Data is divided into 100 sec bins |
 |
 |
| Module-wise count rates for Quadrant C Data is divided into 100 sec bins |
 |
 |
| Module-wise count rates for Quadrant D Data is divided into 100 sec bins |
 |
 |
| Parameter | Plot |
|---|---|
| CZT HV Monitor | 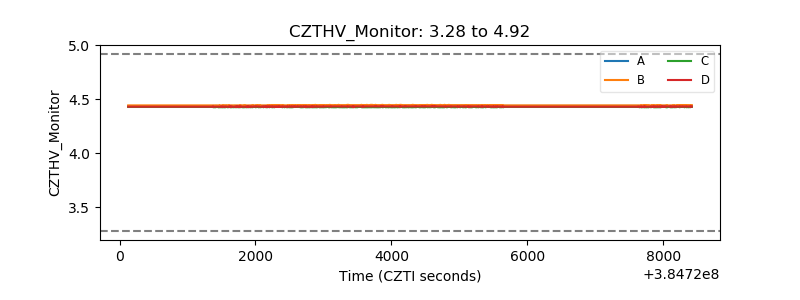 |
| D_VDD | 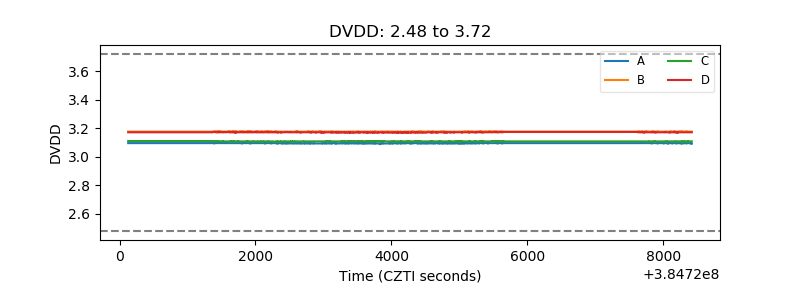 |
| Temperature 1 | 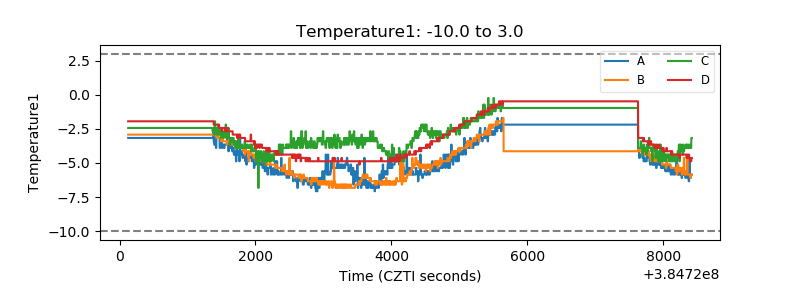 |
| Veto HV Monitor | 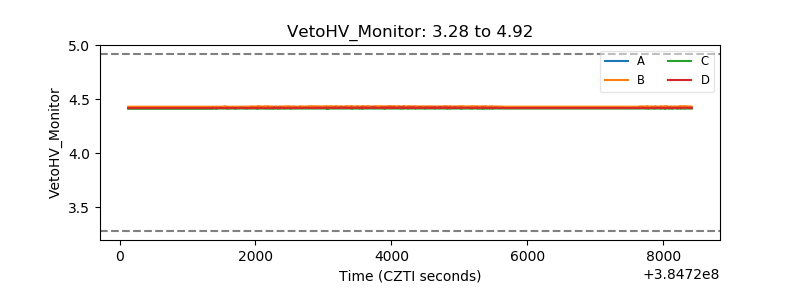 |
| Veto LLD | 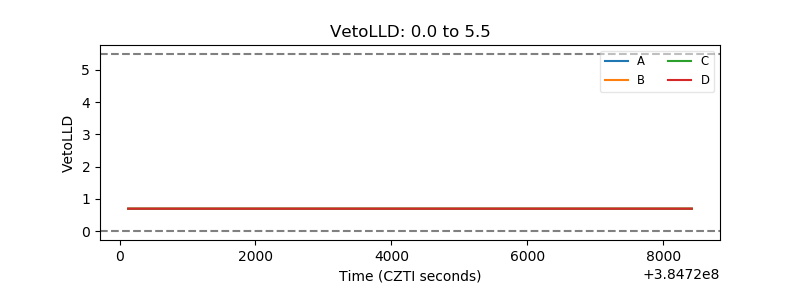 |
| Alpha Counter | 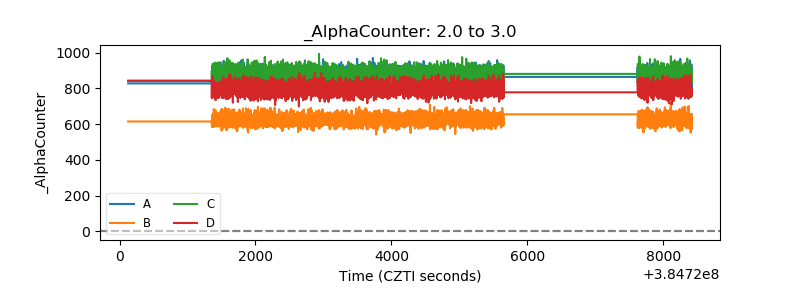 |
| _CPM_Rate | 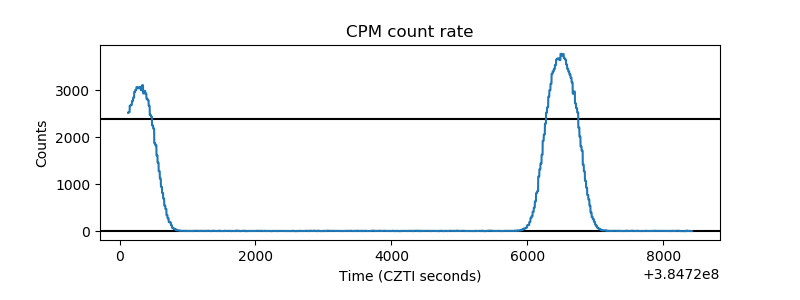 |
| CZT Counter | 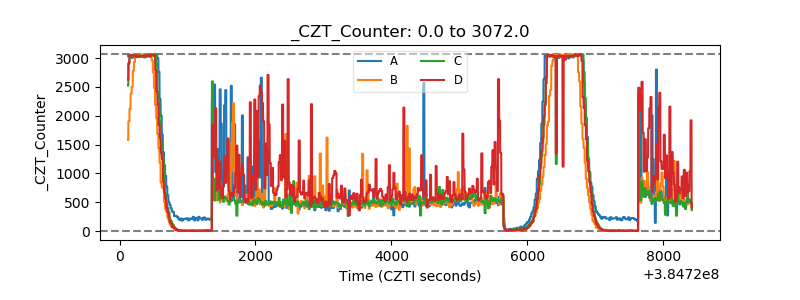 |
| +2.5 Volts monitor | 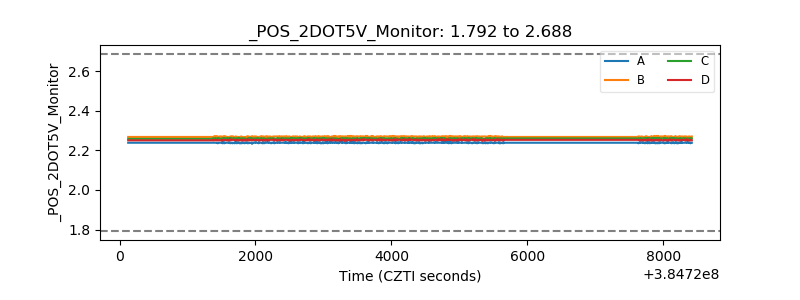 |
| +5 Volts monitor | 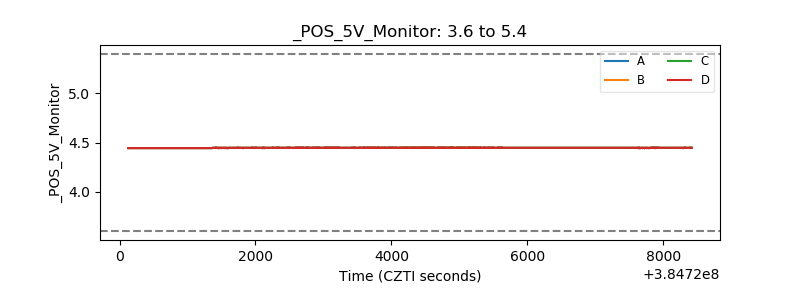 |
| _ROLL_ROT | 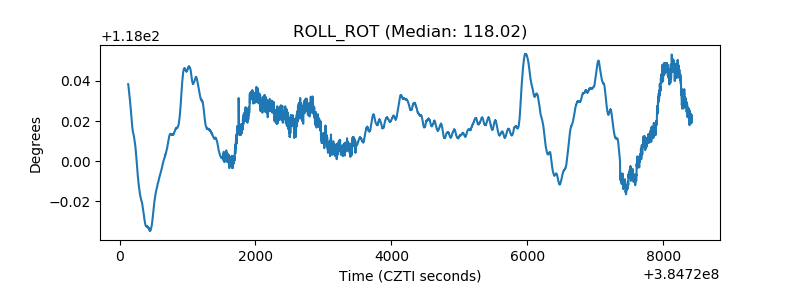 |
| _Roll_DEC | 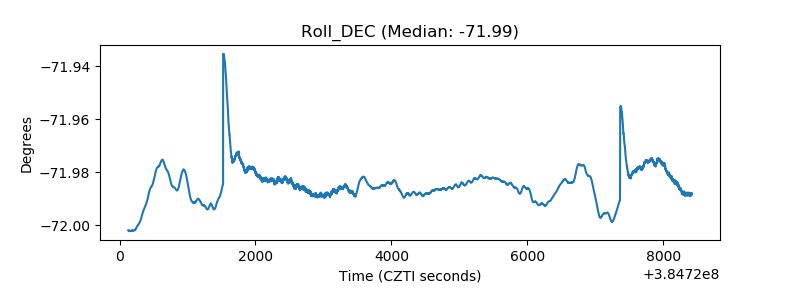 |
| _Roll_RA | 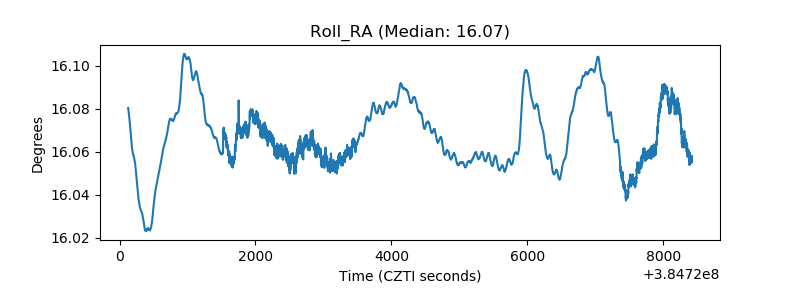 |
| Veto Counter | 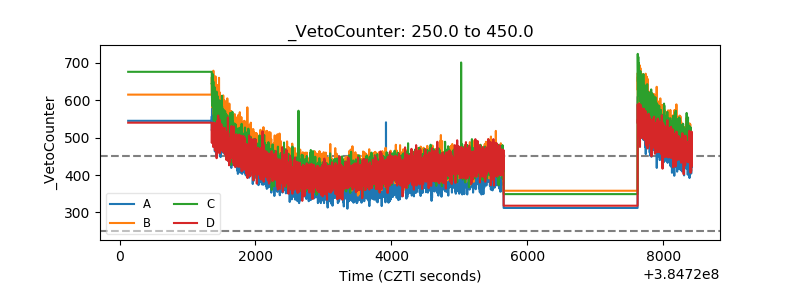 |