| Param | Original file | Final file |
|---|---|---|
| Filename | modeM0/AS1C07_005T01_9000004992_34881cztM0_level2.evt | modeM0/AS1C07_005T01_9000004992_34881cztM0_level2_quad_clean.evt |
| Size (bytes) | 494,824,320 | 86,057,280 |
| Size | 471.9 MB | 82.1 MB |
| Events in quadrant A | 2,905,032 | 570,703 |
| Events in quadrant B | 3,625,924 | 571,985 |
| Events in quadrant C | 3,129,849 | 561,795 |
| Events in quadrant D | 4,959,606 | 524,017 |
| Mode M9 | |||
|---|---|---|---|
| Quadrant | BADHDUFLAG | Total packets | Discarded packets |
| A | 0 | 20 | 0 |
| B | 0 | 20 | 0 |
| C | 0 | 20 | 0 |
| D | 0 | 21 | 0 |
| Mode M0 | |||
|---|---|---|---|
| Quadrant | BADHDUFLAG | Total packets | Discarded packets |
| A | 0 | 12264 | 3 |
| B | 0 | 14318 | 2 |
| C | 0 | 12661 | 2 |
| D | 0 | 18515 | 2 |
| Mode SS | |||
|---|---|---|---|
| Quadrant | BADHDUFLAG | Total packets | Discarded packets |
| A | 0 | 110 | 0 |
| B | 0 | 110 | 0 |
| C | 0 | 110 | 0 |
| D | 0 | 110 | 0 |
| Quadrant | Total seconds | Saturated seconds | Saturation percentage |
|---|---|---|---|
| A | 5389 | 141 | 2.616441% |
| B | 5389 | 205 | 3.804045% |
| C | 5389 | 103 | 1.911301% |
| D | 5389 | 317 | 5.882353% |
Noise dominated data is calculated using 1-second bins in cleaned event files. If a bin has >2000 counts, and if more than 50% of those come from <1% of pixels, then it is considered to be noise-dominated and hence unusable.
| Quadrant | # 1 sec bins | Bins with >0 counts | Bins with >2000 counts | High rate bins dominated by noise | Noise dominated (total time) | Noise dominated (detector-on time) | Marked lightcurve |
|---|---|---|---|---|---|---|---|
| A | 7092 | 5390 | 118 | 118 | 1.66% | 2.19% | 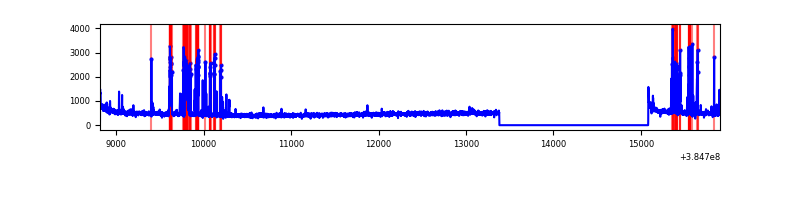 |
| B | 7092 | 5390 | 114 | 114 | 1.61% | 2.12% | 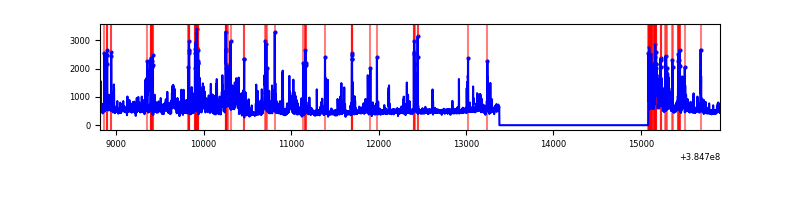 |
| C | 7092 | 5390 | 95 | 95 | 1.34% | 1.76% | 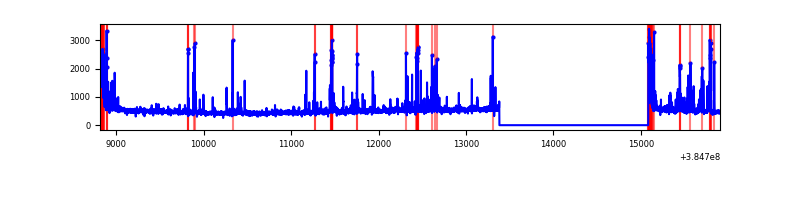 |
| D | 7092 | 5390 | 296 | 296 | 4.17% | 5.49% | 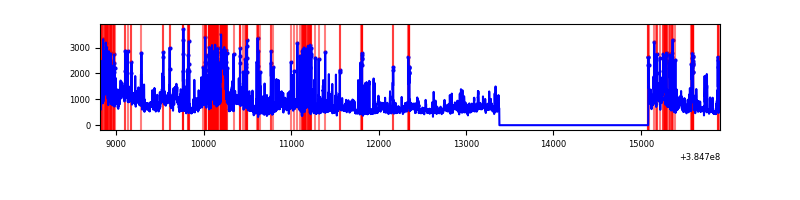 |
Top three noisy pixels from each quadrant. If the there are fewer than three noisy pixels in the level2.evt file, extra rows are filled as -1
| Pixel properties | Quadrant properties | ||||||
|---|---|---|---|---|---|---|---|
| Quadrant | DetID | PixID | Counts | Sigma | Mean | Median | Sigma |
| A | 15 | 237 | 436801 | 3496.62 | 616 | 603 | 124.7 |
| A | 10 | 83 | 63151 | 501.39 | 616 | 603 | 124.7 |
| A | 13 | 6 | 17650 | 136.65 | 616 | 603 | 124.7 |
| B | 5 | 172 | 311056 | 2681.84 | 611 | 596 | 115.8 |
| B | 5 | 31 | 239189 | 2061.04 | 611 | 596 | 115.8 |
| B | 0 | 190 | 224363 | 1932.96 | 611 | 596 | 115.8 |
| C | 0 | 207 | 373795 | 2702.15 | 594 | 598 | 138.1 |
| C | 15 | 214 | 245406 | 1772.55 | 594 | 598 | 138.1 |
| C | 0 | 10 | 154824 | 1116.68 | 594 | 598 | 138.1 |
| D | 8 | 195 | 1150132 | 7933.87 | 584 | 565 | 144.9 |
| D | 10 | 118 | 337807 | 2327.52 | 584 | 565 | 144.9 |
| D | 2 | 31 | 292051 | 2011.73 | 584 | 565 | 144.9 |
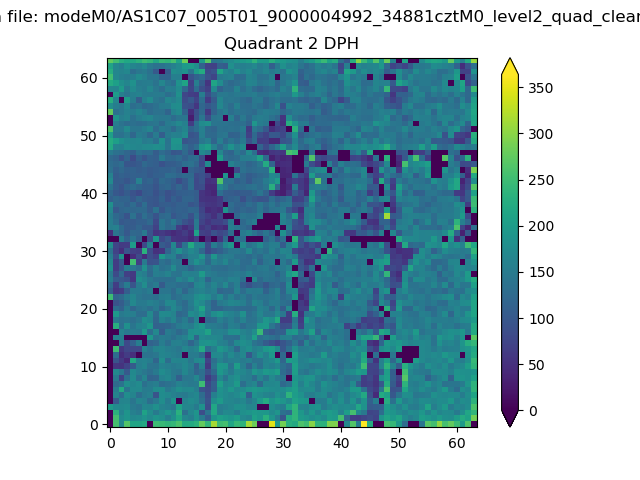
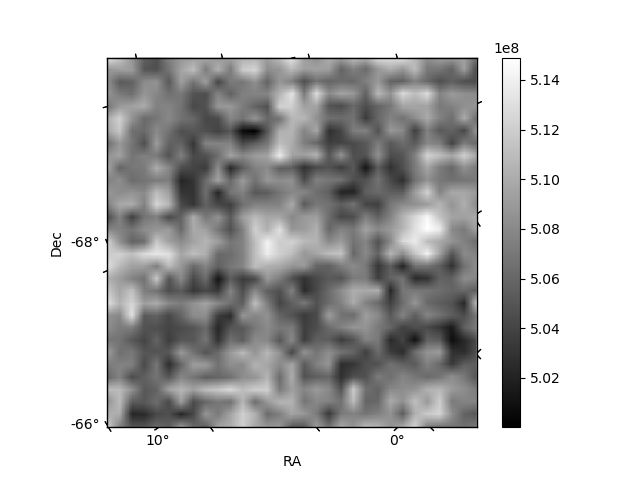
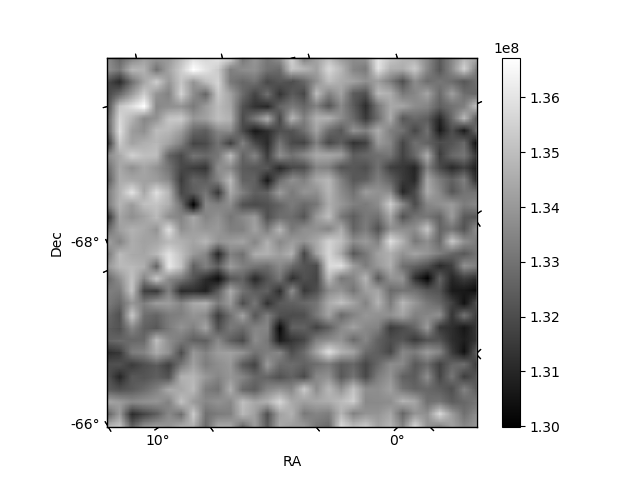
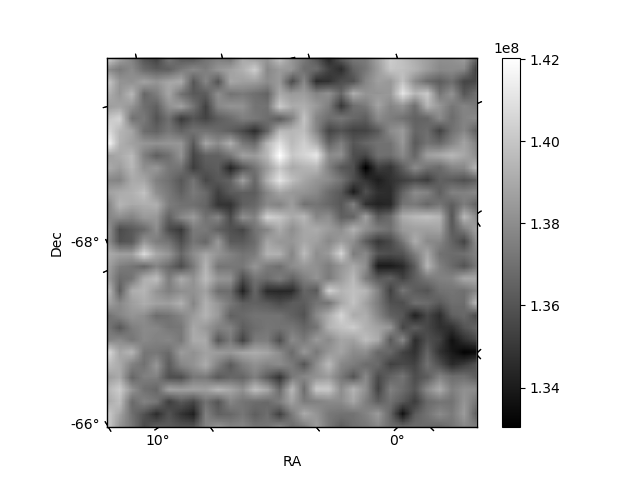
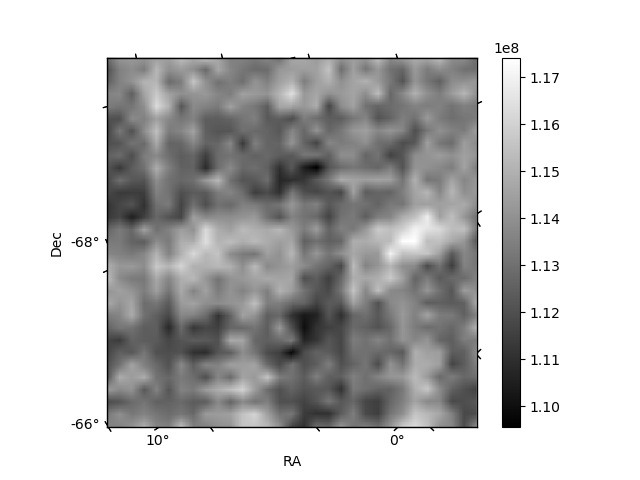
Histogram calculated using DETX and DETY for each event in the final _common_clean file
| Quadrant A | 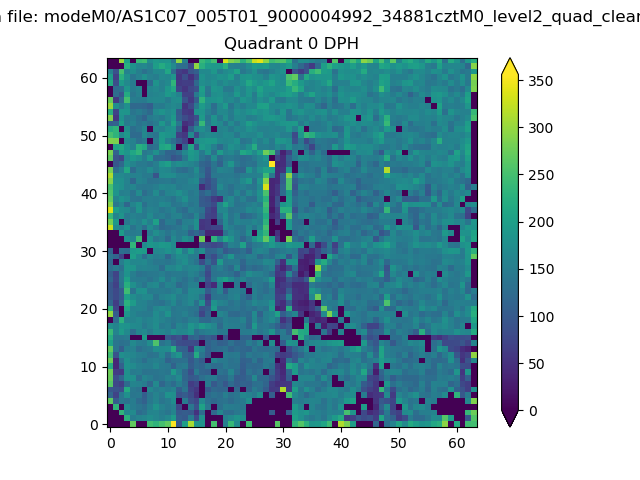 |
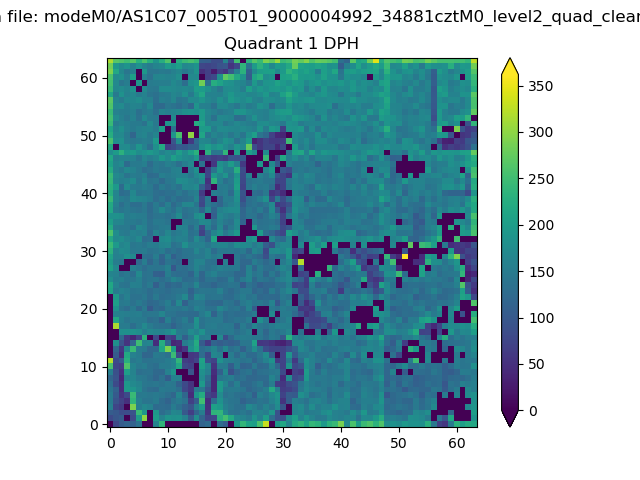 |
Quadrant B |
|---|---|---|---|
| Quadrant D | 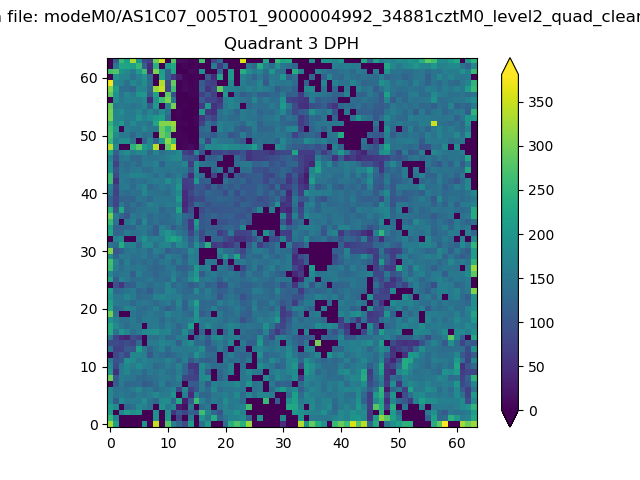 |
 |
Quadrant C |
| Plot type | Count rate plots | Images |
|---|---|---|
| Comparison with Poisson distribution Blue bars denote a histogram of data divided into 1 sec bins. Red curve is a Poisson curve with rate = median count rate of data. |
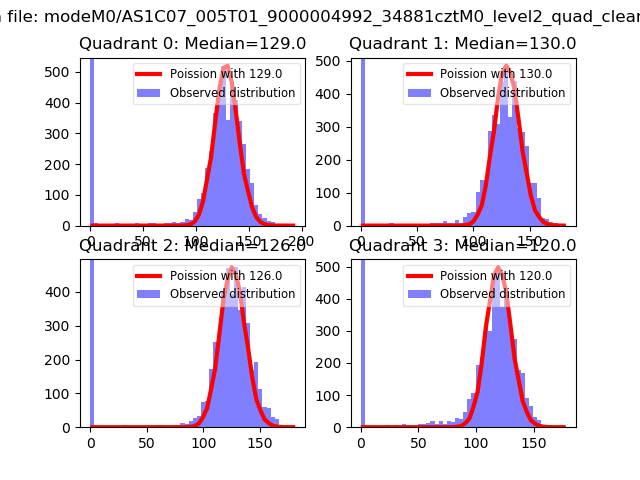 |
 |
| Quadrant-wise count rates Data is divided into 100 sec bins |
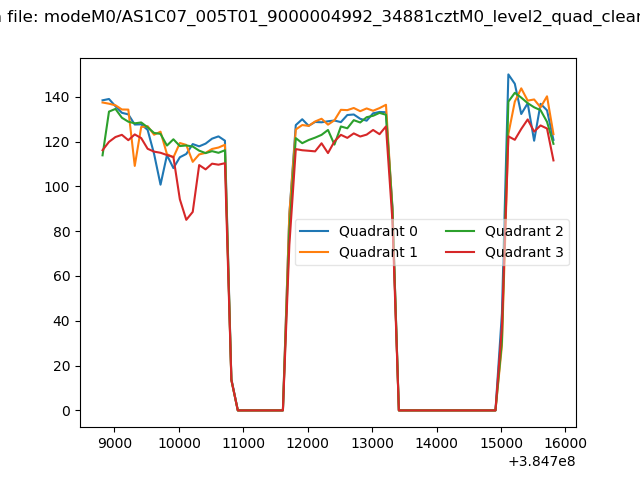 |
|
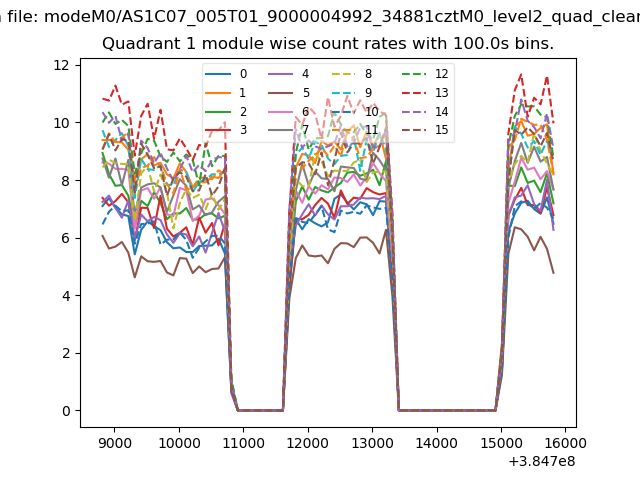
| Module-wise count rates for Quadrant A Data is divided into 100 sec bins |
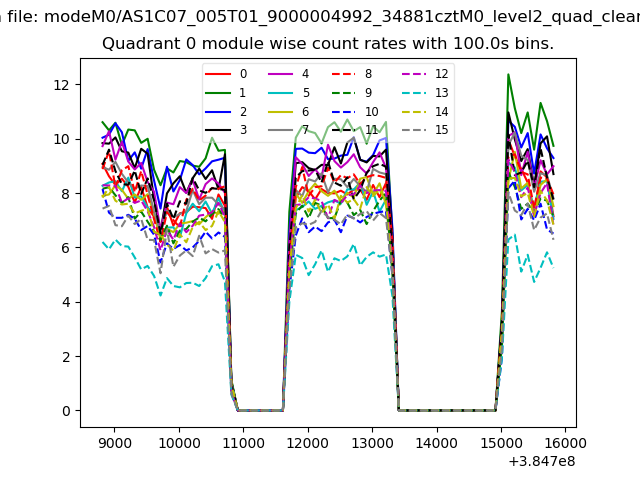 |
 |
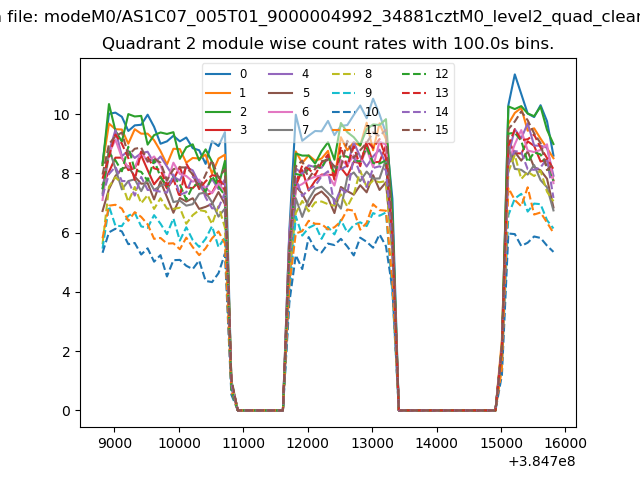
| Module-wise count rates for Quadrant B Data is divided into 100 sec bins |
 |
 |
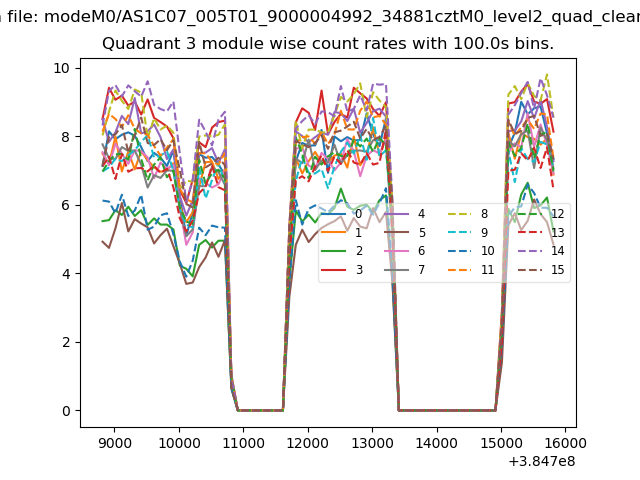
| Module-wise count rates for Quadrant C Data is divided into 100 sec bins |
 |
 |
| Module-wise count rates for Quadrant D Data is divided into 100 sec bins |
 |
 |
| Parameter | Plot |
|---|---|
| CZT HV Monitor |  |
| D_VDD | 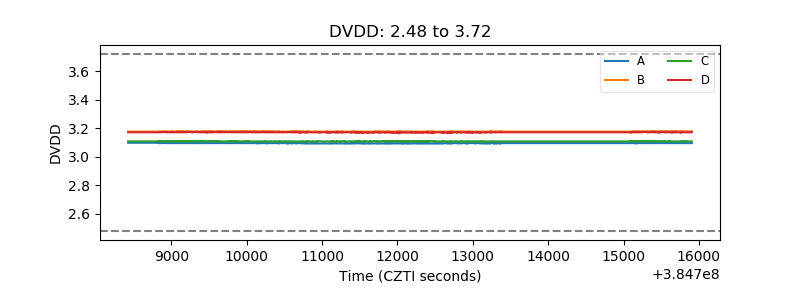 |
| Temperature 1 | 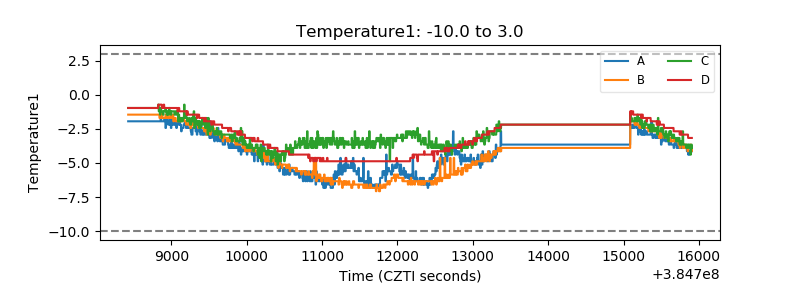 |
| Veto HV Monitor | 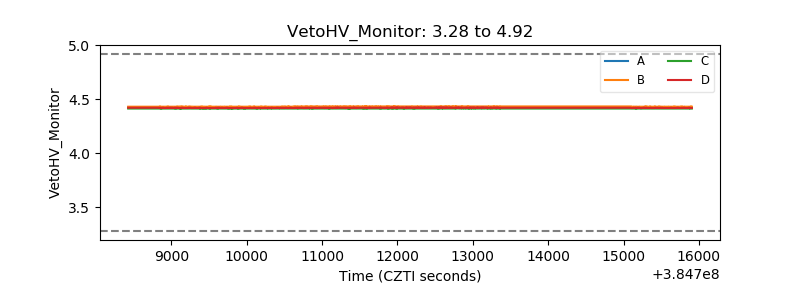 |
| Veto LLD | 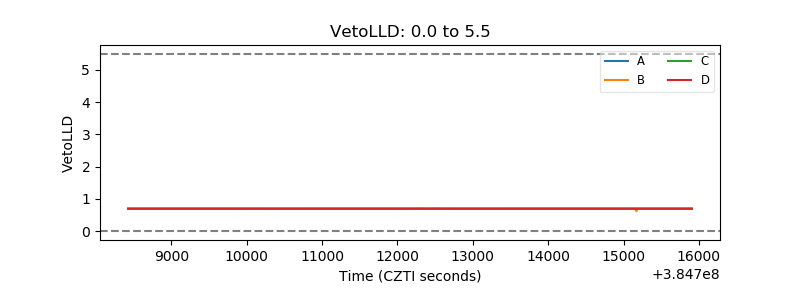 |
| Alpha Counter | 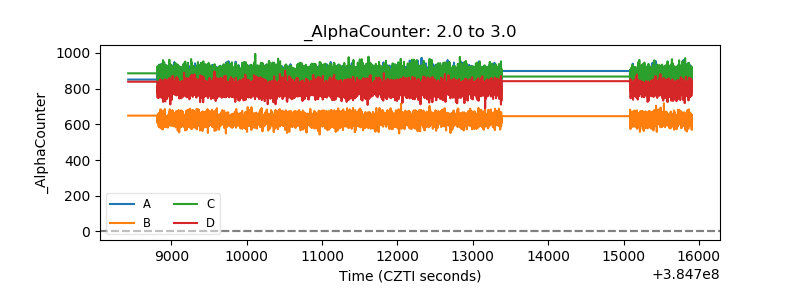 |
| _CPM_Rate | 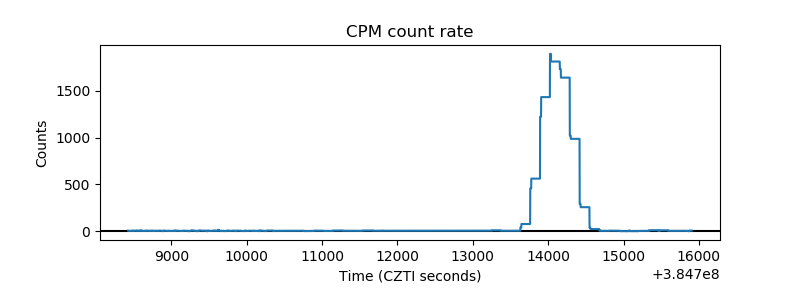 |
| CZT Counter | 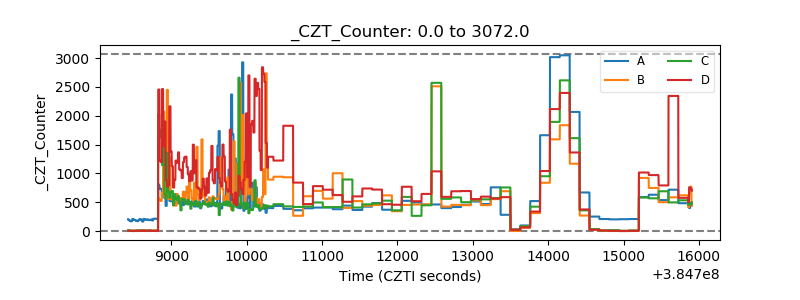 |
| +2.5 Volts monitor | 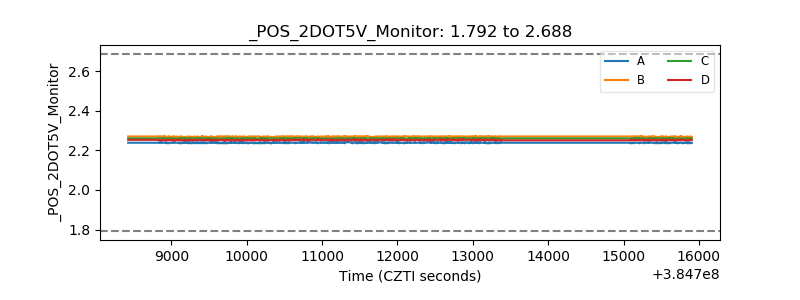 |
| +5 Volts monitor | 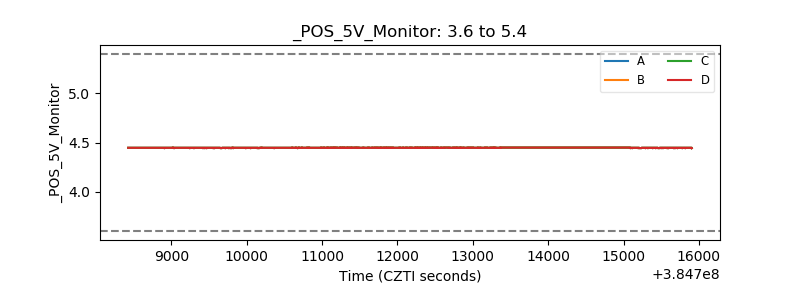 |
| _ROLL_ROT | 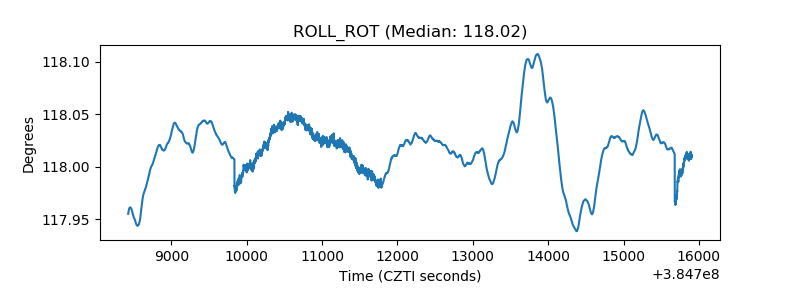 |
| _Roll_DEC | 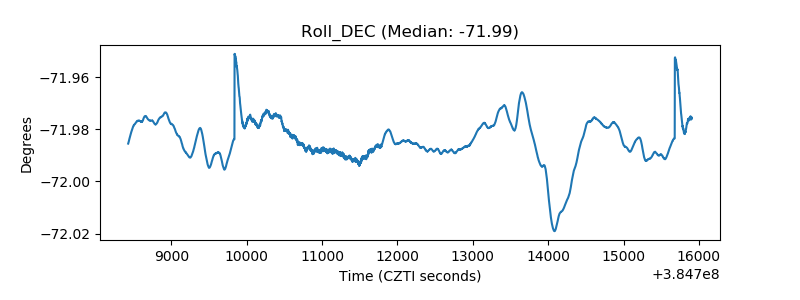 |
| _Roll_RA | 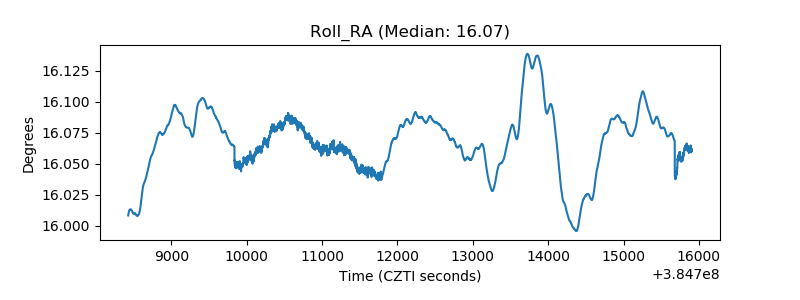 |
| Veto Counter | 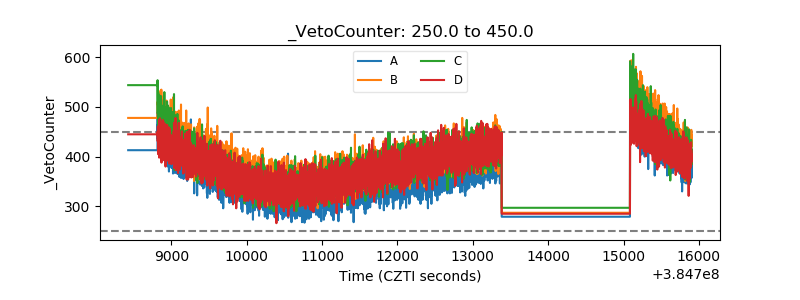 |