| Param | Original file | Final file |
|---|---|---|
| Filename | modeM0/AS1C07_005T01_9000004992_34874cztM0_level2.evt | modeM0/AS1C07_005T01_9000004992_34874cztM0_level2_quad_clean.evt |
| Size (bytes) | 444,565,440 | 102,700,800 |
| Size | 424.0 MB | 97.9 MB |
| Events in quadrant A | 2,886,036 | 692,296 |
| Events in quadrant B | 3,120,025 | 701,424 |
| Events in quadrant C | 2,956,812 | 693,504 |
| Events in quadrant D | 4,133,610 | 644,581 |
| Mode M9 | |||
|---|---|---|---|
| Quadrant | BADHDUFLAG | Total packets | Discarded packets |
| A | 0 | 20 | 0 |
| B | 0 | 20 | 0 |
| C | 0 | 20 | 0 |
| D | 0 | 21 | 0 |
| Mode M0 | |||
|---|---|---|---|
| Quadrant | BADHDUFLAG | Total packets | Discarded packets |
| A | 0 | 12035 | 3 |
| B | 0 | 12753 | 2 |
| C | 0 | 11841 | 2 |
| D | 0 | 15903 | 2 |
| Mode SS | |||
|---|---|---|---|
| Quadrant | BADHDUFLAG | Total packets | Discarded packets |
| A | 0 | 108 | 0 |
| B | 0 | 108 | 0 |
| C | 0 | 108 | 0 |
| D | 0 | 108 | 0 |
| Quadrant | Total seconds | Saturated seconds | Saturation percentage |
|---|---|---|---|
| A | 5417 | 99 | 1.827580% |
| B | 5417 | 121 | 2.233709% |
| C | 5417 | 58 | 1.070703% |
| D | 5417 | 157 | 2.898283% |
Noise dominated data is calculated using 1-second bins in cleaned event files. If a bin has >2000 counts, and if more than 50% of those come from <1% of pixels, then it is considered to be noise-dominated and hence unusable.
| Quadrant | # 1 sec bins | Bins with >0 counts | Bins with >2000 counts | High rate bins dominated by noise | Noise dominated (total time) | Noise dominated (detector-on time) | Marked lightcurve |
|---|---|---|---|---|---|---|---|
| A | 7241 | 5418 | 78 | 78 | 1.08% | 1.44% | 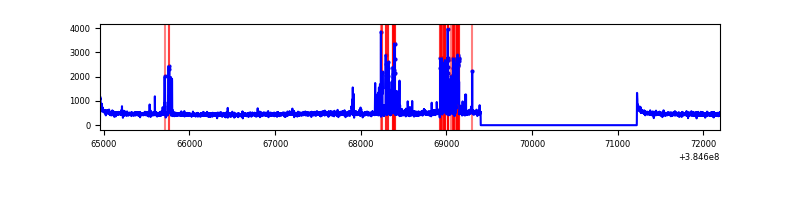 |
| B | 7241 | 5418 | 93 | 93 | 1.28% | 1.72% | 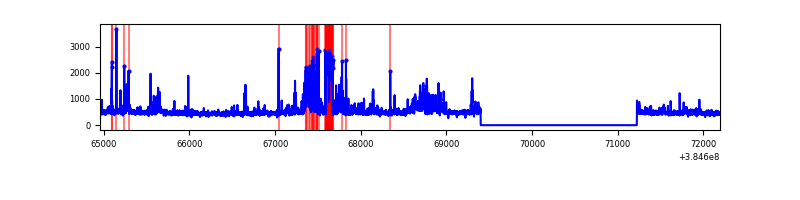 |
| C | 7241 | 5418 | 49 | 49 | 0.68% | 0.90% | 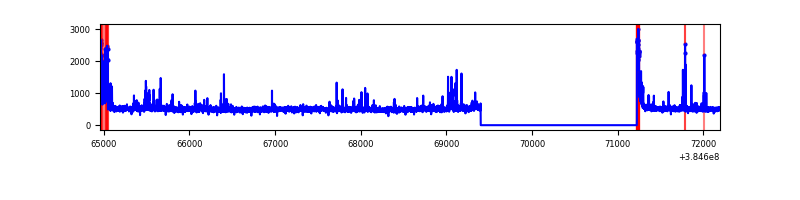 |
| D | 7241 | 5418 | 139 | 139 | 1.92% | 2.57% | 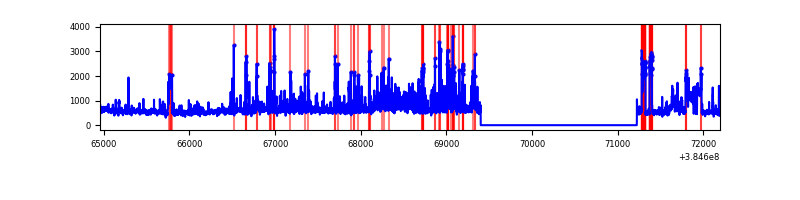 |
Top three noisy pixels from each quadrant. If the there are fewer than three noisy pixels in the level2.evt file, extra rows are filled as -1
| Pixel properties | Quadrant properties | ||||||
|---|---|---|---|---|---|---|---|
| Quadrant | DetID | PixID | Counts | Sigma | Mean | Median | Sigma |
| A | 15 | 237 | 321769 | 2587.12 | 625 | 612 | 124.1 |
| A | 15 | 169 | 76806 | 613.79 | 625 | 612 | 124.1 |
| A | 10 | 83 | 54053 | 430.5 | 625 | 612 | 124.1 |
| B | 5 | 172 | 400925 | 3436.08 | 619 | 602 | 116.5 |
| B | 5 | 31 | 90921 | 775.23 | 619 | 602 | 116.5 |
| B | 4 | 171 | 42861 | 362.72 | 619 | 602 | 116.5 |
| C | 15 | 214 | 237266 | 1679.9 | 613 | 618 | 140.9 |
| C | 0 | 10 | 164992 | 1166.85 | 613 | 618 | 140.9 |
| C | 0 | 207 | 129111 | 912.14 | 613 | 618 | 140.9 |
| D | 8 | 195 | 702189 | 4783.48 | 604 | 587 | 146.7 |
| D | 13 | 249 | 364464 | 2480.89 | 604 | 587 | 146.7 |
| D | 2 | 31 | 282735 | 1923.67 | 604 | 587 | 146.7 |
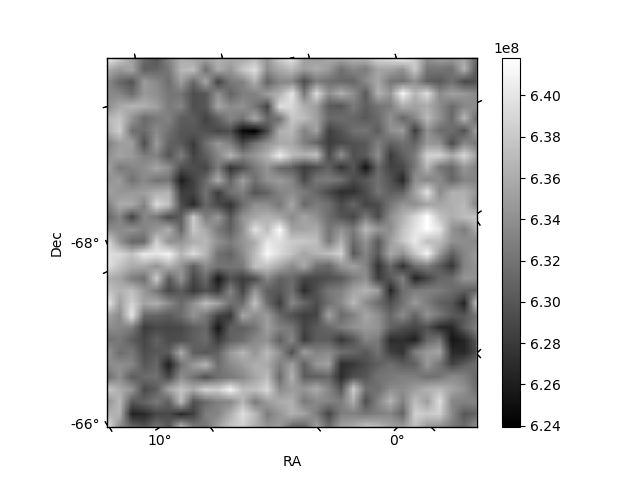
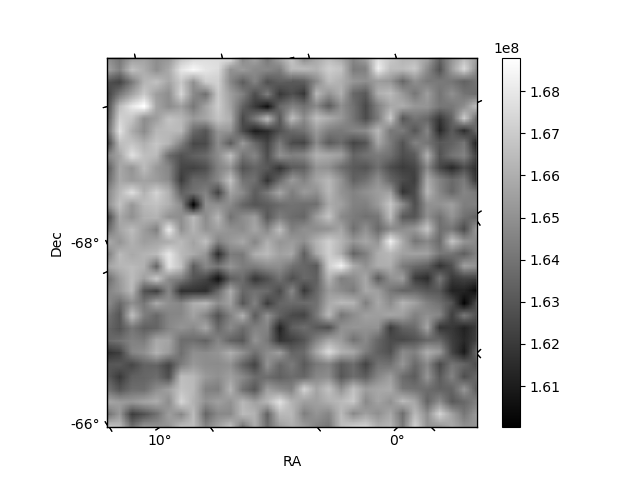
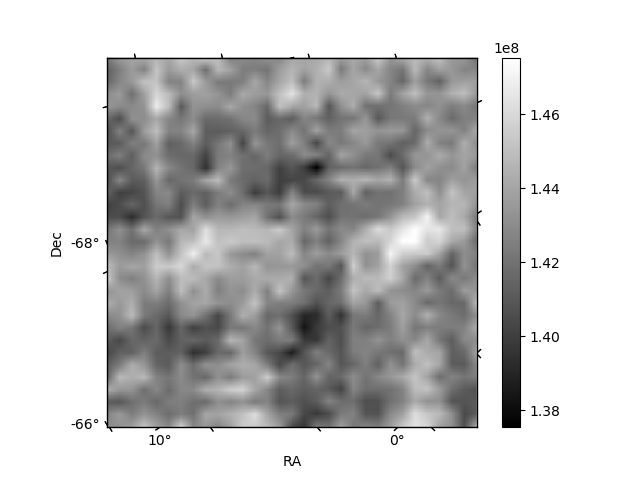
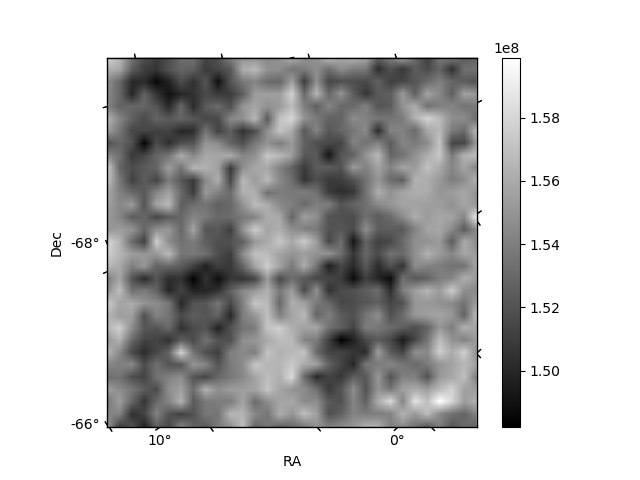
Histogram calculated using DETX and DETY for each event in the final _common_clean file
| Quadrant A | 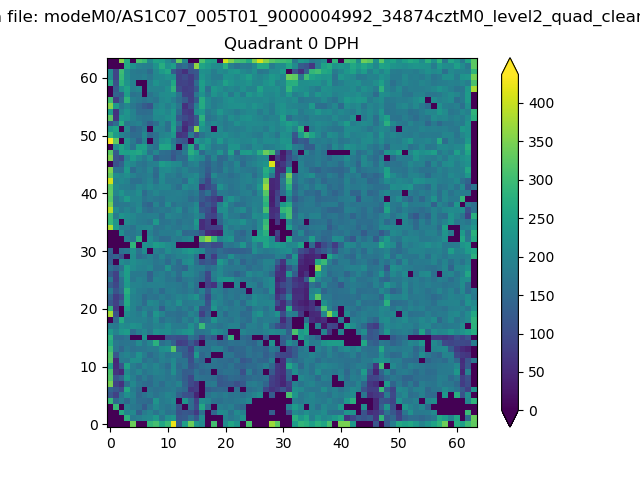 |
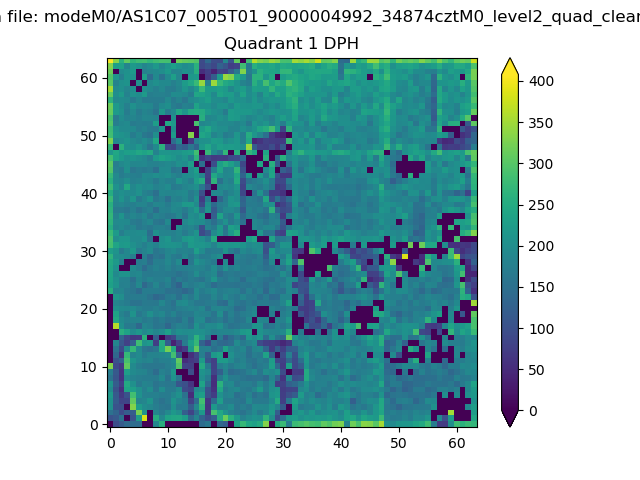 |
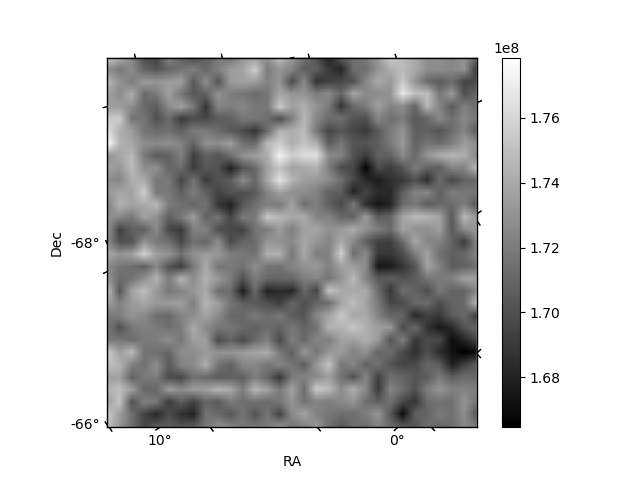
Quadrant B |
|---|---|---|---|
| Quadrant D | 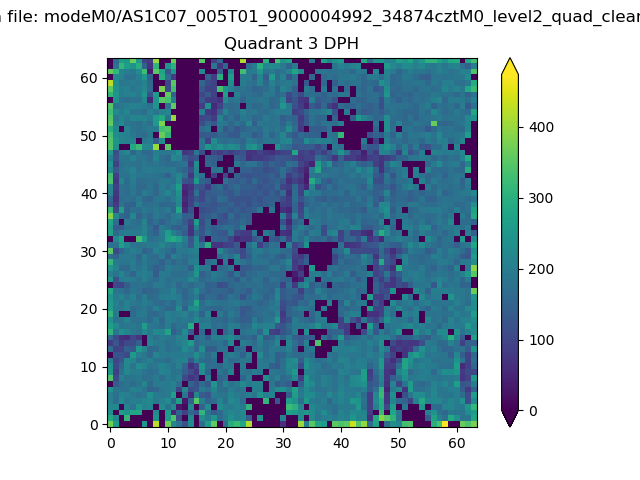 |
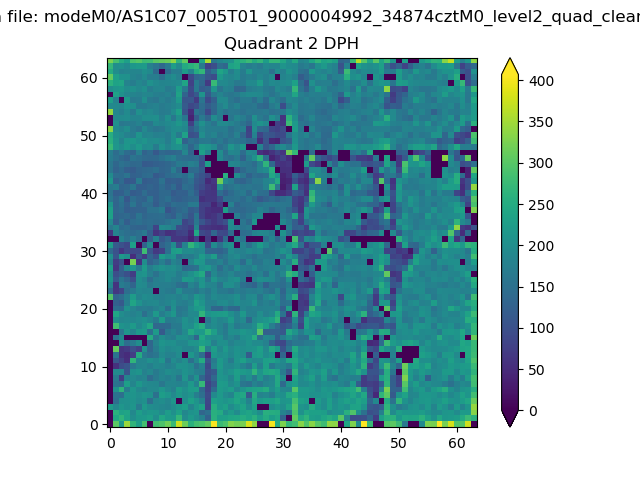 |
Quadrant C |
| Plot type | Count rate plots | Images |
|---|---|---|
| Comparison with Poisson distribution Blue bars denote a histogram of data divided into 1 sec bins. Red curve is a Poisson curve with rate = median count rate of data. |
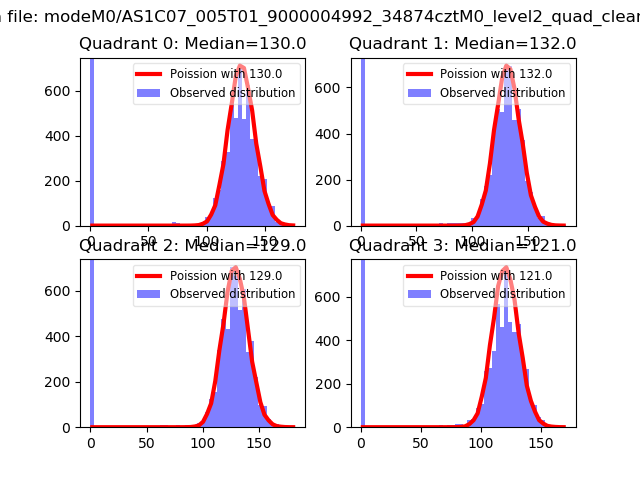 |
 |
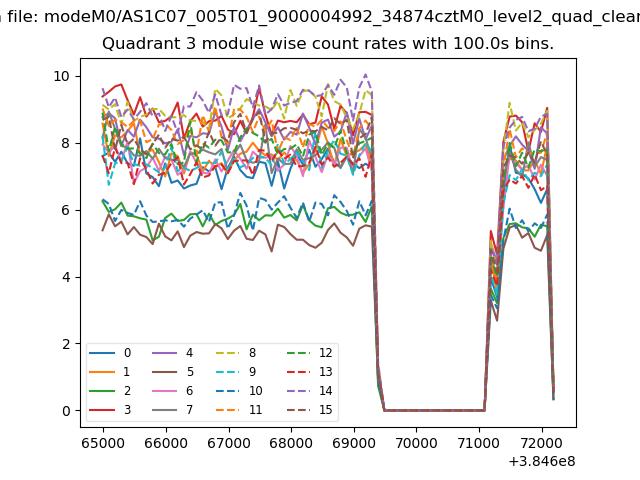
| Quadrant-wise count rates Data is divided into 100 sec bins |
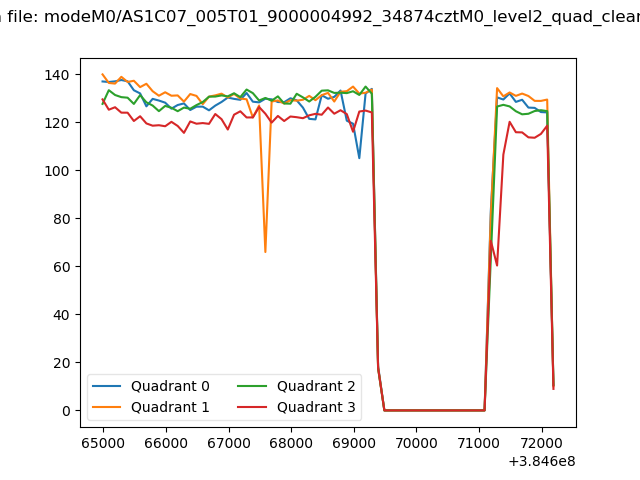 |
|
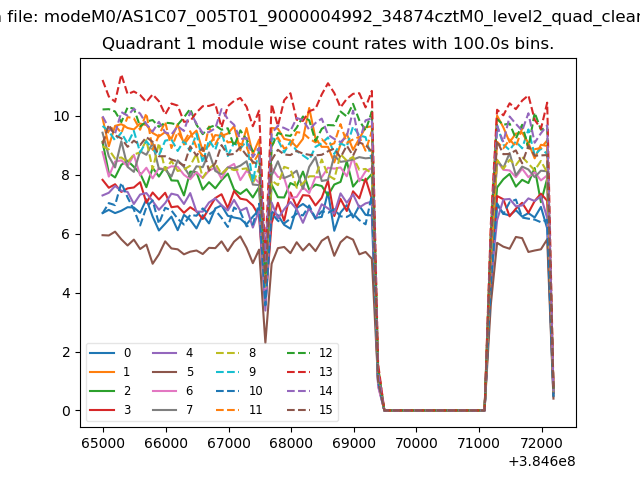
| Module-wise count rates for Quadrant A Data is divided into 100 sec bins |
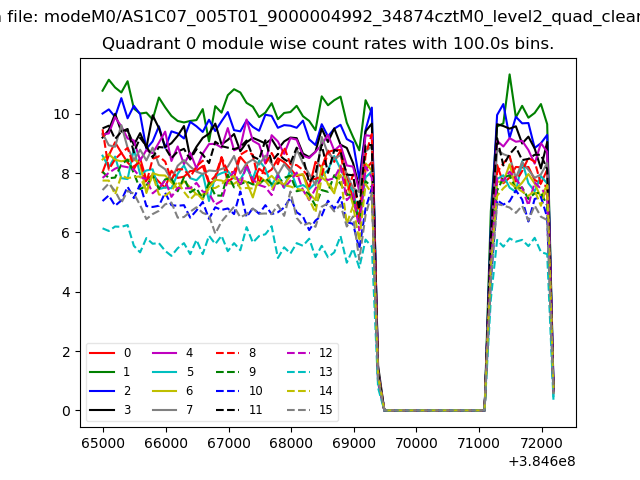 |
 |
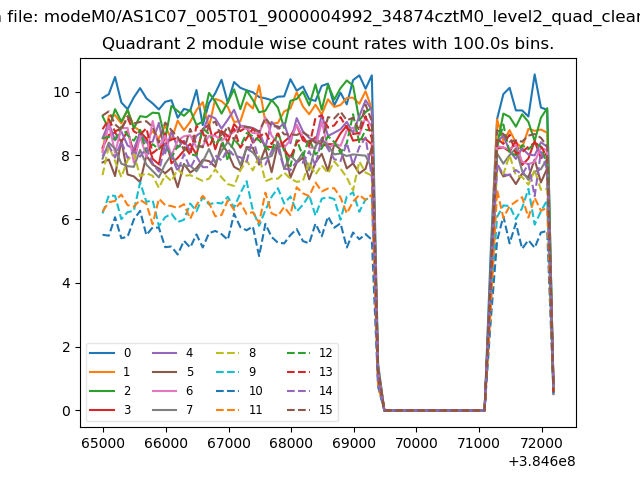
| Module-wise count rates for Quadrant B Data is divided into 100 sec bins |
 |
 |
| Module-wise count rates for Quadrant C Data is divided into 100 sec bins |
 |
 |
| Module-wise count rates for Quadrant D Data is divided into 100 sec bins |
 |
 |
| Parameter | Plot |
|---|---|
| CZT HV Monitor |  |
| D_VDD | 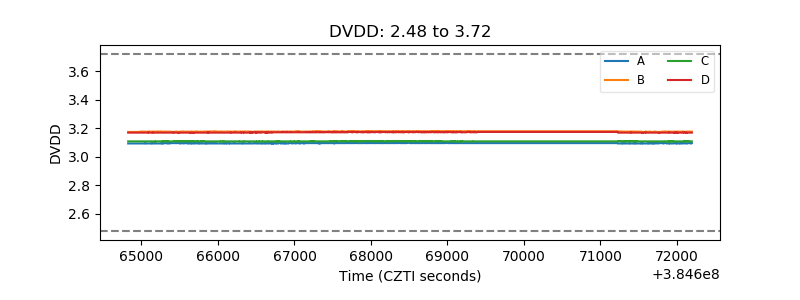 |
| Temperature 1 | 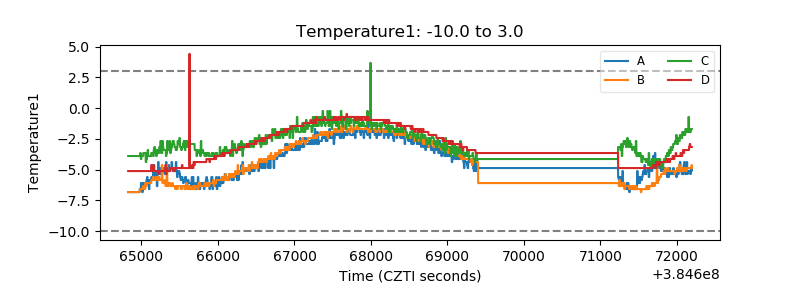 |
| Veto HV Monitor | 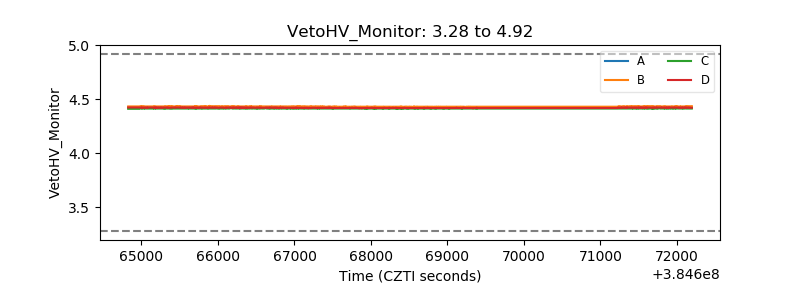 |
| Veto LLD | 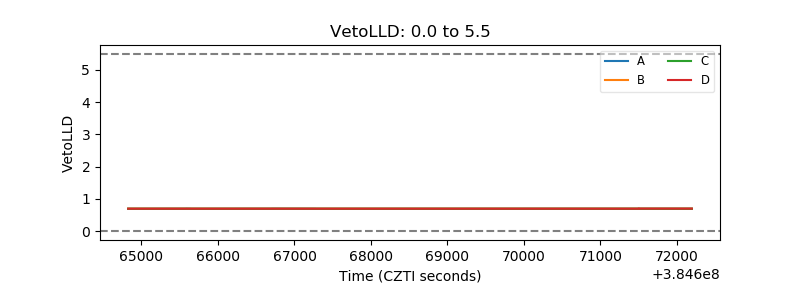 |
| Alpha Counter | 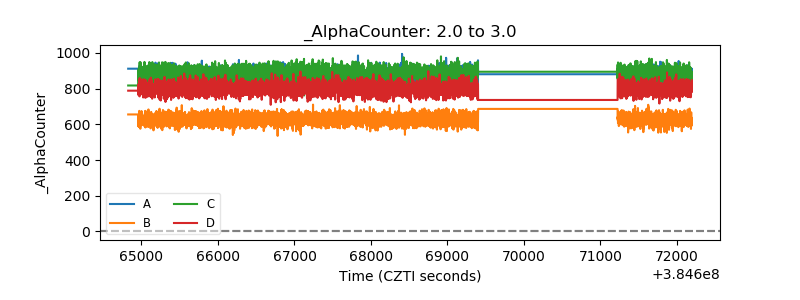 |
| _CPM_Rate | 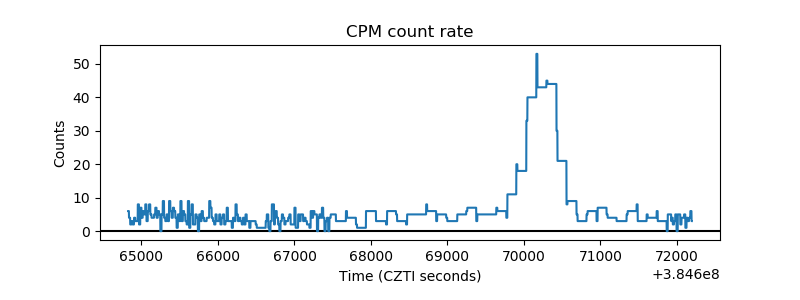 |
| CZT Counter | 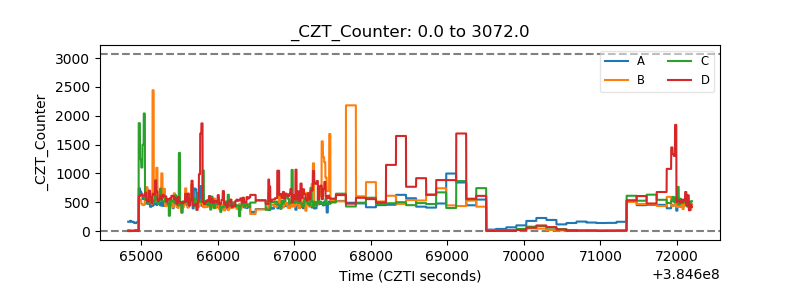 |
| +2.5 Volts monitor | 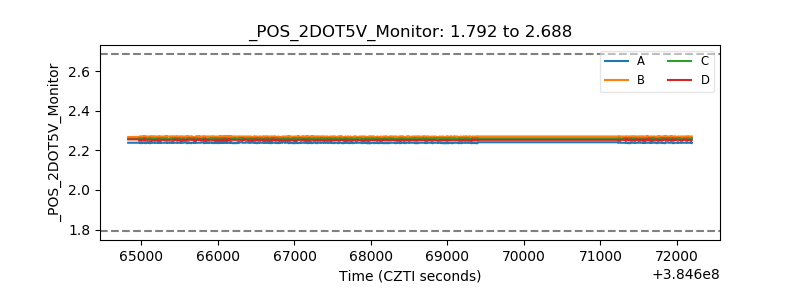 |
| +5 Volts monitor | 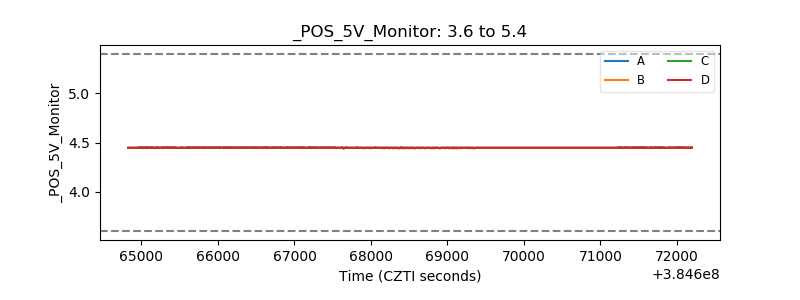 |
| _ROLL_ROT | 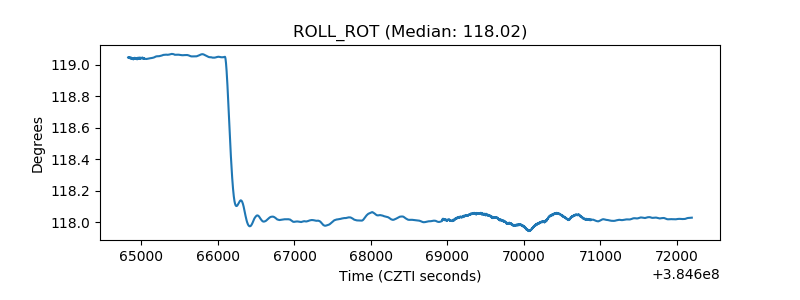 |
| _Roll_DEC | 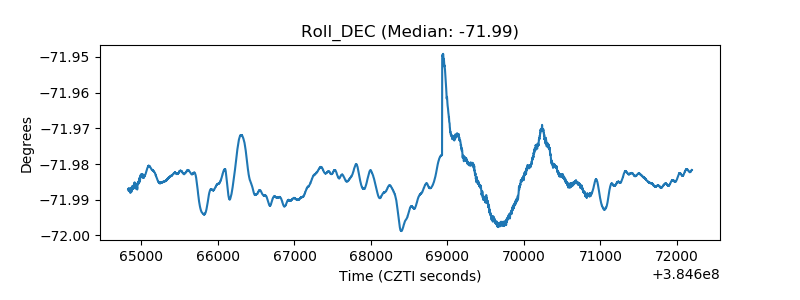 |
| _Roll_RA | 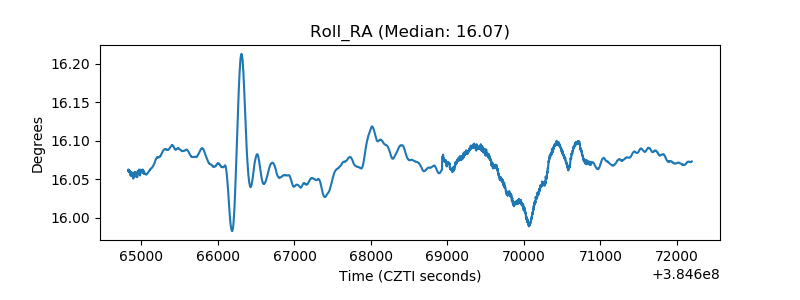 |
| Veto Counter | 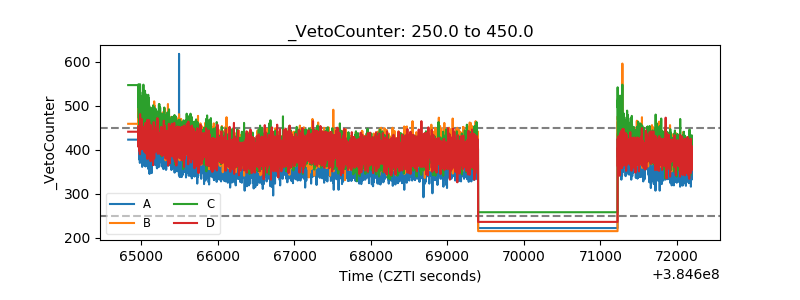 |