| Param | Original file | Final file |
|---|---|---|
| Filename | modeM0/AS1C07_005T01_9000004992_34873cztM0_level2.evt | modeM0/AS1C07_005T01_9000004992_34873cztM0_level2_quad_clean.evt |
| Size (bytes) | 2,356,724,160 | 432,918,720 |
| Size | 2.2 GB | 412.9 MB |
| Events in quadrant A | 16,383,187 | 2,858,250 |
| Events in quadrant B | 19,637,142 | 2,893,818 |
| Events in quadrant C | 14,007,012 | 2,885,930 |
| Events in quadrant D | 19,599,137 | 2,688,258 |
| Mode M9 | |||
|---|---|---|---|
| Quadrant | BADHDUFLAG | Total packets | Discarded packets |
| A | 0 | 121 | 0 |
| B | 0 | 121 | 0 |
| C | 0 | 121 | 0 |
| D | 0 | 121 | 0 |
| Mode M0 | |||
|---|---|---|---|
| Quadrant | BADHDUFLAG | Total packets | Discarded packets |
| A | 0 | 65159 | 7 |
| B | 0 | 74707 | 6 |
| C | 0 | 56052 | 6 |
| D | 0 | 75544 | 6 |
| Mode SS | |||
|---|---|---|---|
| Quadrant | BADHDUFLAG | Total packets | Discarded packets |
| A | 0 | 532 | 0 |
| B | 0 | 532 | 0 |
| C | 0 | 532 | 0 |
| D | 0 | 532 | 0 |
| Quadrant | Total seconds | Saturated seconds | Saturation percentage |
|---|---|---|---|
| A | 25972 | 1001 | 3.854151% |
| B | 25972 | 1900 | 7.315571% |
| C | 25972 | 181 | 0.696904% |
| D | 25972 | 912 | 3.511474% |
Noise dominated data is calculated using 1-second bins in cleaned event files. If a bin has >2000 counts, and if more than 50% of those come from <1% of pixels, then it is considered to be noise-dominated and hence unusable.
| Quadrant | # 1 sec bins | Bins with >0 counts | Bins with >2000 counts | High rate bins dominated by noise | Noise dominated (total time) | Noise dominated (detector-on time) | Marked lightcurve |
|---|---|---|---|---|---|---|---|
| A | 38077 | 25976 | 792 | 792 | 2.08% | 3.05% | 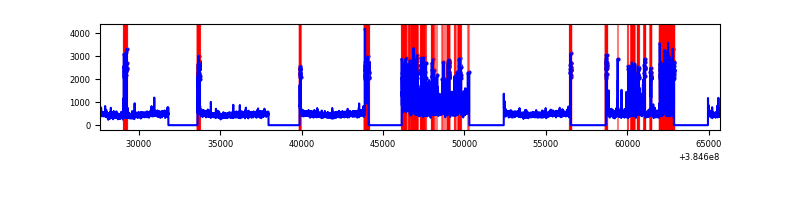 |
| B | 38077 | 25977 | 1463 | 1463 | 3.84% | 5.63% | 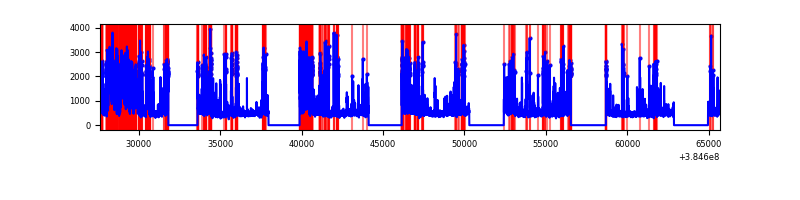 |
| C | 38077 | 25978 | 149 | 149 | 0.39% | 0.57% | 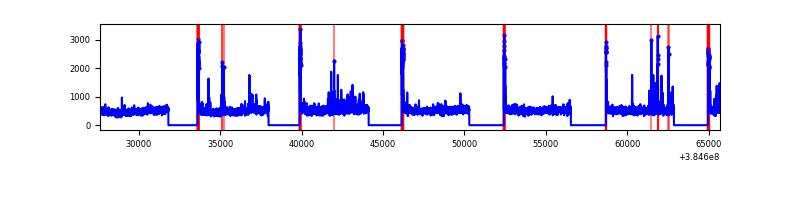 |
| D | 38077 | 25978 | 875 | 875 | 2.30% | 3.37% | 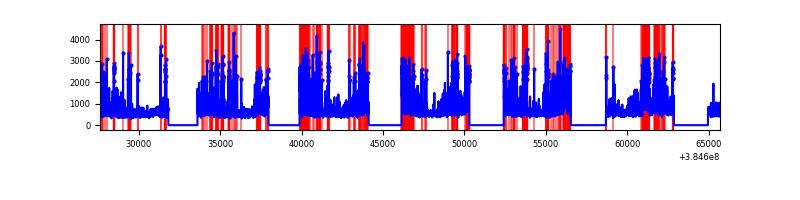 |
Top three noisy pixels from each quadrant. If the there are fewer than three noisy pixels in the level2.evt file, extra rows are filled as -1
| Pixel properties | Quadrant properties | ||||||
|---|---|---|---|---|---|---|---|
| Quadrant | DetID | PixID | Counts | Sigma | Mean | Median | Sigma |
| A | 15 | 169 | 3247381 | 5371.14 | 3070 | 3014 | 604.0 |
| A | 15 | 237 | 872645 | 1439.7 | 3070 | 3014 | 604.0 |
| A | 10 | 83 | 179070 | 291.47 | 3070 | 3014 | 604.0 |
| B | 5 | 172 | 2602529 | 4628.63 | 3060 | 2982 | 561.6 |
| B | 5 | 31 | 2074236 | 3687.98 | 3060 | 2982 | 561.6 |
| B | 5 | 15 | 1128565 | 2004.16 | 3060 | 2982 | 561.6 |
| C | 15 | 214 | 1085706 | 1580.0 | 3041 | 3069 | 685.2 |
| C | 0 | 10 | 536026 | 777.8 | 3041 | 3069 | 685.2 |
| C | 0 | 207 | 269780 | 389.24 | 3041 | 3069 | 685.2 |
| D | 8 | 195 | 3287320 | 4493.11 | 3009 | 2928 | 731.0 |
| D | 1 | 52 | 1300324 | 1774.86 | 3009 | 2928 | 731.0 |
| D | 13 | 249 | 764953 | 1042.47 | 3009 | 2928 | 731.0 |
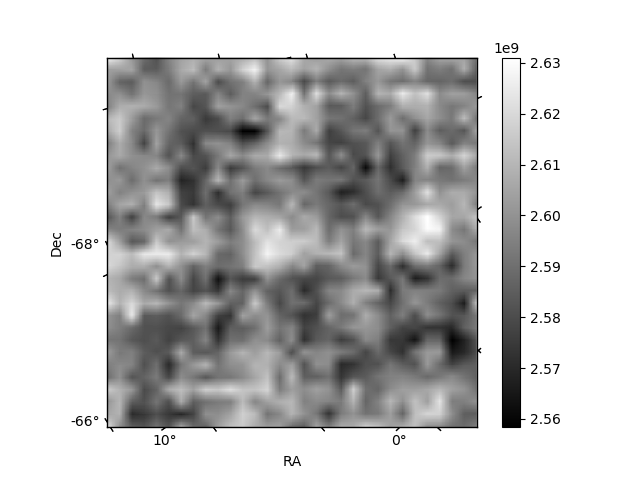
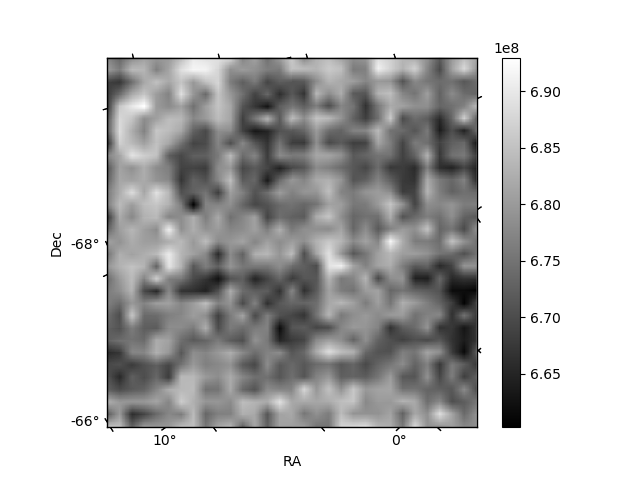
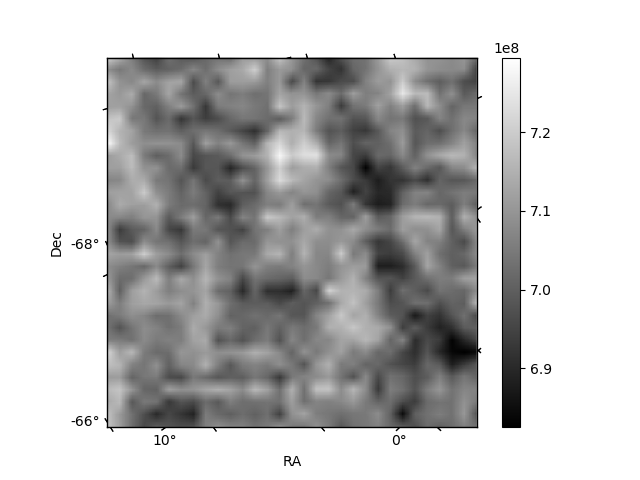
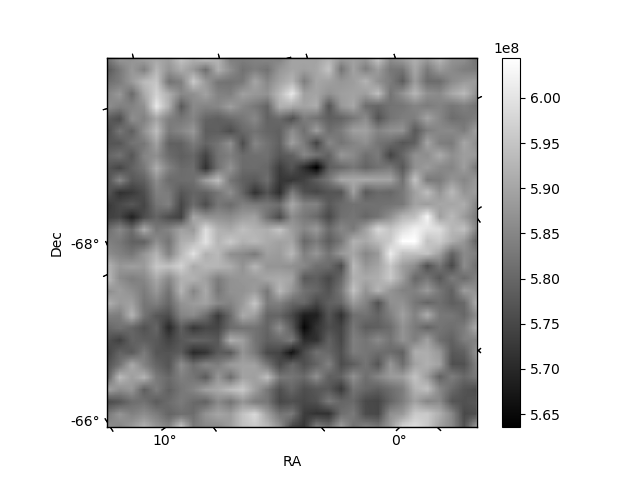
Histogram calculated using DETX and DETY for each event in the final _common_clean file
| Quadrant A | 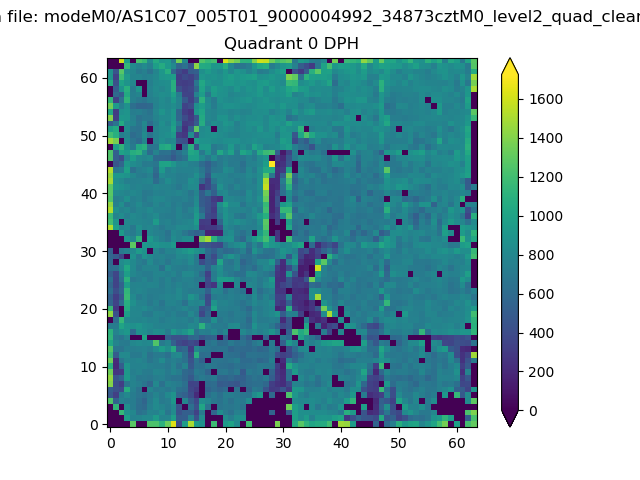 |
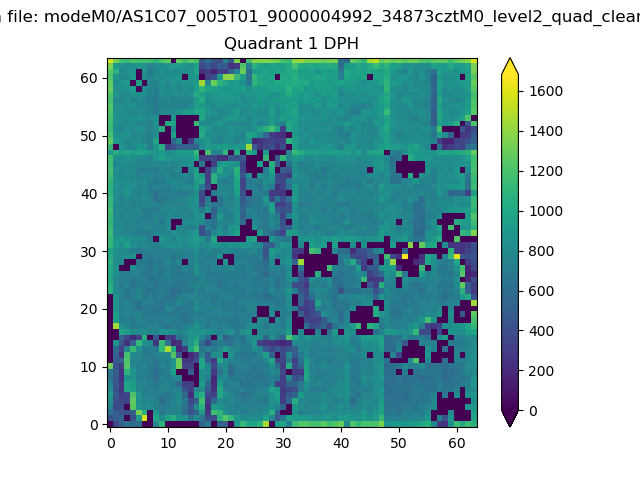 |
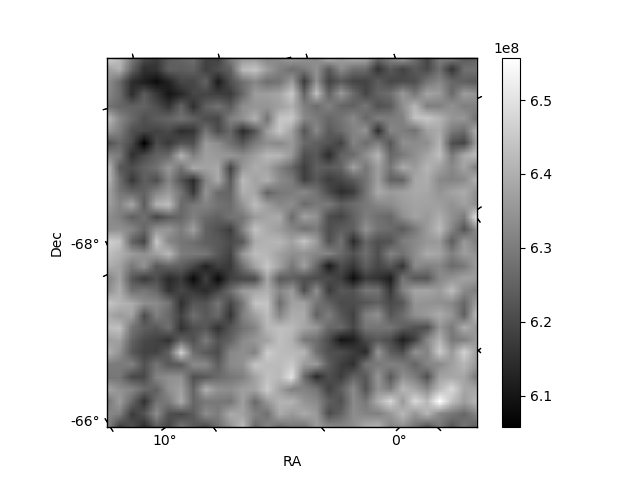
Quadrant B |
|---|---|---|---|
| Quadrant D | 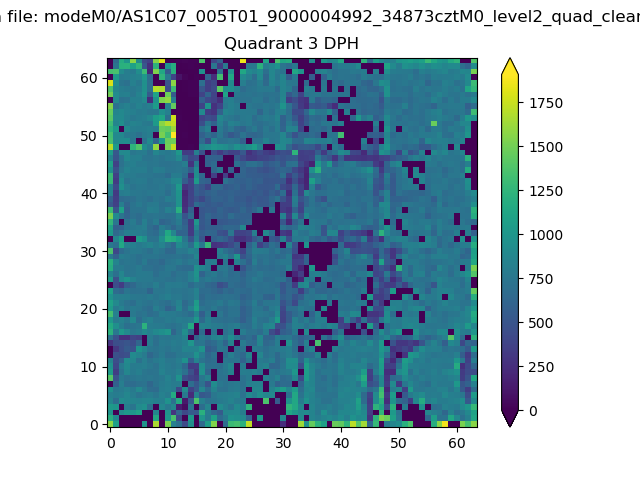 |
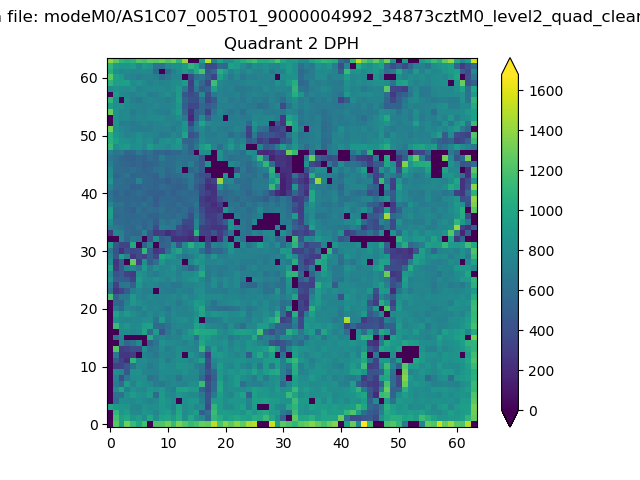 |
Quadrant C |
| Plot type | Count rate plots | Images |
|---|---|---|
| Comparison with Poisson distribution Blue bars denote a histogram of data divided into 1 sec bins. Red curve is a Poisson curve with rate = median count rate of data. |
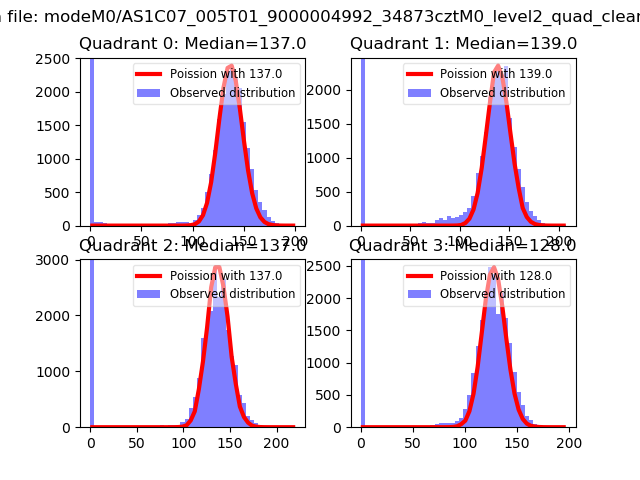 |
 |
| Quadrant-wise count rates Data is divided into 100 sec bins |
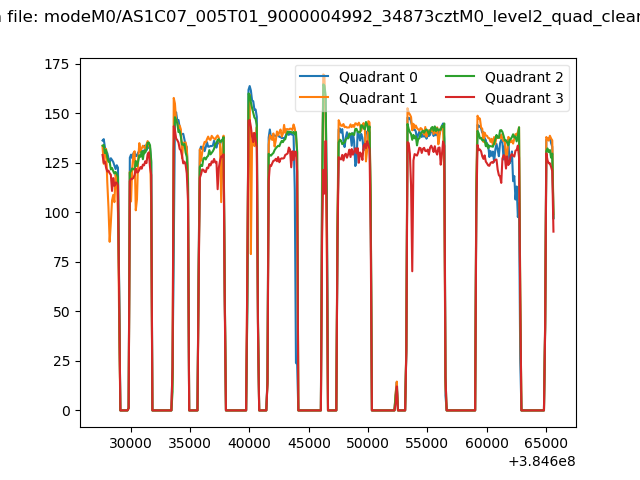 |
|
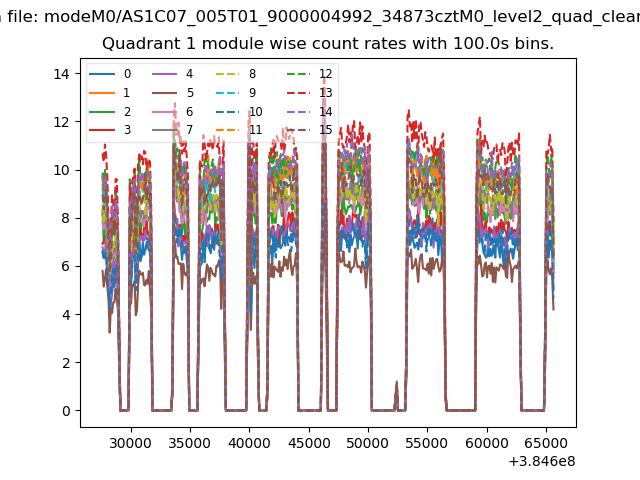
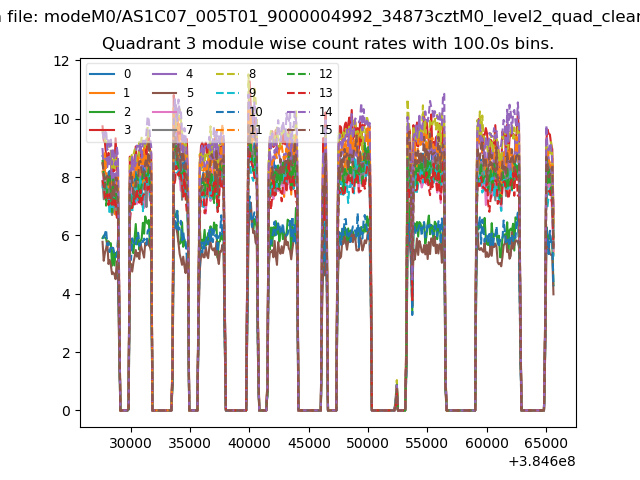
| Module-wise count rates for Quadrant A Data is divided into 100 sec bins |
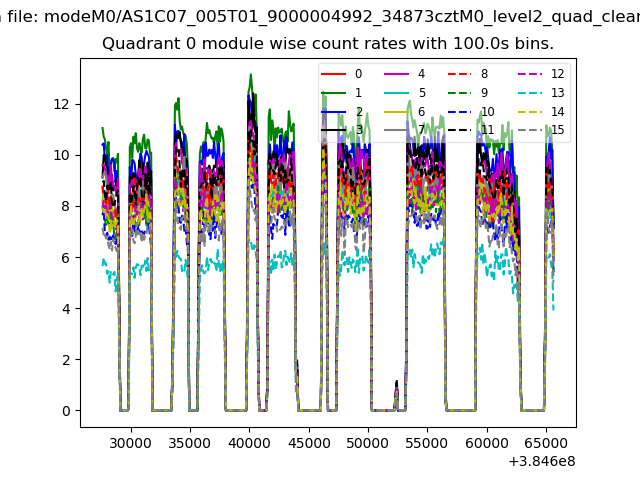 |
 |
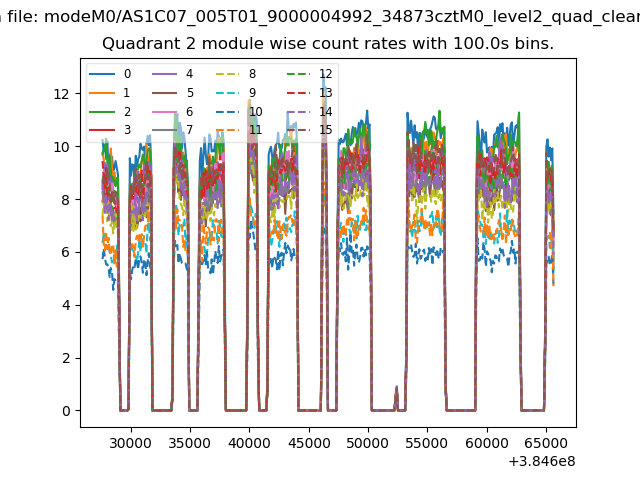
| Module-wise count rates for Quadrant B Data is divided into 100 sec bins |
 |
 |
| Module-wise count rates for Quadrant C Data is divided into 100 sec bins |
 |
 |
| Module-wise count rates for Quadrant D Data is divided into 100 sec bins |
 |
 |
| Parameter | Plot |
|---|---|
| CZT HV Monitor | 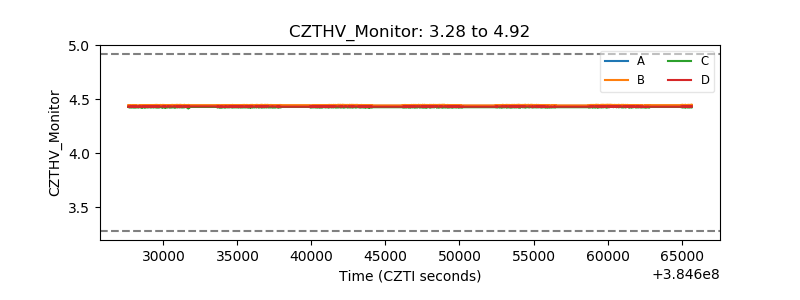 |
| D_VDD | 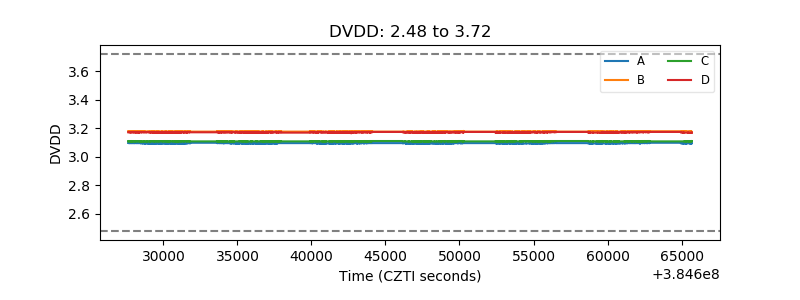 |
| Temperature 1 | 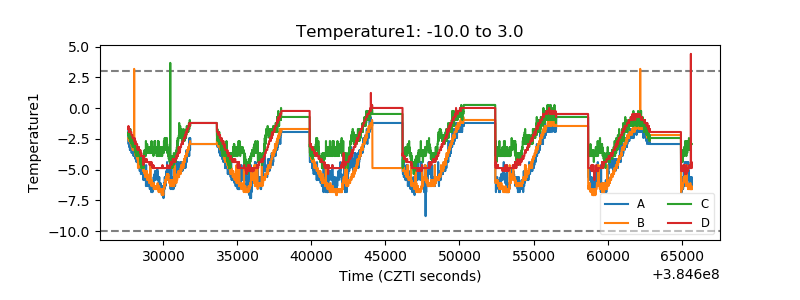 |
| Veto HV Monitor | 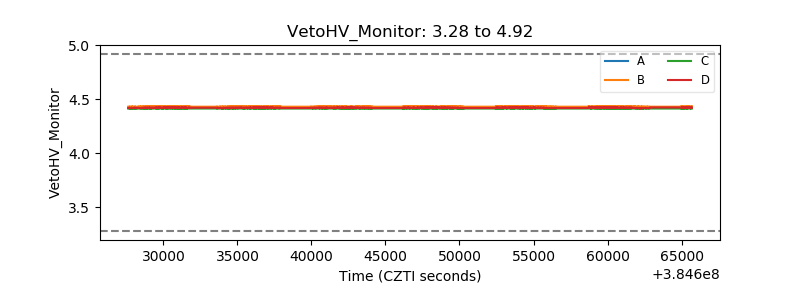 |
| Veto LLD | 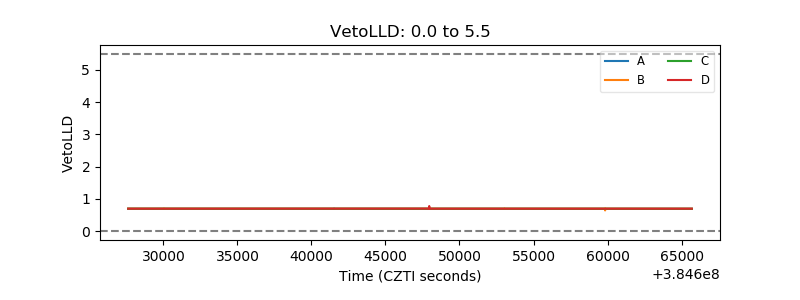 |
| Alpha Counter | 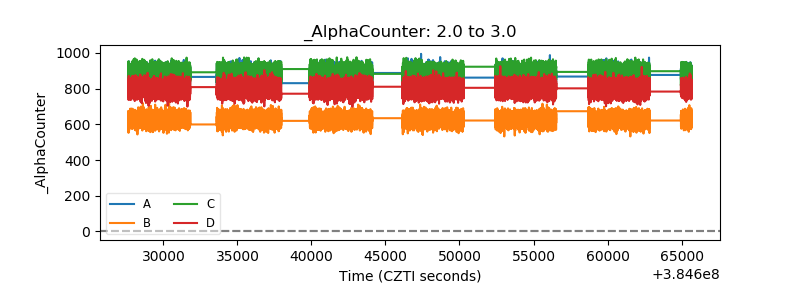 |
| _CPM_Rate | 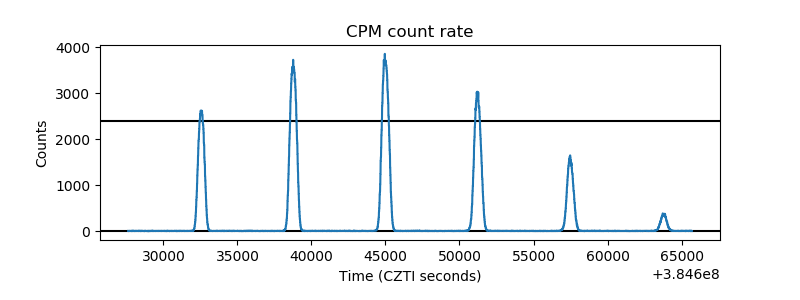 |
| CZT Counter | 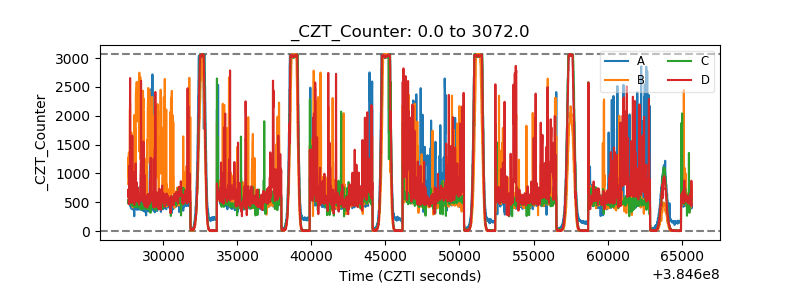 |
| +2.5 Volts monitor | 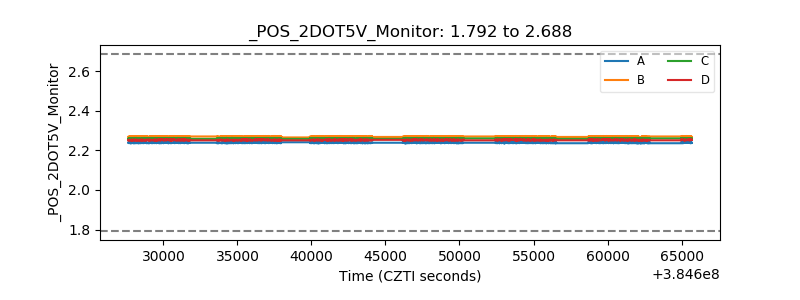 |
| +5 Volts monitor | 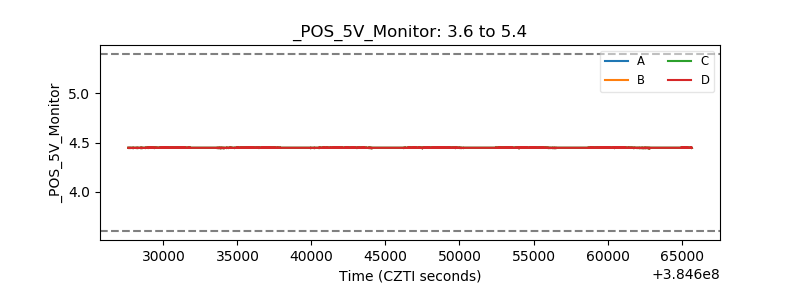 |
| _ROLL_ROT | 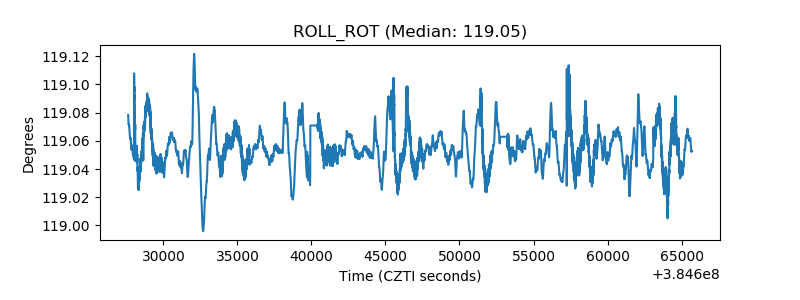 |
| _Roll_DEC | 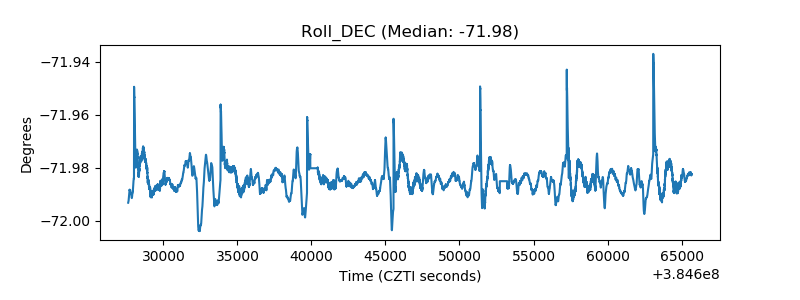 |
| _Roll_RA | 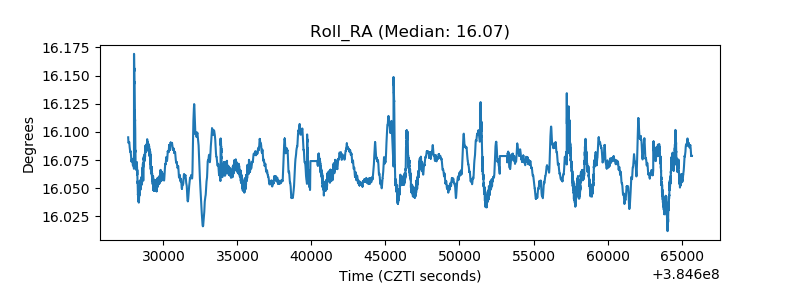 |
| Veto Counter | 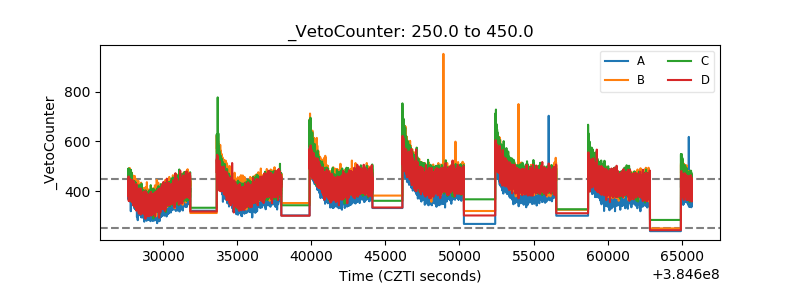 |