| Param | Original file | Final file |
|---|---|---|
| Filename | modeM0/AS1C07_005T01_9000004992_34871cztM0_level2.evt | modeM0/AS1C07_005T01_9000004992_34871cztM0_level2_quad_clean.evt |
| Size (bytes) | 505,831,680 | 72,063,360 |
| Size | 482.4 MB | 68.7 MB |
| Events in quadrant A | 4,467,593 | 462,960 |
| Events in quadrant B | 3,485,755 | 476,191 |
| Events in quadrant C | 2,798,204 | 468,702 |
| Events in quadrant D | 4,231,854 | 426,004 |
| Mode M9 | |||
|---|---|---|---|
| Quadrant | BADHDUFLAG | Total packets | Discarded packets |
| A | 0 | 38 | 0 |
| B | 0 | 38 | 0 |
| C | 0 | 38 | 0 |
| D | 0 | 39 | 0 |
| Mode M0 | |||
|---|---|---|---|
| Quadrant | BADHDUFLAG | Total packets | Discarded packets |
| A | 0 | 16545 | 3 |
| B | 0 | 13459 | 2 |
| C | 0 | 10928 | 2 |
| D | 0 | 15914 | 2 |
| Mode SS | |||
|---|---|---|---|
| Quadrant | BADHDUFLAG | Total packets | Discarded packets |
| A | 0 | 102 | 0 |
| B | 0 | 102 | 0 |
| C | 0 | 102 | 0 |
| D | 0 | 102 | 0 |
| Quadrant | Total seconds | Saturated seconds | Saturation percentage |
|---|---|---|---|
| A | 4959 | 274 | 5.525308% |
| B | 4959 | 231 | 4.658197% |
| C | 4959 | 55 | 1.109095% |
| D | 4959 | 340 | 6.856221% |
Noise dominated data is calculated using 1-second bins in cleaned event files. If a bin has >2000 counts, and if more than 50% of those come from <1% of pixels, then it is considered to be noise-dominated and hence unusable.
| Quadrant | # 1 sec bins | Bins with >0 counts | Bins with >2000 counts | High rate bins dominated by noise | Noise dominated (total time) | Noise dominated (detector-on time) | Marked lightcurve |
|---|---|---|---|---|---|---|---|
| A | 7081 | 4960 | 213 | 213 | 3.01% | 4.29% | 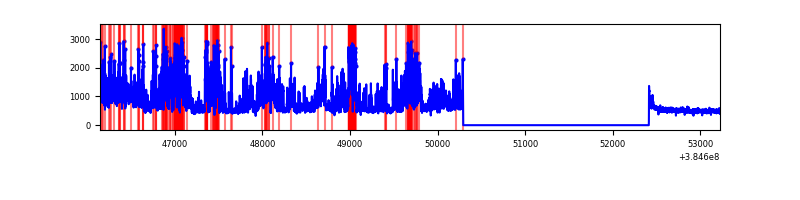 |
| B | 7081 | 4960 | 171 | 171 | 2.41% | 3.45% | 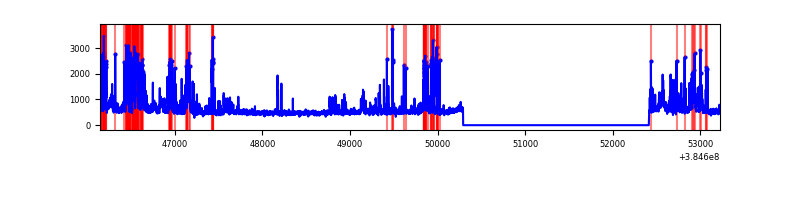 |
| C | 7081 | 4960 | 46 | 46 | 0.65% | 0.93% | 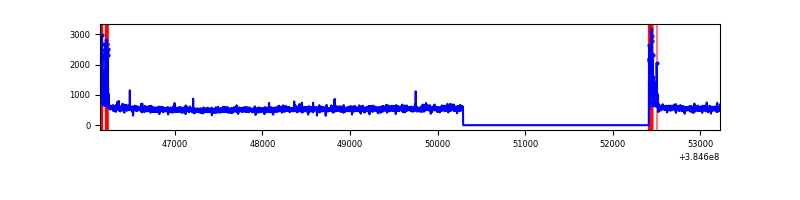 |
| D | 7081 | 4960 | 327 | 327 | 4.62% | 6.59% | 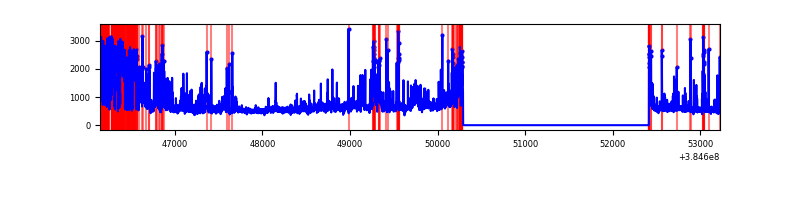 |
Top three noisy pixels from each quadrant. If the there are fewer than three noisy pixels in the level2.evt file, extra rows are filled as -1
| Pixel properties | Quadrant properties | ||||||
|---|---|---|---|---|---|---|---|
| Quadrant | DetID | PixID | Counts | Sigma | Mean | Median | Sigma |
| A | 15 | 169 | 2032827 | 16793.79 | 611 | 602 | 121.0 |
| A | 10 | 83 | 51545 | 420.98 | 611 | 602 | 121.0 |
| A | 13 | 6 | 15530 | 123.36 | 611 | 602 | 121.0 |
| B | 5 | 172 | 631606 | 5624.77 | 612 | 599 | 112.2 |
| B | 0 | 190 | 195683 | 1738.97 | 612 | 599 | 112.2 |
| B | 5 | 31 | 74286 | 656.84 | 612 | 599 | 112.2 |
| C | 15 | 214 | 210108 | 1530.33 | 604 | 609 | 136.9 |
| C | 0 | 10 | 178454 | 1299.1 | 604 | 609 | 136.9 |
| C | 0 | 207 | 25763 | 183.74 | 604 | 609 | 136.9 |
| D | 8 | 195 | 981536 | 6677.9 | 590 | 577 | 146.9 |
| D | 12 | 227 | 324598 | 2205.78 | 590 | 577 | 146.9 |
| D | 1 | 52 | 214301 | 1454.93 | 590 | 577 | 146.9 |
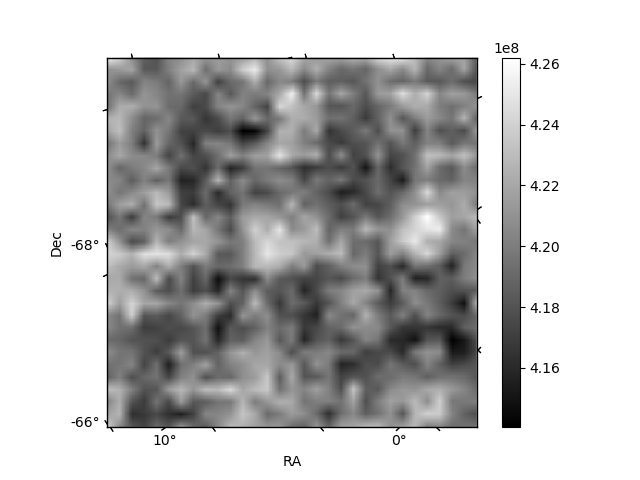
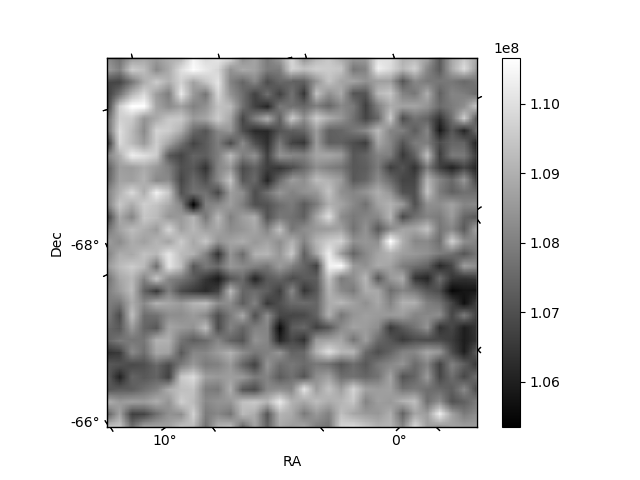
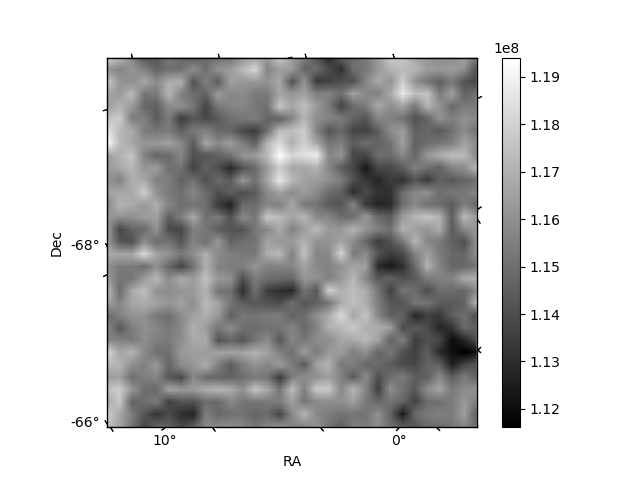
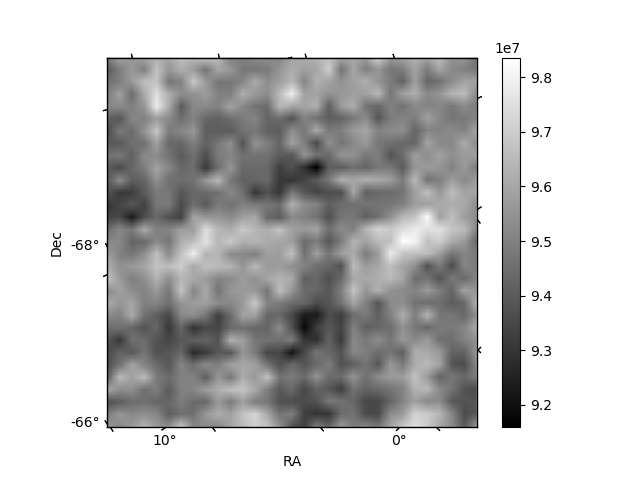
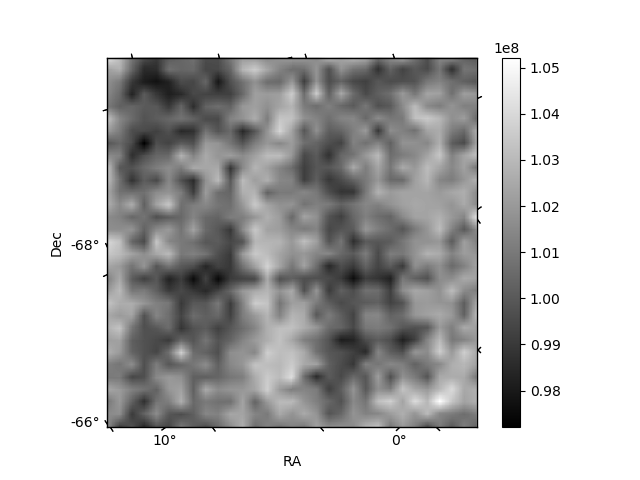
Histogram calculated using DETX and DETY for each event in the final _common_clean file
| Quadrant A | 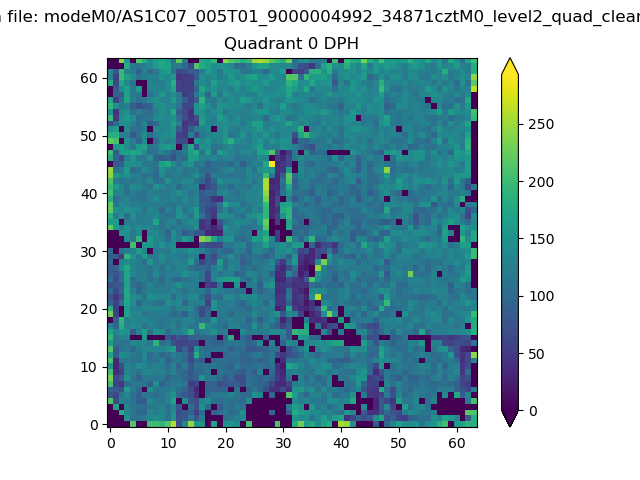 |
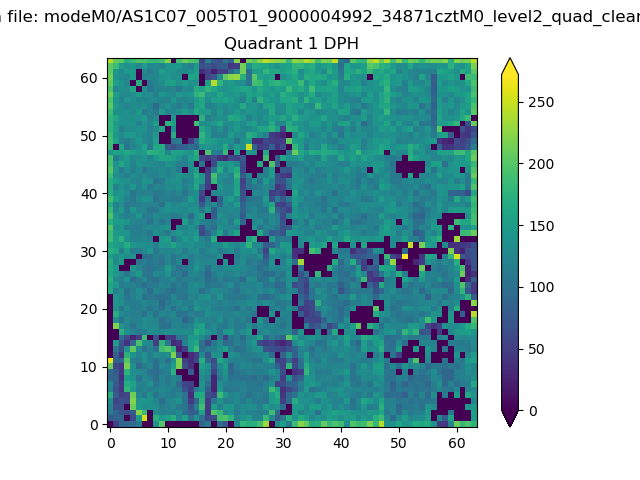 |
Quadrant B |
|---|---|---|---|
| Quadrant D | 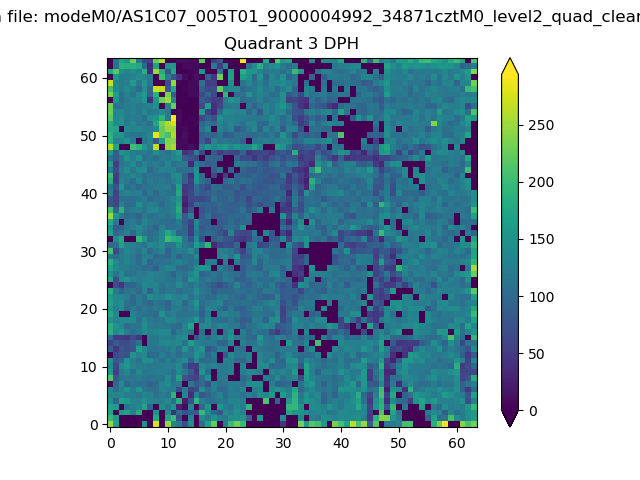 |
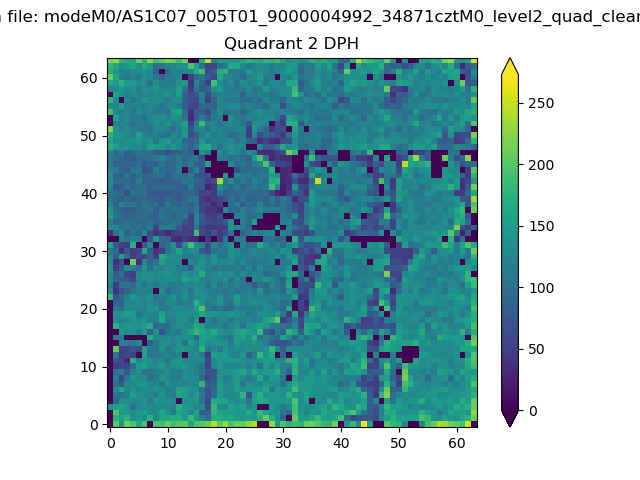 |
Quadrant C |
| Plot type | Count rate plots | Images |
|---|---|---|
| Comparison with Poisson distribution Blue bars denote a histogram of data divided into 1 sec bins. Red curve is a Poisson curve with rate = median count rate of data. |
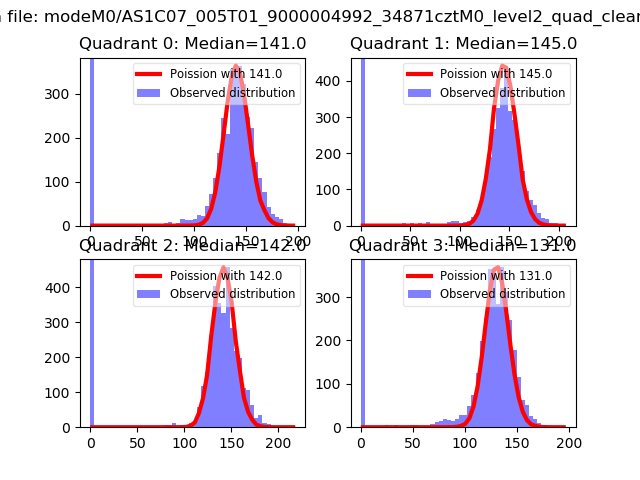 |
 |
| Quadrant-wise count rates Data is divided into 100 sec bins |
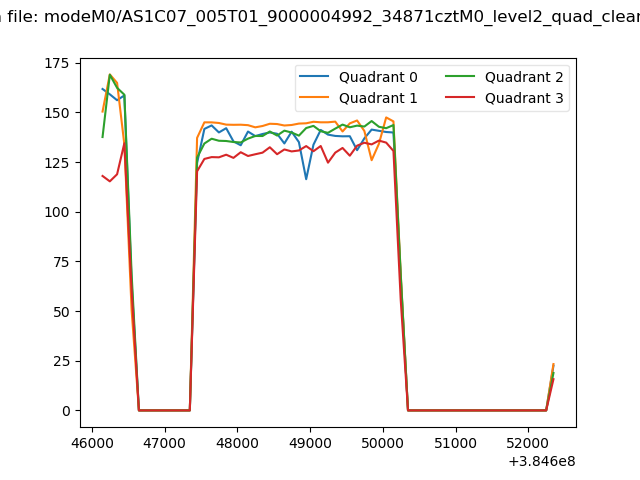 |
|
| Module-wise count rates for Quadrant A Data is divided into 100 sec bins |
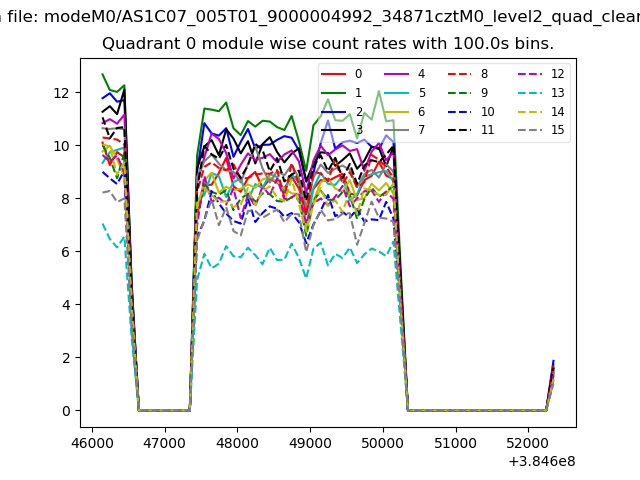 |
 |
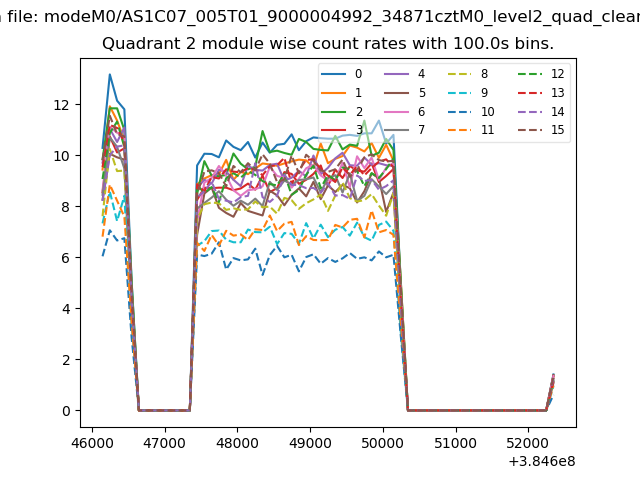
| Module-wise count rates for Quadrant B Data is divided into 100 sec bins |
 |
 |
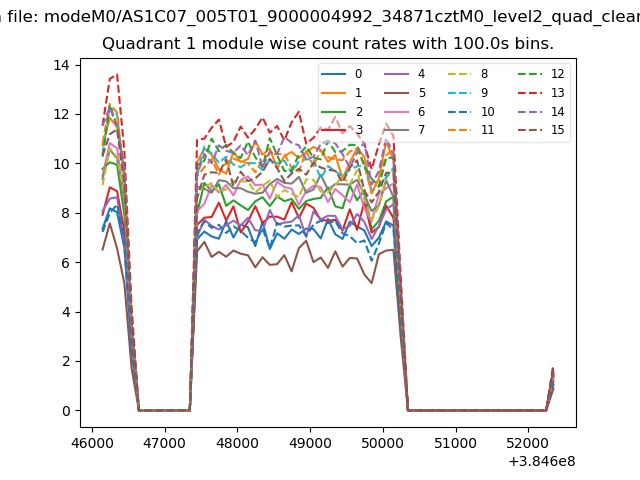
| Module-wise count rates for Quadrant C Data is divided into 100 sec bins |
 |
 |
| Module-wise count rates for Quadrant D Data is divided into 100 sec bins |
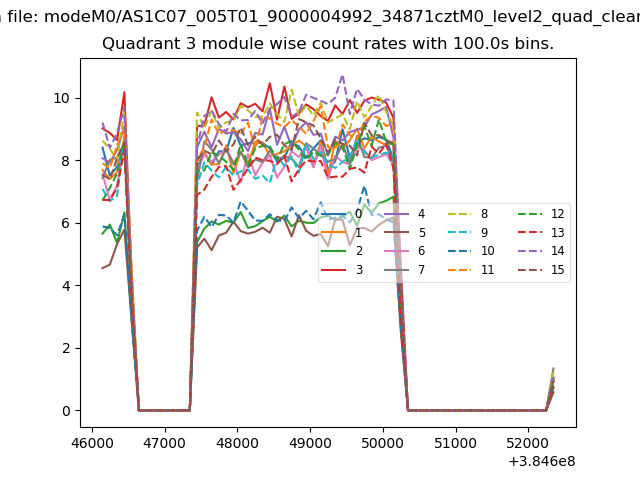 |
 |
| Parameter | Plot |
|---|---|
| CZT HV Monitor | 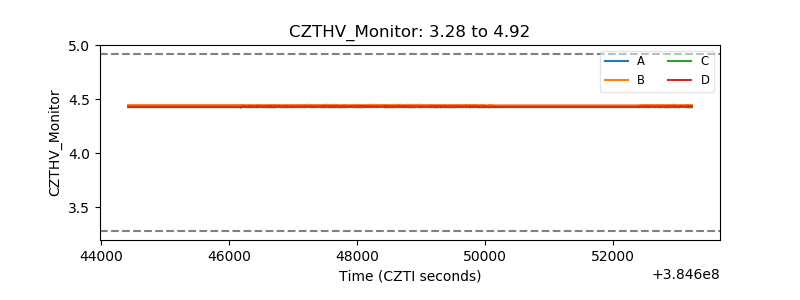 |
| D_VDD | 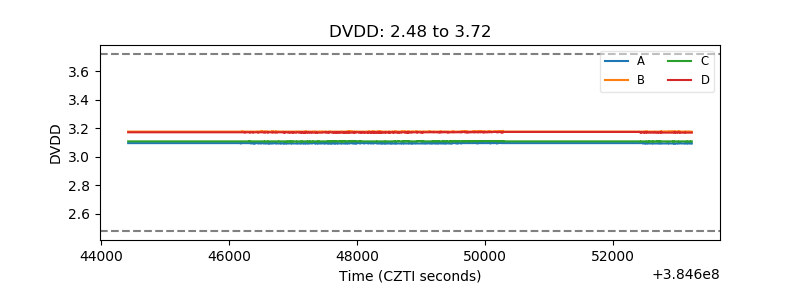 |
| Temperature 1 | 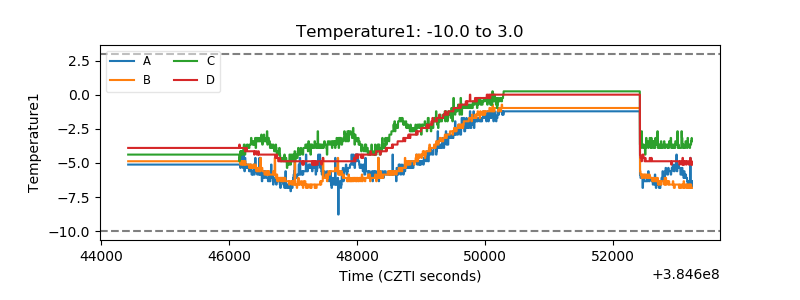 |
| Veto HV Monitor | 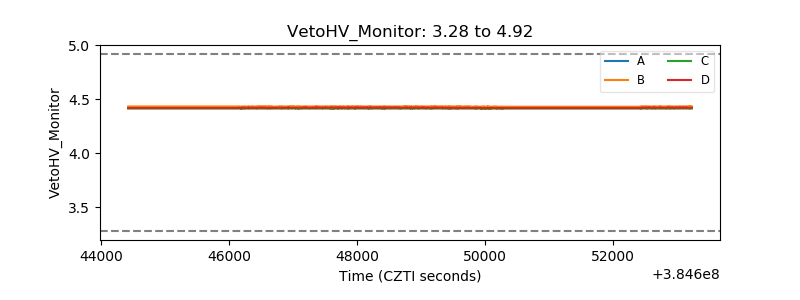 |
| Veto LLD | 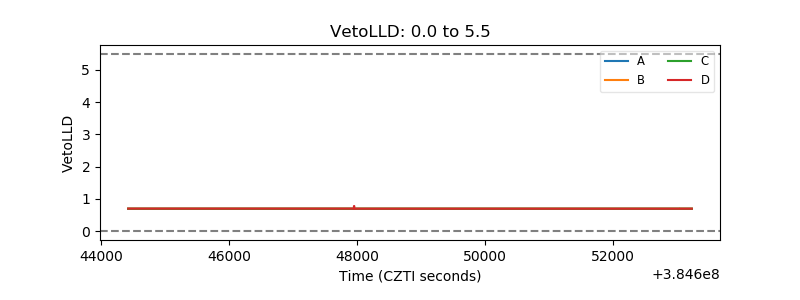 |
| Alpha Counter | 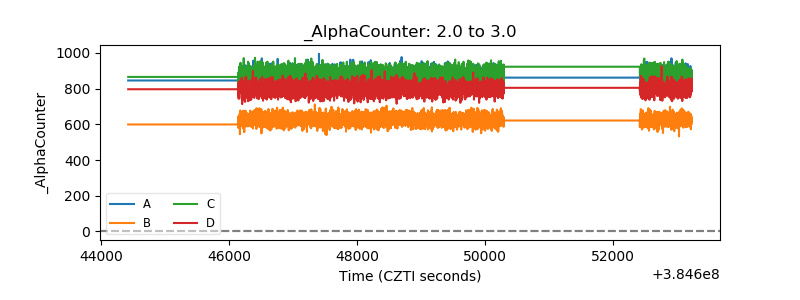 |
| _CPM_Rate | 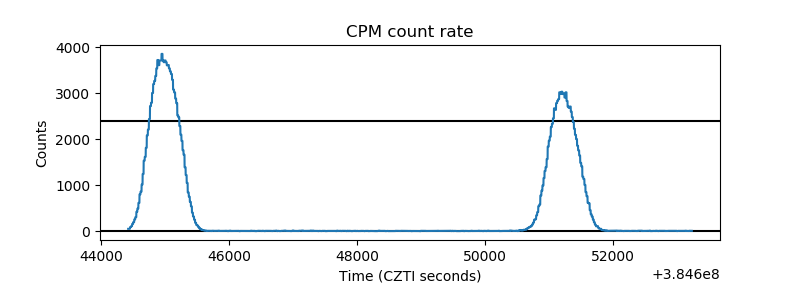 |
| CZT Counter | 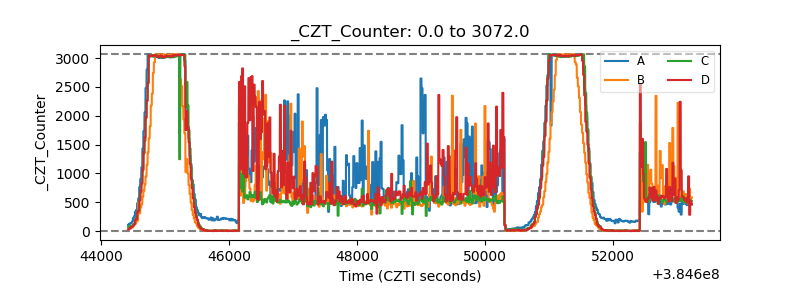 |
| +2.5 Volts monitor | 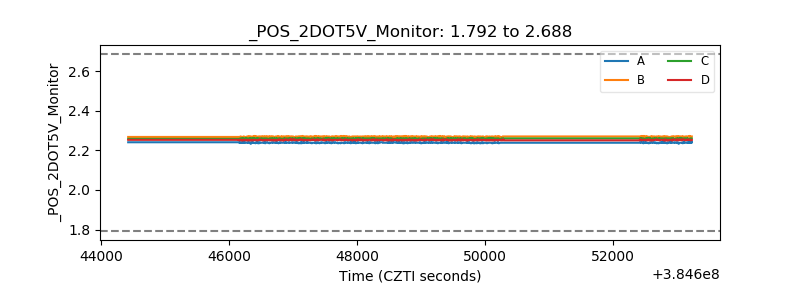 |
| +5 Volts monitor | 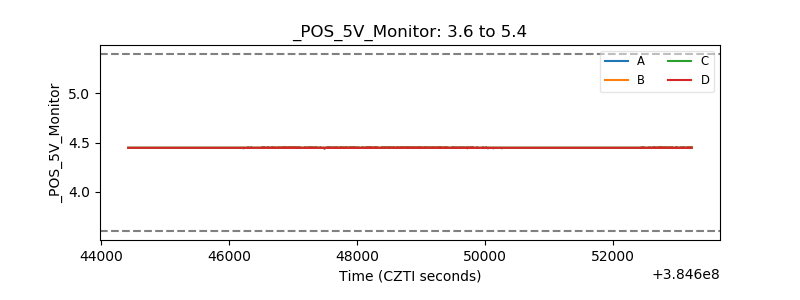 |
| _ROLL_ROT | 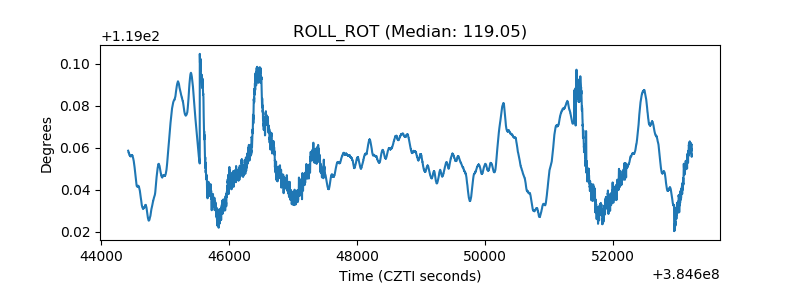 |
| _Roll_DEC | 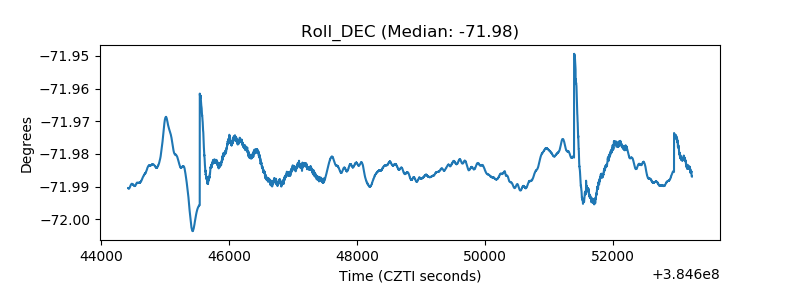 |
| _Roll_RA | 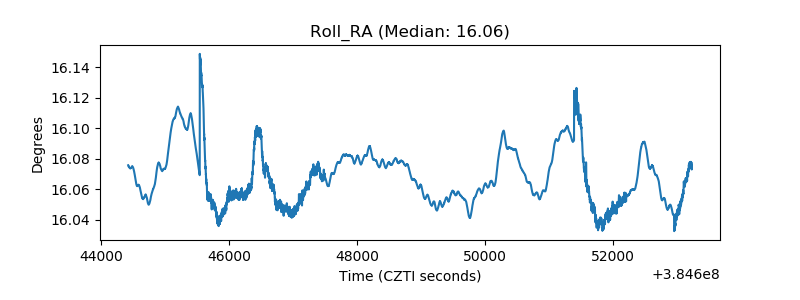 |
| Veto Counter | 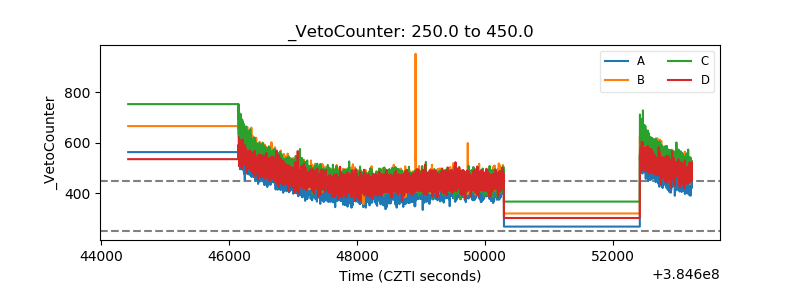 |