| Param | Original file | Final file |
|---|---|---|
| Filename | modeM0/AS1C07_005T01_9000004992_34870cztM0_level2.evt | modeM0/AS1C07_005T01_9000004992_34870cztM0_level2_quad_clean.evt |
| Size (bytes) | 488,989,440 | 80,979,840 |
| Size | 466.3 MB | 77.2 MB |
| Events in quadrant A | 3,337,113 | 528,912 |
| Events in quadrant B | 4,044,845 | 537,612 |
| Events in quadrant C | 2,893,845 | 539,630 |
| Events in quadrant D | 4,196,631 | 497,623 |
| Mode M9 | |||
|---|---|---|---|
| Quadrant | BADHDUFLAG | Total packets | Discarded packets |
| A | 0 | 34 | 0 |
| B | 0 | 34 | 0 |
| C | 0 | 34 | 0 |
| D | 0 | 35 | 0 |
| Mode M0 | |||
|---|---|---|---|
| Quadrant | BADHDUFLAG | Total packets | Discarded packets |
| A | 0 | 13001 | 3 |
| B | 0 | 15200 | 2 |
| C | 0 | 11401 | 2 |
| D | 0 | 15767 | 2 |
| Mode SS | |||
|---|---|---|---|
| Quadrant | BADHDUFLAG | Total packets | Discarded packets |
| A | 0 | 100 | 0 |
| B | 0 | 100 | 0 |
| C | 0 | 100 | 0 |
| D | 0 | 100 | 0 |
| Quadrant | Total seconds | Saturated seconds | Saturation percentage |
|---|---|---|---|
| A | 4969 | 287 | 5.775810% |
| B | 4969 | 534 | 10.746629% |
| C | 4969 | 67 | 1.348360% |
| D | 4969 | 344 | 6.922922% |
Noise dominated data is calculated using 1-second bins in cleaned event files. If a bin has >2000 counts, and if more than 50% of those come from <1% of pixels, then it is considered to be noise-dominated and hence unusable.
| Quadrant | # 1 sec bins | Bins with >0 counts | Bins with >2000 counts | High rate bins dominated by noise | Noise dominated (total time) | Noise dominated (detector-on time) | Marked lightcurve |
|---|---|---|---|---|---|---|---|
| A | 7002 | 4969 | 244 | 244 | 3.48% | 4.91% | 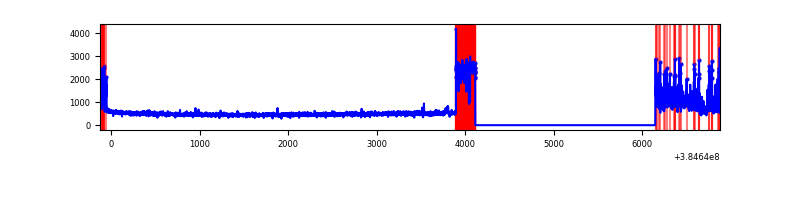 |
| B | 7002 | 4970 | 407 | 407 | 5.81% | 8.19% | 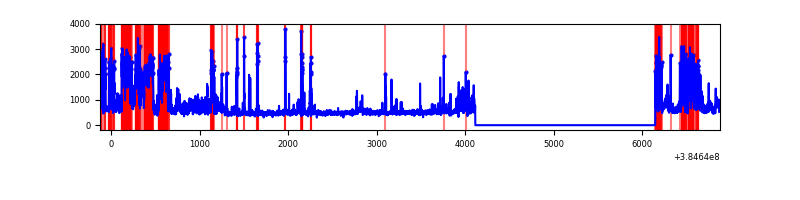 |
| C | 7002 | 4970 | 60 | 60 | 0.86% | 1.21% | 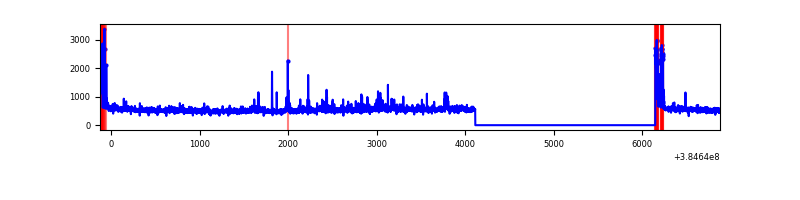 |
| D | 7002 | 4970 | 351 | 351 | 5.01% | 7.06% | 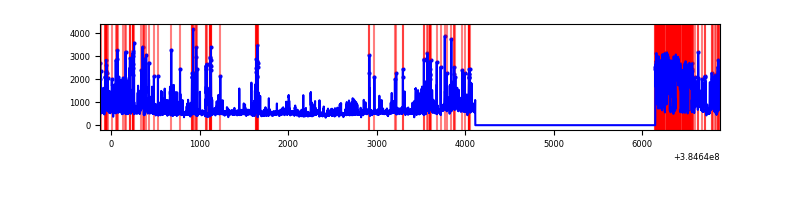 |
Top three noisy pixels from each quadrant. If the there are fewer than three noisy pixels in the level2.evt file, extra rows are filled as -1
| Pixel properties | Quadrant properties | ||||||
|---|---|---|---|---|---|---|---|
| Quadrant | DetID | PixID | Counts | Sigma | Mean | Median | Sigma |
| A | 15 | 169 | 931379 | 7919.85 | 590 | 580 | 117.5 |
| A | 15 | 237 | 51305 | 431.6 | 590 | 580 | 117.5 |
| A | 10 | 83 | 51157 | 430.34 | 590 | 580 | 117.5 |
| B | 5 | 172 | 579101 | 5235.73 | 595 | 580 | 110.5 |
| B | 0 | 190 | 524435 | 4740.99 | 595 | 580 | 110.5 |
| B | 5 | 31 | 243197 | 2195.73 | 595 | 580 | 110.5 |
| C | 15 | 214 | 211846 | 1573.22 | 590 | 594 | 134.3 |
| C | 0 | 10 | 195674 | 1452.79 | 590 | 594 | 134.3 |
| C | 0 | 207 | 87959 | 650.62 | 590 | 594 | 134.3 |
| D | 8 | 195 | 1152855 | 7999.48 | 575 | 561 | 144.0 |
| D | 1 | 52 | 248644 | 1722.25 | 575 | 561 | 144.0 |
| D | 12 | 6 | 132723 | 917.5 | 575 | 561 | 144.0 |
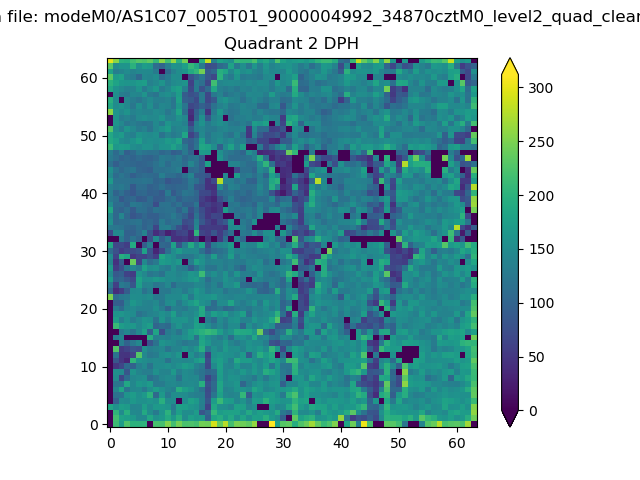
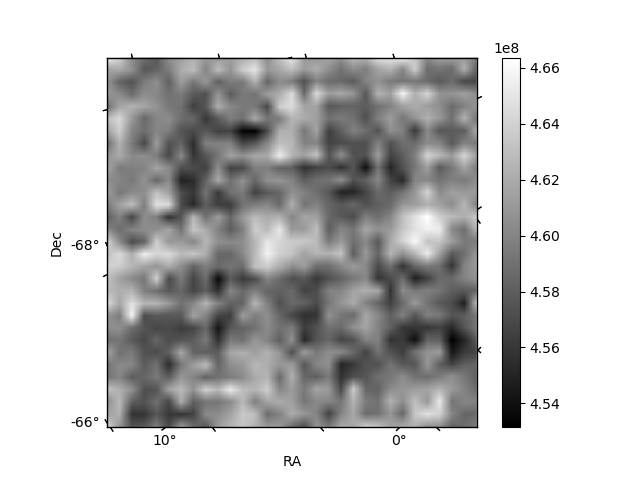
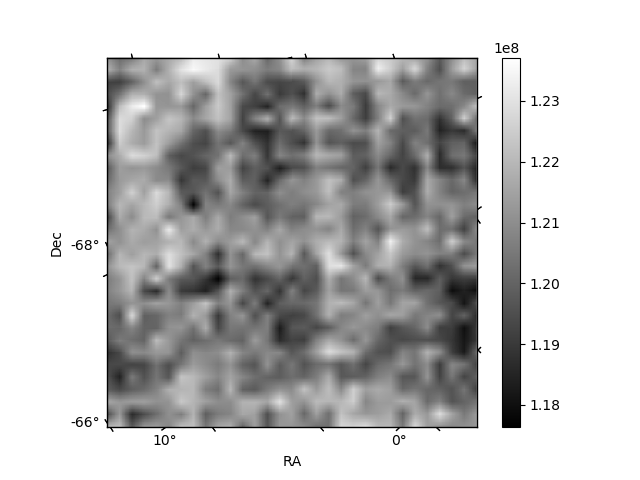
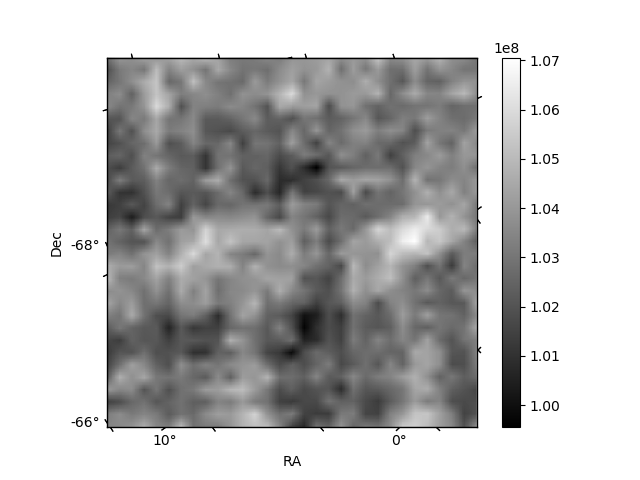
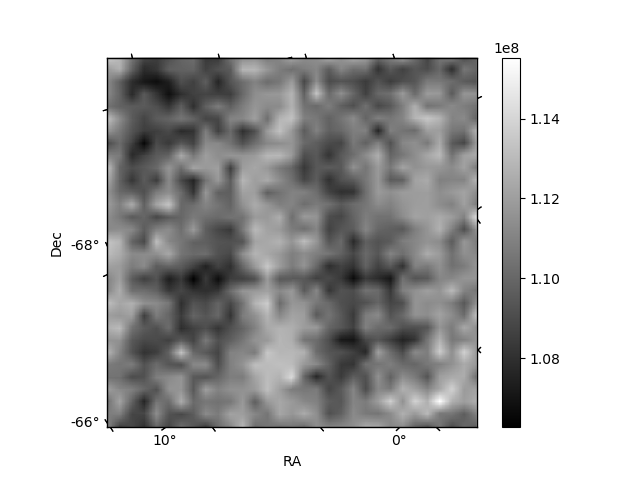
Histogram calculated using DETX and DETY for each event in the final _common_clean file
| Quadrant A | 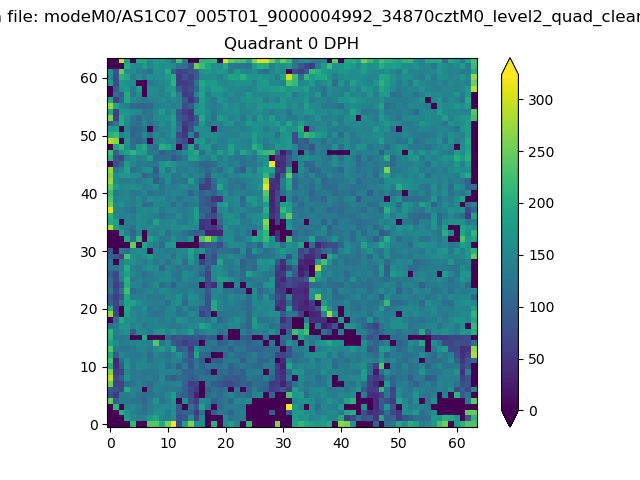 |
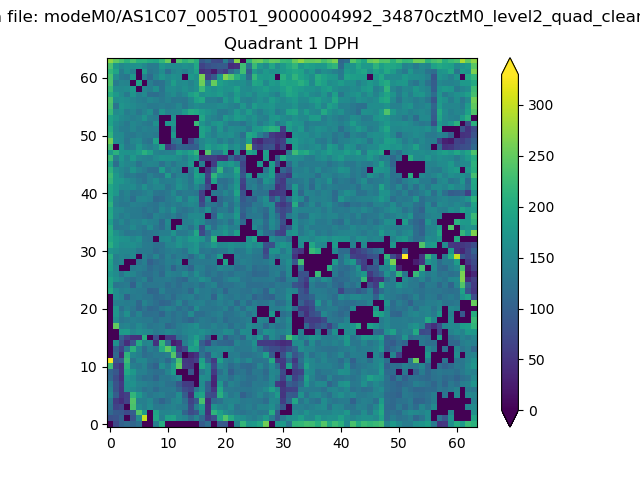 |
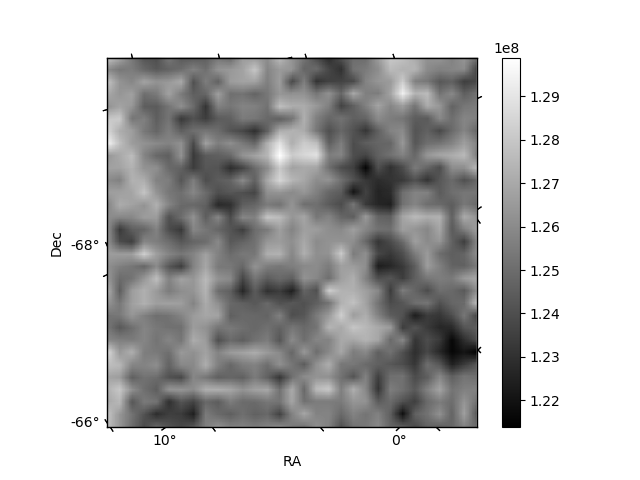
Quadrant B |
|---|---|---|---|
| Quadrant D | 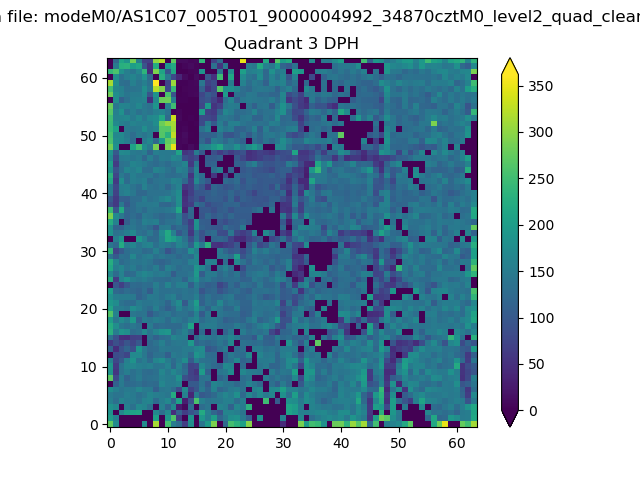 |
 |
Quadrant C |
| Plot type | Count rate plots | Images |
|---|---|---|
| Comparison with Poisson distribution Blue bars denote a histogram of data divided into 1 sec bins. Red curve is a Poisson curve with rate = median count rate of data. |
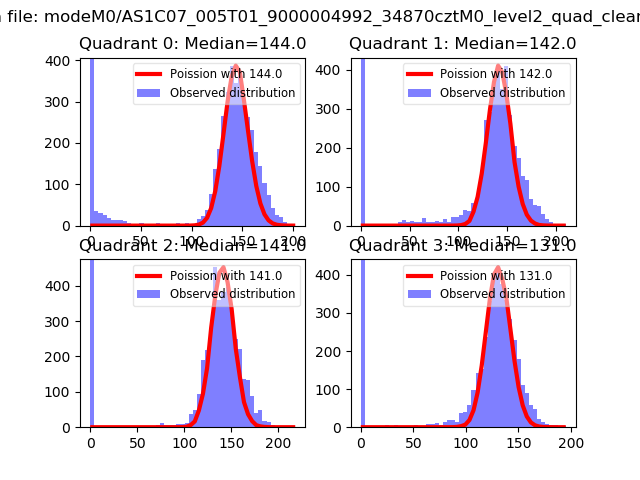 |
 |
| Quadrant-wise count rates Data is divided into 100 sec bins |
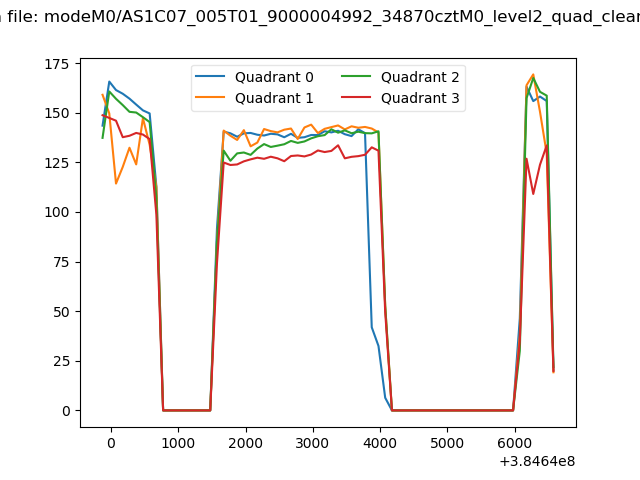 |
|
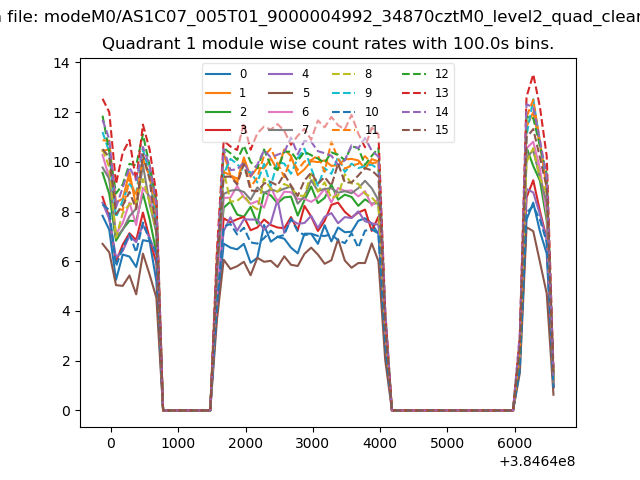
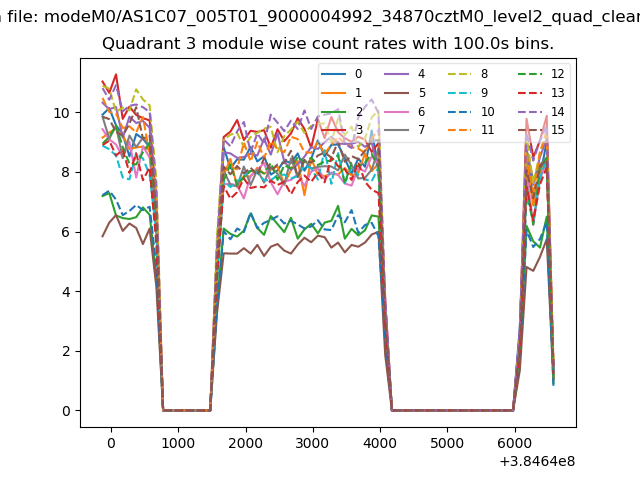
| Module-wise count rates for Quadrant A Data is divided into 100 sec bins |
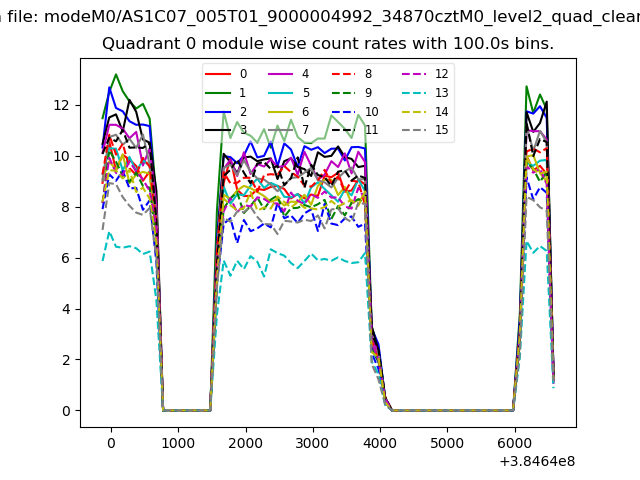 |
 |
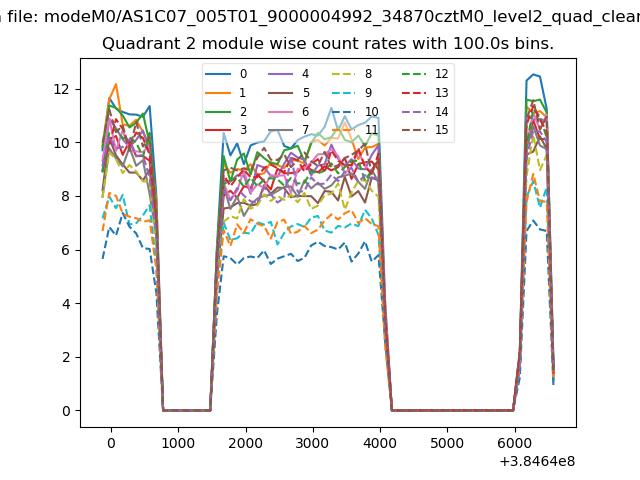
| Module-wise count rates for Quadrant B Data is divided into 100 sec bins |
 |
 |
| Module-wise count rates for Quadrant C Data is divided into 100 sec bins |
 |
 |
| Module-wise count rates for Quadrant D Data is divided into 100 sec bins |
 |
 |
| Parameter | Plot |
|---|---|
| CZT HV Monitor | 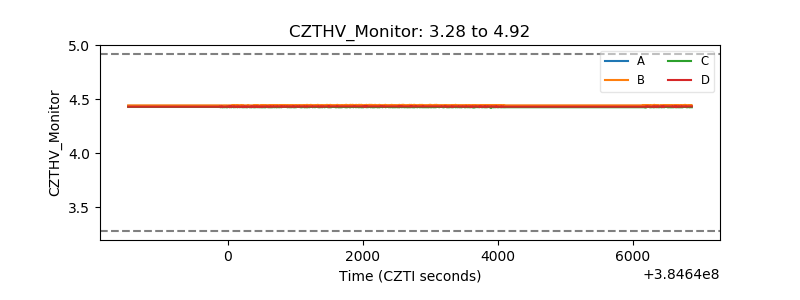 |
| D_VDD | 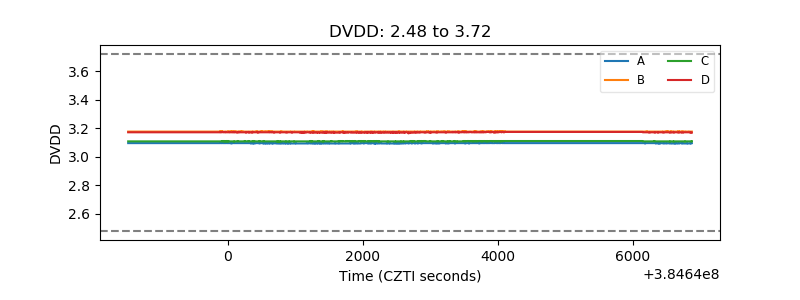 |
| Temperature 1 | 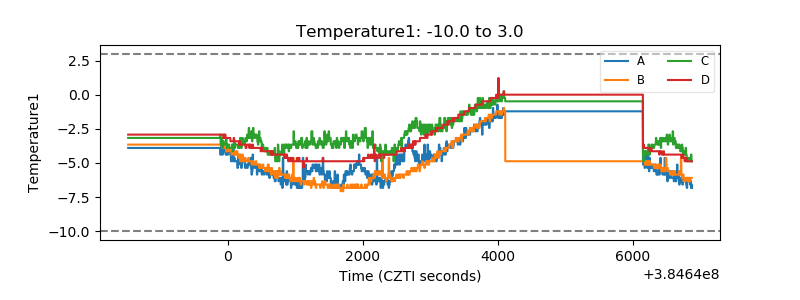 |
| Veto HV Monitor | 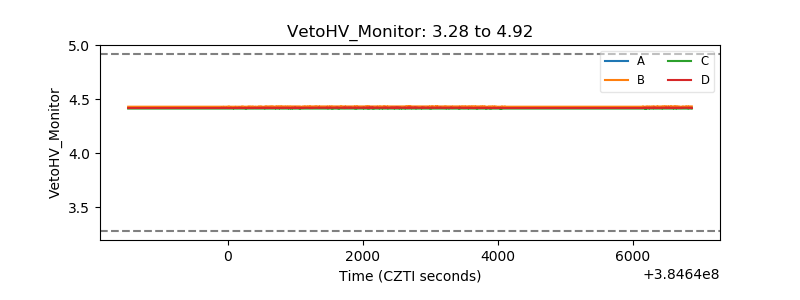 |
| Veto LLD | 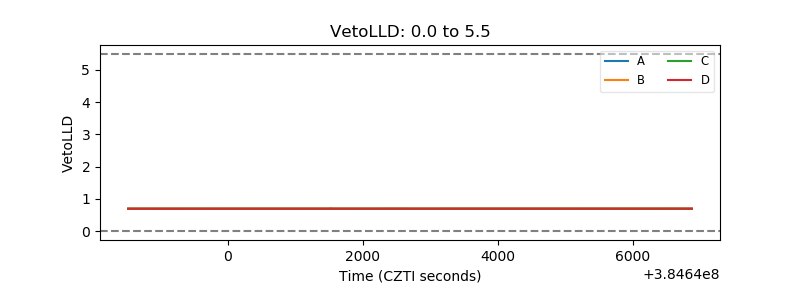 |
| Alpha Counter | 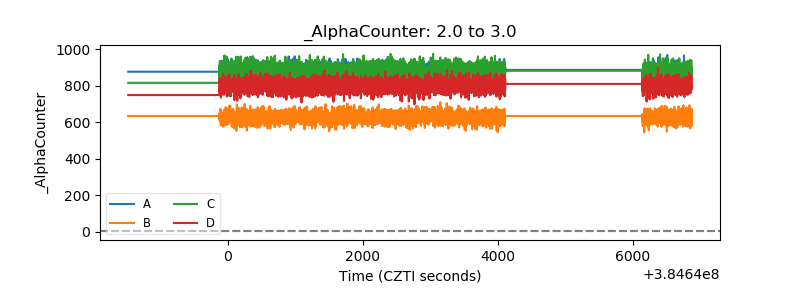 |
| _CPM_Rate | 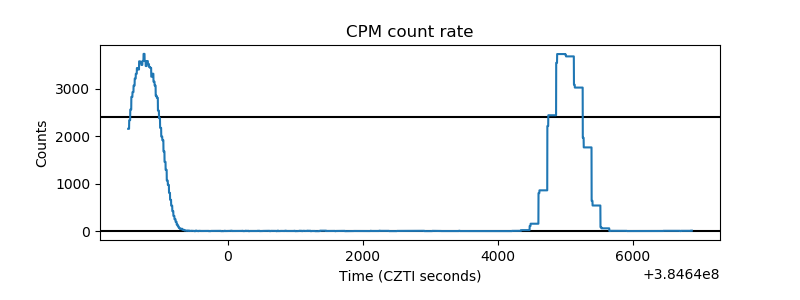 |
| CZT Counter | 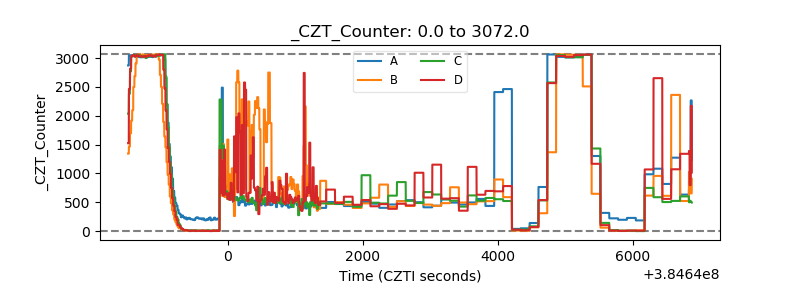 |
| +2.5 Volts monitor | 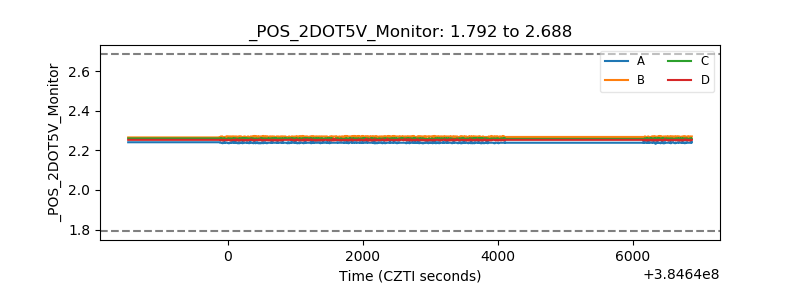 |
| +5 Volts monitor | 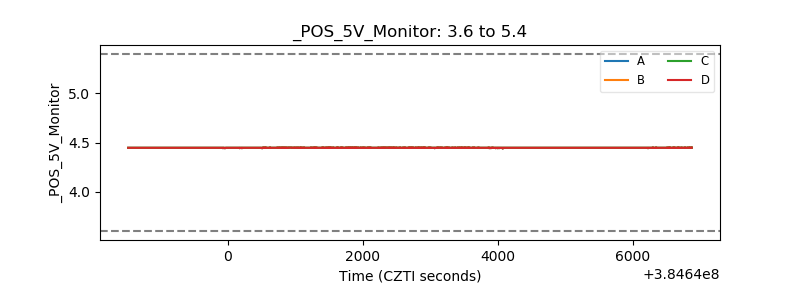 |
| _ROLL_ROT | 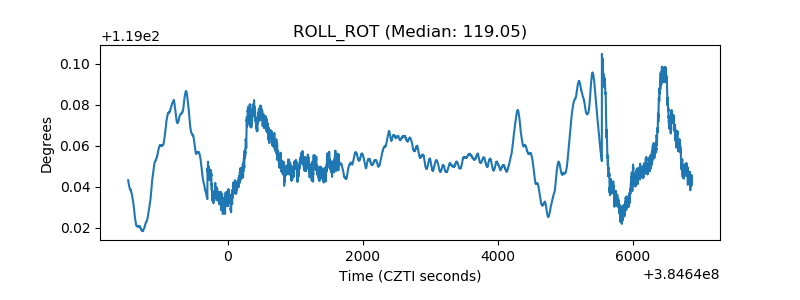 |
| _Roll_DEC | 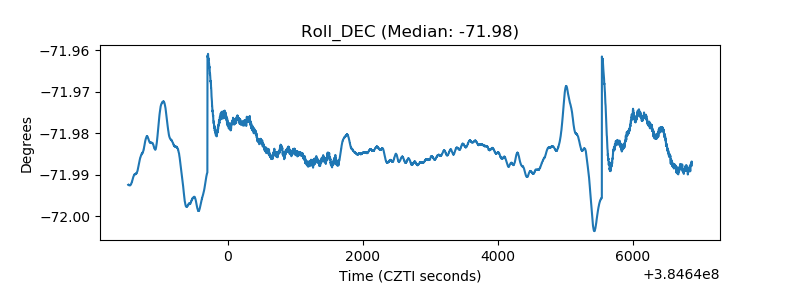 |
| _Roll_RA | 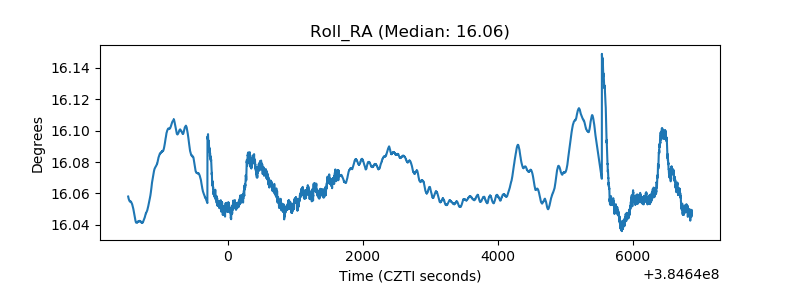 |
| Veto Counter | 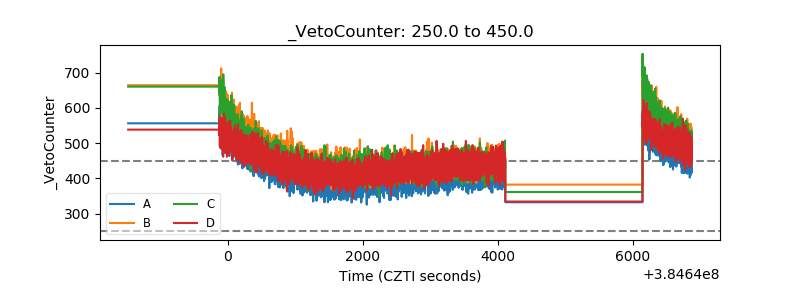 |